

 PDF
PDF Citation
 Print
Print


Lung cancer is a leading cause of cancer-related morbidity and mortality worldwide [1]. Non-small cell lung cancer (NSCLC) accounts for more than 85% of all lung cancers and majority of them are suffering from NSCLC at an advanced stage [2]. Despite the discovery of molecular mutations and advances in diagnosis and treatment, the prognosis for patients with NSCLC remains poor, and a considerable number of patients experience recurrence [1]. Therefore, discovery of new biomarkers aiding in early detection and accurate prediction of tumor behavior could improve patient survival rate [3].
S100 proteins are a calcium-binding protein family with at least twenty members [4]. They have a variety of intracellular and extracellular functions, such as calcium homeostasis, regulation of enzyme activity, protein phosphorylation, cytoskeletal components, transcriptional factors, and chemo-attraction for leukocytes, and macrophage attraction [4,5]. In addition to their physiological functions, it has been demonstrated that the expression levels of S100 proteins increase in many diseases, including cancers [4]. Recent clinical and experimental data have suggested that changes in the expression and/or function of S100 proteins may represent a key step during cancer development [6]. Moreover, genomic rearrangements at the chromosomal region 1q21, where most of the S100 genes are clustered, were frequently observed in human epithelial tumors, e.g., the lung, breast, esophagus, colorectal, and liver, as well as in tumors of soft tissue and bone [6].
S100A8 (calgranulin A) and S100A9 (calgranulin B) are members of the S100 protein family, and have been reported to be overexpressed in various kinds of cancers [6]. Previous studies have suggested that S100A8 and S100A9 play key roles in modulation of inflammation and immune response, which is conducive to genesis of almost all tumors [7]. And several studies demonstrated that S100A8 and S100A9 promote tumor cell proliferation and invasion, and enhance metastatic process, establishing pre-metastatic niches [8-10]. Moreover, some authors reported that gene expression profiling of lung tissue at exosome induced pre-metastatic niches that revealed up-regulation of genes involved in extracellular matrix remodeling and inflammation, effectors of pre-metastatic niche formation such as S100A8 and S100A9 [11-13]. However, little is known about the expressions and prognostic significance of S100A8 and S100A9 in lung cancer.
In this study, we aimed to evaluate the expressions of S100A8 and S100A9 and the relationship between S100A8 and S100A9 expressions, clinicopathological characteristics, and prognostic significance in NSCLC. We also analyzed to compare S100A8 and S100A9 expression between peritumoral inflammatory cells and tumor cells.
MATERIALS AND METHODS
Patients and clinicopathological data
Samples from 148 patients who underwent surgical resection for NSCLC between January, 2002 and December, 2009 at Gyeongsang National University Hospital (Jinju, Korea) were examined by two pathologists. Stages were determined according to the guidelines in the American Joint Committee on Cancer Tumor Node Metastasis (TNM) Classification of Malignant Tumors, seventh edition. The histologic type and differentiation grade of the tumors were determined using the classification system of the World Health Organization, fourth edition. Clinical data and survival data were collected through medical record examination and National Statistical Office (Seoul, Korea) records [14]. Disease-free survival (DFS) was defined as the period from the date of surgery to the date of cancer recurrence, and disease-specific survival (DSS) was defined as from the date of surgery to the date of death, which was mostly due to NSCLC [15]. Smoking history was defined as non-smokers (< 100 lifetime cigarettes) or smokers including current smokers and ex-smokers. This study was approved by the Institutional Review Board of Gyeongsang National University Hospital with a waiver of informed consent (2017-03-027).
Tissue microarray construction
Hematoxylin and eosin–stained slides were reviewed and the most representative tumor area was marked based on its major differentiation and location near the invasive front on formalin-fixed, paraffin-embedded tissue blocks [14]. A core sized 3 mm in diameter was obtained from each case. In total, five tissue microarray (TMA) blocks were constructed with 30 cores in each block.
Immunohistochemistry
Immunohistochemistry was performed on 4 μm thick sections from TMA blocks. Tissues were stained with monoclonal anti-S100A8 antibody at a dilution of 1:500 (EPR3554, Abcam, Cambridge, UK) and monoclonal anti-S100A9 antibody at a dilution of 1:250 (EPR3555, Abcam) using an automated immunostainer (Benchmark Ultra, Ventana Medical Systems Inc., Tucson, AZ, USA). Lymphoid cells in tonsil served as positive control for S100A8 and S100A9. The primary antibody was omitted for negative control.
S100A8 and S100A9 expressions
Immunohistochemical staining for S100A8 and S100A9 were evaluated in each TMA sample by visual counting of the tumor cells and peritumoral inflammatory cells that were defined as tumor infiltrating immune cells (Fig. 1). The staining result of tumor cells for S100A8 and S100A9 was determined as negative (not stained) or positive (stained). The proportion of tumor cells stained for S100A8 and S100A9 was categorized as less than 50% or more than 50% [16,17]. We also assessed the proportion of inflammatory cells stained for S100A8 and S100A9 classified as following: less than 30% or more than 30%. To confirm reproducibility, all samples were scored by two independent pathologists in a blind manner. If discrepancies occurred, a consensus score was reached.
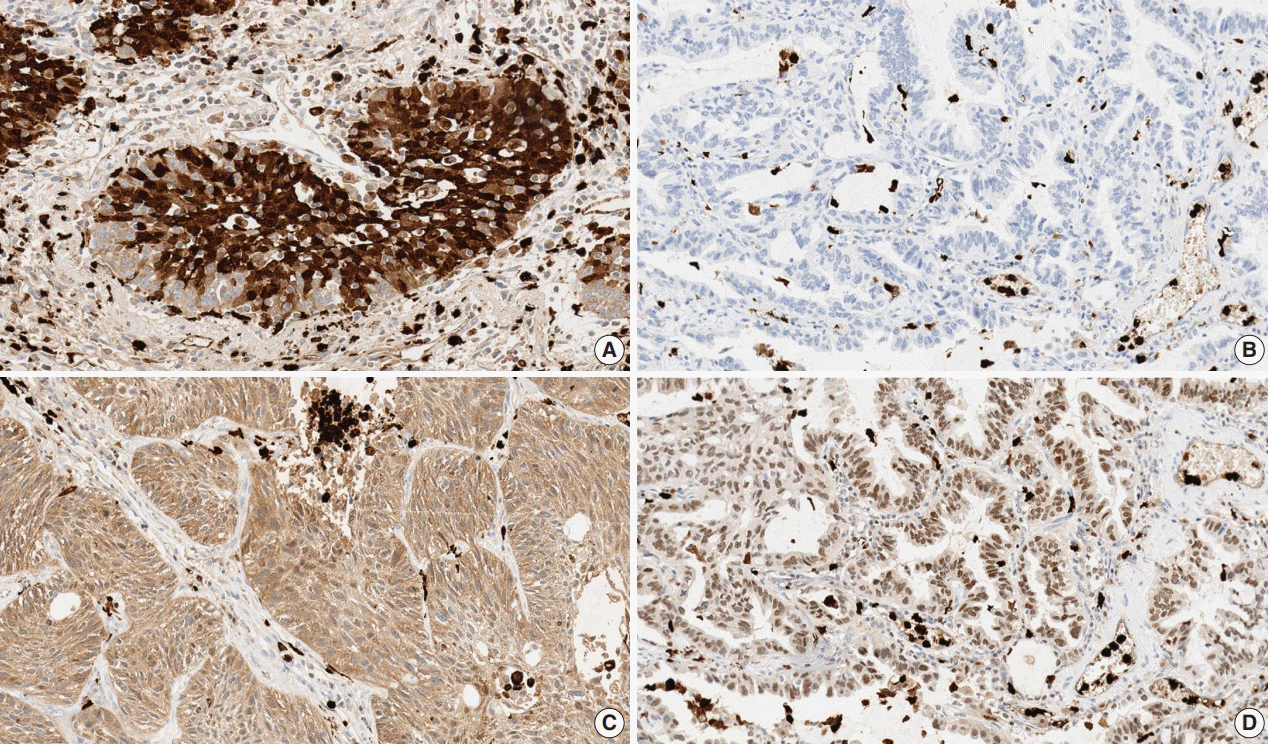 | Fig. 1.S100A8 and S100A9 expressions in non-small cell lung cancer. Tumor cells and inflammatory cells stained for S100A8 in squamous cell carcinoma (A), inflammatory cells stained for S100A8 in adenocarcinoma (B), tumor cells and inflammatory cells stained for S100A9 in squamous cell carcinoma (C), tumor cells and inflammatory cells stained for S100A9 in adenocarcinoma (D).
|
Statistical analysis
The relationship between categorical variables was determined using chi-square test. The prognostic significance of various clinicopathological characteristics for DFS and DSS was assessed by the Cox proportional hazard regression method. DFS and DSS were analyzed using the Kaplan-Meier method with log-rank test between the groups. p < .05 was considered as statistically significant. The analysis was performed using IBM SPSS ver. 25.0 (IBM Corp., Armonk, NY, USA).
Go to : 
RESULTS
Patient characteristics
Clinicopathological information of the patients is shown in Table 1. The mean age of the patients was 64.85 years (range, 31 to 77 years). Histologic types of the tumor were as follows: squamous cell carcinoma (SQCC) in 96 (64.9%), adenocarcinoma (ADC) in 37 (25%), large cell neuroendocrine carcinoma in eight (5.4%), and others including pleomorphic and mucoepidermoid carcinoma in seven (4.7%). The most prevalent histologic feature of SQCC was moderately differentiated in 59 (61.4%) and ADC was acinar type in 15 (40.5%). As for the TNM stage, 83 (56.1%) were stage I, 51 (34.5%) were stage II, 12 (8.1%) were stage III, and two (1.3%) were stage IV. Of all the recruited patients, 130 patients (87.9%) underwent lobectomy including all ADC cases, while the remaining 18 patients (12.1%) underwent pneumonectomy, bilobectomy, or sleeve lobectomy.
Table 1.
Clinicopathological characteristics of the patients
![]()
Relationship between S100A8 and S100A9 expressions and clinicopathological characteristics in tumor cells
The relationship between S100A8 and S100A9 expression and clinicopathological characteristics in tumor cells is shown in Table 2. Positive staining for S100A8 was significantly increased in male (p < .001), smoker (p = .034), surgical methods other than lobectomy such as bilobectomy or sleeve lobectomy and pneumonectomy (p = .024), SQCC (p < .001) and higher TNM stage (p = .022) compared with female, non-smoker, lobectomy, ADC and lower stage. The association between positive staining for S100A8 and surgical method was derived from SQCC cases because lobectomy was done for all ADC cases. The proportion of tumor cells stained for S100A8 showed significant association with histologic type (p < .001) and patient sex (p = .027). However, positive staining for S100A9 and proportion of tumor cells stained for S100A9 did not show any significant correlation with clinicopathological characteristics.
Table 2.
Relationship between S100A8 and S100A9 expressions and clinicopathological characteristics in tumor cells
|
S100A8 expression |
S100A9 expression |
|||||||||||
|---|---|---|---|---|---|---|---|---|---|---|---|---|
|
Staining result of tumor cells |
Proportion of tumor cells stained |
Staining result of tumor cells |
Proportion of tumor cells stained |
|||||||||
| Negative | Positive | p-value | ≤ 50% | > 50% | p-value | Negative | Positive | p-value | ≤ 50% | > 50% | p-value | |
| Age (yr) | .645 | .237 | .334 | .090 | ||||||||
| < 65 | 20 (32.8) | 41 (67.2) | 48 (77.4) | 14 (22.6) | 6 (9.8) | 55 (90.2) | 31 (50.0) | 31 (50.0) | ||||
| ≥ 65 | 31 (36.5) | 54 (63.5) | 59 (68.6) | 27 (31.4) | 13 (15.3) | 72 (84.7) | 31 (36) | 55 (64) | ||||
| Sex | < .001 | .027 | .434 | .867 | ||||||||
| Male | 35 (28.2) | 89 (71.8) | 86 (68.8) | 39 (31.2) | 15 (12.1) | 109 (87.9) | 52 (41.6) | 73 (58.4) | ||||
| Female | 16 (72.7) | 6 (27.3) | 21 (91.3) | 2 (8.7) | 4 (18.2) | 18 (81.8) | 10 (43.5) | 13 (56.5) | ||||
| Smoking | .034 | .450 | .816 | .500 | ||||||||
| Non-smoker | 23 (46) | 27 (54) | 38 (76) | 12 (24) | 7 (14) | 43 (86) | 23 (46) | 27 (54) | ||||
| Smoker | 27 (28.4) | 68 (71.6) | 68 (70.1) | 29 (29.9) | 12 (12.6) | 83 (87.4) | 39 (40.2) | 58 (59.8) | ||||
| Surgery | .024 | .090 | .315 | .783 | ||||||||
| Lobectomy | 49 (38.3) | 79 (61.7) | 97 (74.6) | 33 (25.4) | 18 (14.1) | 110 (85.9) | 55 (42.3) | 75 (57.7) | ||||
| Othersa | 2 (11.1) | 16 (88.9) | 10 (55.6) | 8 (44.4) | 1 (5.6) | 17 (94.4) | 7 (38.9) | 11 (61.1) | ||||
| Histologic type | < .001 | < .001 | .060 | .100 | ||||||||
| SQCC | 22 (23.4) | 72 (76.6) | 62 (64.6) | 34 (35.4) | 9 (9.6) | 85 (90.4) | 38 (39.6) | 58 (60.4) | ||||
| ADC | 26 (70.3) | 11 (29.7) | 36 (97.3) | 1 (12.5) | 7 (18.9) | 30 (81.1) | 17 (45.9) | 20 (54.1) | ||||
| LCN | 3 (37.5) | 5 (62.5) | 7 (87.5) | 1 (12.5) | 3 (37.5) | 5 (62.5) | 6 (75) | 2 (25) | ||||
| Others | 0 | 7 (100) | 2 (28.6) | 5 (71.4) | 0 | 7 (100) | 1 (14.3) | 6 (85.7) | ||||
| TNM stage | .022 | .356 | .503 | .977 | ||||||||
| Ia | 19 (57.6) | 14 (42.4) | 30 (85.7) | 5 (14.3) | 6 (18.2) | 27 (81.8) | 14 (40.0) | 21 (60.0) | ||||
| Ib | 13 (27.1) | 35 (72.9) | 32 (66.7) | 16 (33.3) | 7 (14.6) | 41 (85.4) | 22 (45.8) | 26 (54.2) | ||||
| IIa | 4 (36.4) | 7 (63.6) | 9 (81.8) | 2 (18.2) | 2 (18.2) | 9 (81.8) | 4 (36.4) | 7 (63.6) | ||||
| IIb | 10 (25.0) | 30 (75.0) | 26 (65.0) | 14 (35.0) | 2 (5.0) | 38 (95.0) | 15 (37.5) | 25 (62.5) | ||||
| IIIa | 1 (25.0) | 3 (75.0) | 3 (75.0) | 1 (25.0) | 0 | 4 (100) | 2 (50.0) | 2 (50.0) | ||||
| IIIb | 2 (25.0) | 6 (75.0) | 5 (62.5) | 3 (37.5) | 2 (25.0) | 6 (75.0) | 4 (50.0) | 4 (50.0) | ||||
| IV | 2 (100) | 0 | 2 (100) | 0 | 0 | 2 (100) | 1 (50.0) | 1 (50.0) | ||||
Values are presented as number (%).
Specimens of two patients were not informative for staining result of tumor cells in S100A8 and S100A9 expressions, due to loss of the specimen.
SQCC, squamous cell carcinoma; ADC, adenocarcinoma; LCN, large cell neuroendocrine carcinoma; TNM, tumor-node-metastasis.
![]()
Relationship between proportion of inflammatory cells stained for S100A8 and S100A9 and clinicopathological characteristics
The relationship between proportion of inflammatory cells stained for S100A8 and S100A9 and clinicopathological characteristics is shown in Table 3. The proportion of inflammatory cells stained for S100A8 was significantly correlated with patient age (p = .022) but not with other factors, and the proportion of inflammatory cells stained for S100A9 showed significant correlation with patient sex (p < .001) and smoking history (p = .031).
Table 3.
Relationship between proportion of inflammatory cells stained for S100A8 and S100A9 and clinicopathological characteristics
|
Proportion of inflammatory cells stained for S100A8 |
Proportion of inflammatory cells stained for S100A9 |
|||||
|---|---|---|---|---|---|---|
| ≤ 30% | > 30% | p-value | ≤ 30% | > 30% | p-value | |
| Age (yr) | .022 | .803 | ||||
| < 65 | 4 (6.5) | 58 (93.5) | 5 (8.1) | 57 (91.9) | ||
| ≥ 65 | 17 (19.8) | 69 (80.2) | 6 (7) | 80 (93) | ||
| Sex | .075 | < .001 | ||||
| Male | 15 (12) | 110 (88) | 5 (4) | 120 (96) | ||
| Female | 6 (26.1) | 17 (73.9) | 6 (26.1) | 17 (73.9) | ||
| Smoking | .356 | .031 | ||||
| Non-smoker | 9 (18) | 41 (82) | 7 (14) | 43 (86) | ||
| Smoker | 12 (12.4) | 85 (87.6) | 4 (4.1) | 93 (95.9) | ||
| Surgery | .748 | .526 | ||||
| Lobectomy | 18 (13.8) | 112 (86.2) | 9 (6.9) | 121 (93.1) | ||
| Othersa | 3 (16.7) | 15 (83.3) | 2 (11.1) | 16 (88.9) | ||
| Histologic type | .283 | .109 | ||||
| SQCC | 17 (17.7) | 79 (82.3) | 5 (5.2) | 91 (94.8) | ||
| ADC | 4 (10.8) | 33 (89.2) | 6 (16.2) | 31 (83.8) | ||
| LCN | 0 | 8 (100) | 0 | 8 (100) | ||
| Others | 0 | 7 (100) | 0 | 7 (100) | ||
| TNM stage | .411 | .163 | ||||
| Ia | 2 (5.7) | 33 (94.3) | 1 (2.9) | 34 (97.1) | ||
| Ib | 7 (14.6) | 41 (85.4) | 4 (8.3) | 44 (91.7) | ||
| IIa | 2 (18.2) | 9 (81.8) | 2 (18.2) | 9 (81.8) | ||
| IIb | 8 (20.0) | 32 (80.0) | 3 (7.5) | 37 (92.5) | ||
| IIIa | 0 | 4 (100) | 0 | 4 (100) | ||
| IIIb | 1 (12.5) | 7 (87.5) | 0 | 8 (100) | ||
| IV | 1 (50.0) | 1 (50.0) | 1 (50.0) | 1 (50.0) | ||
![]()
Relationship between S100A8 and S100A9 expressions in tumor cells and inflammatory cells
The relationship between S100A8 and S100A9 expressions in tumor cells and inflammatory cells is shown in Table 4. In tumor cells, the positivity of S100A8 and S100A9 significantly correlated with the proportion of tumor cells stained for each protein (p < .001). The positivity and proportion of tumor cells stained for S100A8 showed significant association with positivity of S100A9 (p < .001), and the proportion of tumor cells stained for S100A8 showed significant correlation with the proportion of tumor cells stained for S100A9 (p < .001). In inflammatory cells, the proportion of inflammatory cells stained for S100A8 showed significant correlation with that of inflammatory cells stained for S100A9 (p < .001). In addition, the positivity of S100A8 and S100A9 in tumor cells was significantly correlated with the proportion of inflammatory cells stained for S100A9 (p = .031 and p = .010, respectively).
Table 4.
The p-values of chi-square tests between S100A8 and S100A9 expressions in tumor cells and inflammatory cells
![]()
S100A8 andS100A9 expressions and survival analysis
The mean follow-up time of the patients in this study was 113 months. In total, 48.6% of the patients (n=72) had recurrence and 41.9% (n=62) died. The median DSS time was 37 months. The recurrence rate and survival rate had no significant differences between any groups, such as the staining result of tumor cells, proportion of tumor cells and inflammatory cells stained for S100A8 and S100A9 in NSCLC.
In SQCC, 54.2% of the patients (n = 52) had recurred and 46.9% (n = 45) died. DSS rate was significantly higher in the group in which more than 50% of the tumor cells were stained for S100A9 (n = 36, 62.1%) compared with the group in which less than 50% of the tumor cells were stained (n = 15, 39.5%) (p = .030). Indeed, Kaplan Meier analysis confirmed that more than 50% of the tumor cells stained for S100A9 were significantly associated with a favorable DSS (p = .016). Moreover, a multivariate Cox proportional hazards regression model demonstrated that more than 50% of the tumor cells stained for S100A9 represent an independent factor for good DSS (hazard ratio, 0.483; 95% confidence interval, 0.265 to 0.880; p = .017) (Table 5). But DFS and DSS rates did not show statistical differences between the groups with staining results of the tumor cells and the proportion of inflammatory cells stained for S100A8 and S100A9. However, the groups with positive staining in tumor cells for S100A8 and S100A9 and the group with more than 50% of the tumor cells stained for S100A8 did show a tendency towards increased DFS and DSS rates compared with the groups showing negative staining or less than 50% of the tumor cells stained. Also, groups showing less than 30% of the inflammatory cells stained for S100A8 and S100A9 revealed an increasing trend of better prognosis compared with groups showing more than 30% stained (Fig. 2A–F).
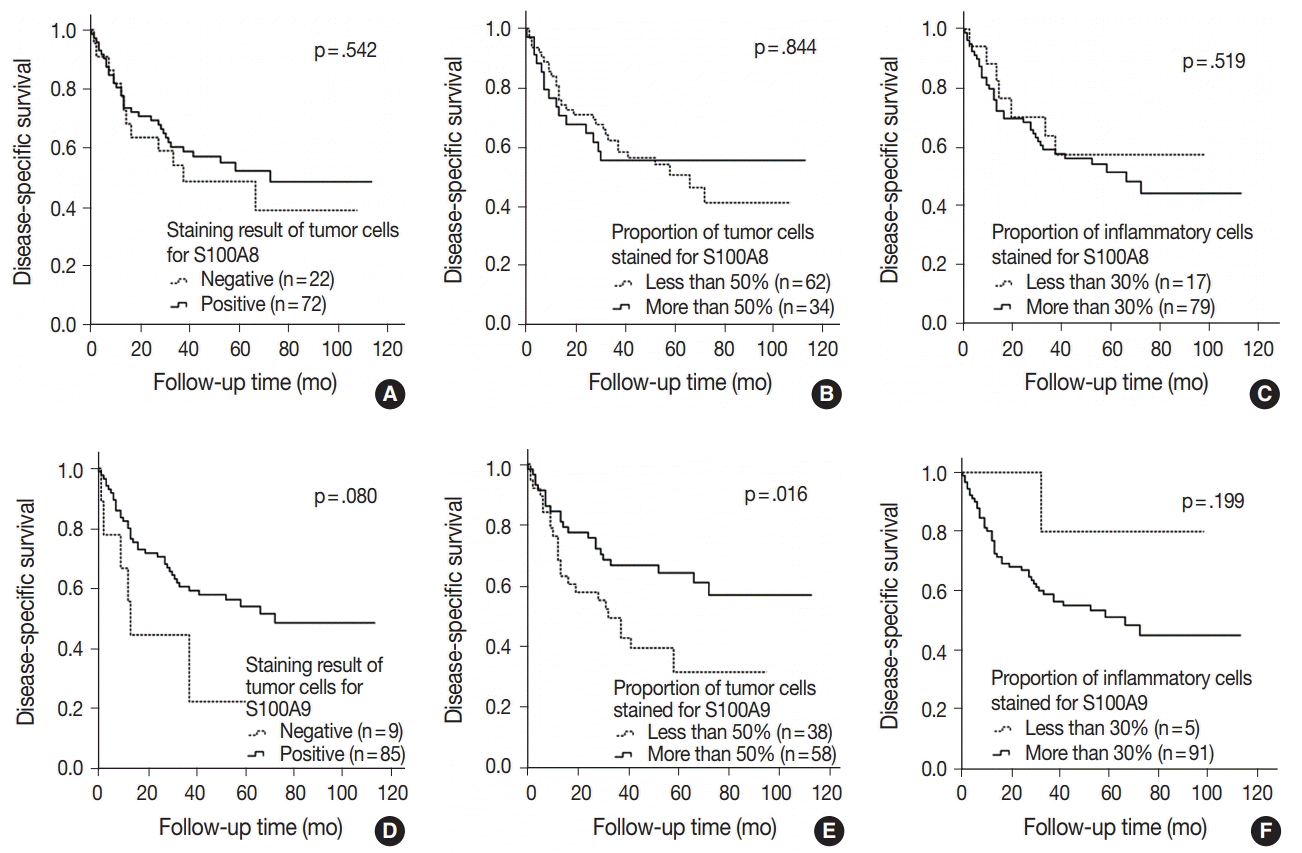 | Fig. 2.Kaplan-Meier survival analysis of survival curves based on S100A8 and S100A9 expressions in patients with squamous cell carcinoma. The groups with positive staining in tumor cells (A, D), the groups with more than 50% of the tumor cells (B, E) stained and the groups with less than 30% of the inflammatory cells (C, F) stained for S100A8 and S100A9 reveal a tendency towards increased survivability compared with the groups showing negative staining, less than 50% of the tumor cells stained and more than 30% of the inflammatory cells stained.
|
Table 5.
Cox proportional hazards regression model of disease-free and disease-specific survival for NSCLC patients (n = 133)
| Variable |
Squamous cell carcinoma |
Adenocarcinoma |
||||||
|---|---|---|---|---|---|---|---|---|
|
DFS |
DSS |
DFS |
DSS |
|||||
| HR (95% CI) | p-value | HR (95% CI) | p-value | HR (95% CI) | p-value | HR (95% CI) | p-value | |
| Univariate analysis | ||||||||
| Age (< 65 yr vs ≥ 65 yr) | 1.402 (0.784–2.506) | .247 | 1.170 (0.635–2.157) | .614 | 0.934 (0.296–2.945) | .934 | 0.818 (0.195–3.428) | .784 |
| Sex (male vs female) | 0.824 (0.200–3.391) | .789 | 0.398 (0.055–2.895) | .363 | 0.736 (0.234–2.320) | .601 | 0.592 (0.141–2.484) | .474 |
| Smoking history (nonsmoker vs smoker) | 0.644 (0.356–1.164) | .145 | 0.671 (0.355–1.266) | .218 | 0.918 (0.269–3.139) | .892 | 1.690 (0.422–6.764) | .459 |
| Surgical method (lobectomy vs othersa) | 1.562 (0.814–2.998) | .180 | 1.479 (0.730–2.996) | .278 | NAb | NAb | ||
| TNM stage (< IIb vs ≥ IIb) | 1.711 (0.984–2.975) | .057 | 1.966 (1.087–3.558) | .025 | 2.727 (0.867–8.571) | .086 | 2.961 (0.738–11.871) | .126 |
| Proportion of tumor cells stained for S100A9 (≤ 50% vs > 50%) | 0.709 (0.408–1.231) | .222 | 0.491 (0.272–0.889) | .019 | 1.625 (0.475–5.557) | .439 | 2.891 (0.583–14.337) | .194 |
| Multivariate analysis | ||||||||
| Age (< 65 yr vs ≥ 65 yr) | - | - | - | - | - | - | - | - |
| Sex (male vs female) | - | - | - | - | - | - | - | - |
| Smoking history (nonsmoker vs smoker) | - | - | - | - | - | - | - | - |
| Surgical method (lobectomy vs othersa) | - | - | - | - | - | - | - | - |
| TNM stage (< IIb vs ≥ IIb) | 1.736 (0.998–3.022) | .051 | 2.012 (1.110–3.644) | .021 | 2.577 (0.805–8.253) | .111 | 2.528 (0.618–10.336) | .197 |
| Proportion of tumor cells stained for S100A9 (≤ 50% vs > 50%) | 0.702 (0.402–1.224) | .212 | 0.483 (0.265–0.880) | .017 | 1.374 (0.393–4.807) | .619 | 2.457 (0.484–12.484) | .278 |
![]()
In ADC, 32.4% of the patients (n = 12) had recurrence and 21.6% (n = 8) died. The DFS and DSS rates had no significant differences between any groups, such as staining result of the tumor cells, the proportion of tumor cells and inflammatory cells stained for S100A8 and S100A9. However, the groups with positive staining in tumor cells and groups with more than 50% of the tumor cells stained for S100A8 and S100A9 did show a tendency towards decreased DFS and DSS rates compared with groups with negative staining and less than 50% of the tumor cells stained. Also, groups with less than 30% of the inflammatory cells stained for S100A8 and S100A9 revealed a trend towards worse prognosis compared with groups with more than 30% stained (Fig. 3A–F).
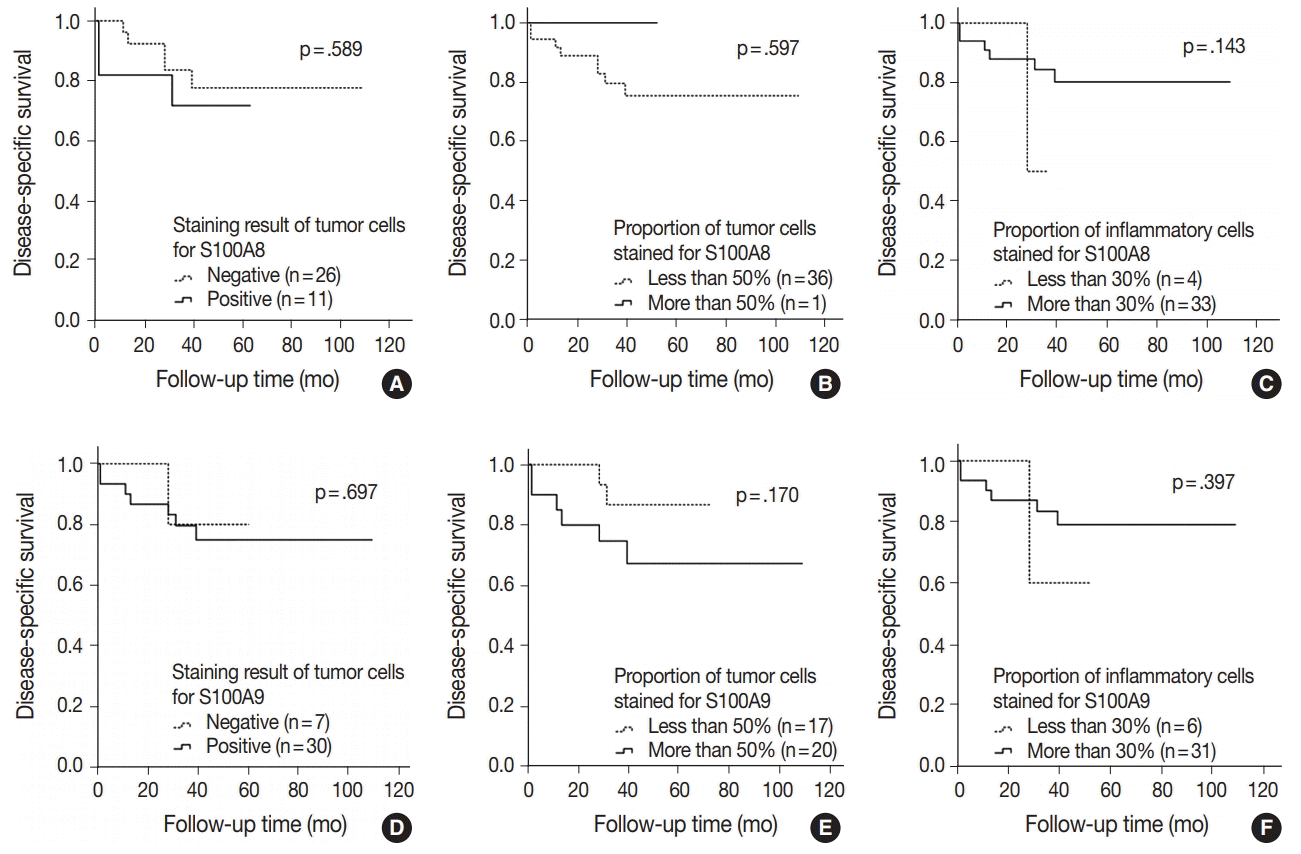 | Fig. 3.Kaplan-Meier survival analysis of survival curves based on S100A8 and S100A9 expressions in patients with adenocarcinoma. The groups with positive staining in tumor cells (A, D), the groups with more than 50% of the tumor cells (B, E) stained and the groups with less than 30% of the inflammatory cells (C, F) stained for S100A8 and S100A9 reveal a trend towards decreased survivability compared with the groups showing negative staining, less than 50% of the tumor cells stained and more than 30% of the inflammatory cells stained.
|
Go to :
DISCUSSION
S100A8 (MRP8, myeloid-related proteins 8) and S100A9 (MRP9) were originally discovered in myeloid cells [8]. High levels of S100A8 and S100A9 expressions are characteristic of inflammatory conditions, acting as chemotactic molecules that are constitutively expressed by neutrophils, activated monocytes, macrophages, and myeloid-derived suppressor cells-derived exosomes [9]. S100A8 and S100A9 are often co-expressed and typically function as a S100A8/A9 heterodimer (calprotectin) [9]. Due to their abundance in inflammatory cells, the main functions of S100A8 or S100A9 have been attributed to their roles in inflammatory diseases [9].
However, the important roles of S100A8 and S100A9 have been increasingly recognized in modulation of tumor growth and metastasis [10]. Several studies have indicated that S100A8 and S100A9 promote tumor cell proliferation and invasion via activation of various intracellular signaling pathways, including phosphorylation of mitogen-activated protein kinase in tumor cells and promoting activation of nuclear factor κb; they also enhance metastatic process by mediating pre-metastatic niches as chemo-attractants and decreasing matrix metalloproteinases [5,10-12]. Moreover, S100A8 and S100A9 are upregulated in various human cancers such as lung, prostate, colon, gastric, breast, and skin cancer, with abundant expression in neoplastic tumor cells as well as infiltrating immune cells surrounding the tumor [5,13].
There are only a limited number of studies investigating expressions of S100A8 and S100A9 in lung cancer. In the study by Su et al. [18], up-regulation of these proteins was found in ADC that correlated with the clinical characteristics of ADC, inflammation, and stage IV lesions. Arai et al. [19] reported that the expression level of S100A9 in pulmonary ADC showed a high correlation with poorly differentiated carcinomas, and Huang et al. [20] exhibited that positive expressions of S100A8 and S100A9 in NSCLC were significantly higher in poorly differentiated tumors compared with moderately- and well-differentiated tumors.
In this study, we found that positive staining of tumor cells for S100A8 correlated significantly with patient sex, smoking history, surgical method, histologic type and TNM stage and the proportion of tumor cells stained for S100A8 was significantly related to the histologic type and patient sex in NSCLC. We also observed that the proportion of inflammatory cells stained for S100A8 was significantly related to the patient age, and that of S100A9 showed significant correlation with patient sex and smoking history in NSCLC. In addition, positivity of tumor cells and/or proportion of tumor cells stained for S100A8 and S100A9 significantly correlated with positivity of tumor cells and/or proportion of inflammatory cells stained for S100A8 and/or S100A9 in NSCLC, indicating that inflammation is closely associated with cancer [21]. Moreover, we analyzed that DSS rate was significantly higher in the group with more than 50% of the tumor cells stained for S100A9 compared with the group with less than 50% stained in SQCC, confirmed by Kaplan–Meier analysis and the multivariate Cox proportional hazards regression model.
Another interesting finding of this study is that the groups with positive staining in tumor cells, the groups with more than 50% of the tumor cells stained and the groups with less than 30% of the inflammatory cells stained for S100A8 and S100A9 showed a tendency towards increased DFS and DSS rates in SQCC but towards decreased rates in ADC.
The present study is the first evaluate the expressions of S100A8 and S100A9 in NSCLC and their prognostic significance.
In SQCC, several studies have demonstrated that high expression of S100A8 and/or S100A9 could be a favorable factor while showing frequent loss or reduction of the protein expressions in the head and neck, esophagus and cervix [22-25]. There are a few studies reporting that S100A8 and S100A9 are related to the regulation of keratinocyte proliferation and differentiation [25,26]. Our results also reveal that positive staining for S100A8 and S100A9 may have a favorable effect on the prognosis in pulmonary SQCC.
In previous studies, strong S100A8 and S100A9 up-regulation was found in breast, gastric, colorectal, pancreatic, and prostate cancer. The altered S100A8 and/or S100A9 expressions in carcinomas of glandular cell origin, such as breast, lung, and thyroid gland, were related to poor tumor differentiation and more aggressive behavior, which is consistent with our results in ADC [6,17,19,27-33].
Some studies have shown that cancer-related inflammation is often considered to support malignant progression and metastasis, showing up-regulation of S100A8 and S100A9 by inflammatorycells [9,10,21,25]. However, the same inflammatory cells also participate in anti-tumor immunity and restraint of malignant disease [34]. The balance between anti-tumor and pro-tumor functions can be dependent on polarization state, interaction with tumor microenvironment, and/or the tumor type [10,35]. In the same context, our studies reveal that the proportion of inflammatory cells stained for S100A8 and S100A9 may have an influence that is quite opposite in SQCC and ADC.
There are some limitations to this study. For example, we included a TMA core per case in analysis, which could induce a lack of representativeness. In addition, we did not use an adjustment method in scoring of inflammatory cells although tumor infiltrating immune cells consist of various cells. Moreover, the number of ADC cases were small, and they were all removed by lobectomy so we could not use the variable of surgical method in Cox proportional hazards regression model. A large-scale study with an organized study design including a sufficient number of cases and tissue samples is recommended in future studies.
In summary, we have found that positive staining in tumor cells, more than 50% of the tumor cells stained and less than 30% of the inflammatory cells stained for S100A8 and S100A9 suggest a tendency towards increased survivability in SQCC, whereas positive staining in tumor cells, more than 50% of the tumor cells stained and less than 30% of the inflammatory cells stained for S100A8 and S100A9 suggest a tendency towards decreased survivability in ADC. Consequently, S100A8 and S100A9 expressions could be potential prognostic factors in patients with NSCLC.
Many recent studies have provided evidence that implicates S100A8 and S100A9 to play important roles in cancer. However, the expressions and/or functions of S100A8 and S100A9 are much more complicated, supporting our data. Further studies are needed to fully comprehend their roles in cancer.
Go to :
 XML Download