

 PDF
PDF Citation
 Print
Print


MATERIALS AND METHODS
Study population
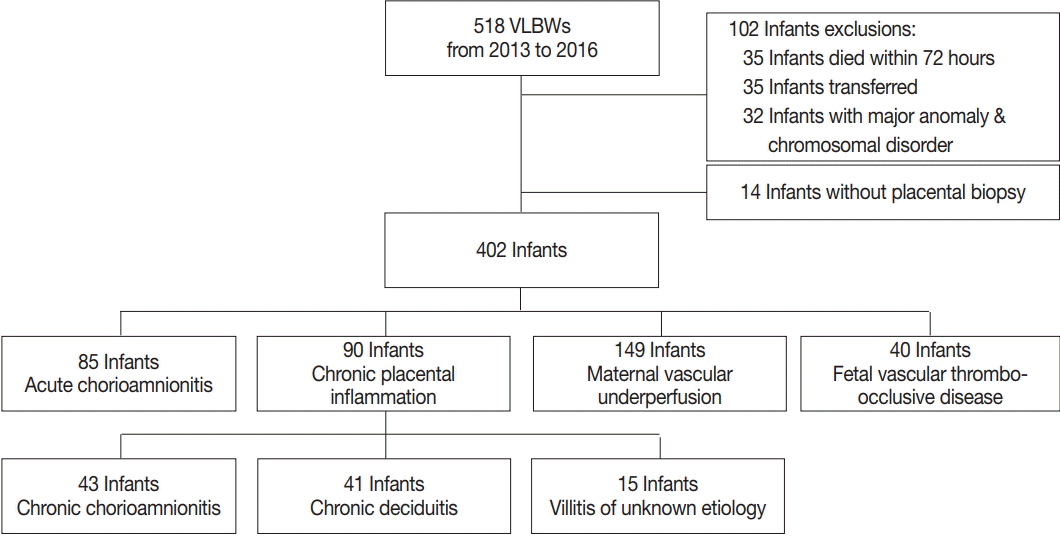
Study design
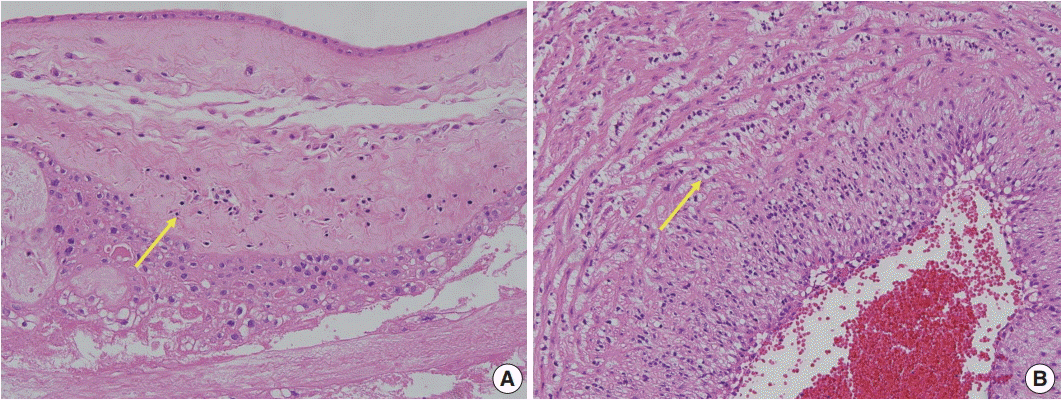
Placental pathology
Examination and treatment of retinopathy of prematurity
Clinical data on neonates
Statistical analysis
RESULTS
Clinical characteristics of the study population
Table 1.
Values are presented as mean ± SD, number (%), or mean (IQR).
IUGR, intrauterine growth retardation; RDS, respiratory distress syndrome; PDA, patent ductus arteriosus; BPD, bronchopulmonary dysplasia; IVH, intraventricular hemorrhage; PVL, periventricular leukomalacia; NEC, necrotizing enterocolitis; ROP, retinopathy of prematurity; VEGF, vascular endothelial growth factor; LOS, late-onset sepsis; SD, standard deviation; IQR, interquartile range.
![]()
Placental pathology
Association of CPI and retinopathy of prematurity
Table 2.
| Variable | Non-CPI (n = 312) | CPI (n = 90) | p-value |
|---|---|---|---|
| Gestational age (wk) | 29.1 ± 2.9 | 28.4 ± 3.2 | .007* |
| Birth weight (g) | 1,064.7 ± 286.9 | 1,012.5 ± 309.1 | .589 |
| Sex | .506 | ||
| Male | 154 (49.3) | 48 (53.3) | |
| Female | 158 (50.6) | 42 (46.7) | |
| Pre-eclampsia | 78 (25.0) | 9 (10.0) | .031* |
| Antenatal steroid use | 284 (91.0) | 79 (87.8) | .398 |
| IUGR | 107 (34.3) | 26 (28.9) | .338 |
| RDS | 177 (56.7) | 61 (67.8) | .068 |
| Significant PDA | 127 (40.7) | 40 (44.4) | .531 |
| Moderate to severe BPD | 79 (25.3) | 26 (28.9) | .497 |
| Postnatal steroid therapy | 72 (23.1) | 24 (26.7) | .496 |
| Duration of oxygen supply (day) | 41.4 ± 38.2 | 41.0 ± 38.1 | .163 |
| Severe neurologic injury (IVH ≥ grade 3 or PVL) | 34 (10.9) | 9 (10) | .051 |
| NEC (≥ stage 2) | 15 (4.8) | 4 (4.4) | .882 |
| LOS | 65 (20.8) | 23 (25.6) | .164 |
| ROP (any stage) | 71 (22.8) | 26 (28.9) | .021* |
| Type 1 ROP | 27 (8.6) | 19 (21.1) | .003* |
| Hospital days (day) | 66.5 ± 36.0 | 72.6 ± 36.1 | .154 |
Values are presented as mean ± SD or number (%).
CPI, chronic placental inflammation; IUGR, intrauterine growth retardation; RDS, respiratory distress syndrome; PDA, patent ductus arteriosus; BPD, bronchopulmonary dysplasia; IVH, intraventricular hemorrhage; PVL, periventricular leukomalacia; NEC, necrotizing enterocolitis; LOS, late-onset sepsis; ROP, retinopathy of prematurity; SD, standard deviation.
![]()
Table 3.
| Variable |
Any stage ROP |
Type 1 ROP |
||||||
|---|---|---|---|---|---|---|---|---|
| No ROP (n = 305) | ROP (n = 97) | OR (95% CI) | p-value | No type 1 ROP (n = 356) | Type 1 ROP (n = 46) | OR (95% CI) | p-value | |
| Gestational age (wk) | 30.0 ± 2.5 | 25.7 ± 1.7 | 0.872 (0.847–0.897) | < .001* | 30.4 ± 2.8 | 25.1 ± 1.5 | 0.882 (0.853–0.911) | < .001* |
| Birth weight (g) | 1,152.5 ± 239.5 | 740.6 ± 212.9 | 0.993 (0.992–0.995) | < .001* | 1100 ± 267.7 | 680.8 ± 198.7 | 0.993 (0.991–0.995) | < .001* |
| Male | 157 (51.5) | 49 (50.5) | 1.000 (0.329–1.126) | .339 | 179 (50.3) | 23 (50.0) | 1.000 (0.504–1.305) | .219 |
| Pre-eclampsia | 62 (20.3) | 7 (7.2) | 0.919 (0.383–2.205) | .851 | 66 (18.5) | 3 (6.5) | 0.295 (0.089–0.981) | .046* |
| Antenatal steroid | 271 (88.9) | 92 (94.8) | 1.547 (0.484–4.942) | .461 | 321 (90.2) | 42 (91.3) | 1.145 (0.388–3.382) | .807 |
| IUGR | 114 (37.3) | 19 (19.6) | 0.369 (0.323–1.265) | .199 | 125 (35.1) | 8 (17.4) | 0.389 (0.176–0.860) | .020* |
| Moderate to severe BPD | 40 (13.1) | 65 (67.0) | 0.503 (0.361–0.508) | < .001* | 67 (18.8) | 38 (82.6) | 0.467 (0.281–0.410) | < .001* |
| Postnatal steroid therapy | 34 (11.1) | 62 (63.9) | 0.512 (0.380–0.531) | < .001* | 60 (16.8) | 36 (78.3) | 0.399 (0.382–0.606) | < .001* |
| Duration of oxygen treatment (day) | 27.9 ± 26.1 | 81.2 ± 42.7 | 1.054 (1.042–1.066) | < .001* | 33.5 ± 31.3 | 98.6 ± 38.4 | 1.044 (1.031–1.057) | < .001* |
| Placental pathology | ||||||||
| CPI | 64 (21.0) | 26 (26.8) | 2.050 (1.170–3.592) | .038* | 71 (19.9) | 19 (46.3) | 2.825 (1.487–5.367) | .002* |
| CCA | 33 (10.8) | 10 (10.3) | 0.159 (0.691–3.152) | .159 | 36 (10.1) | 7 (15.2) | 1.590 (0.663–3.816) | .299 |
| Chronic deciduitis | 29 (9.5) | 12 (12.4) | 0.244 (0.874–3.872) | .244 | 33 (9.3) | 8 (17.4) | 2.061 (0.887–4.784) | .093 |
| VUE | 13 (4.3) | 2 (2.1) | 0.139 (0.042–2.501) | .139 | 15 (4.2) | 0 | 0.237 (0.013–4.413) | .335 |
| ACA | 53 (17.4) | 32 (33.0) | 2.079 (1.177–3.671) | .012* | 70 (19.7) | 15 (32.6) | 1.977 (1.012–3.862) | .046* |
| MVU | 118 (38.7) | 31 (32.0) | 0.744 (0.452–1.344) | .744 | 134 (37.6) | 15 (32.6) | 0.802 (0.417–1.540) | .507 |
| FVTOD | 29 (9.5) | 11 (11.3) | 0.806 (0.325–2.000) | .642 | 36 (10.1) | 4 (8.7) | 0.847 (0.287–2.498) | .763 |
Values are presented as mean ± SD or number (%).
ROP, retinopathy of prematurity; OR, odds ratio; CI, confidence interval; IUGR, intrauterine growth retardation; BPD, bronchopulmonary dysplasia; CPI, chronic placental inflammation; CCA, chronic chorioamnionitis; VUE, villitis of unknown etiology; ACA, amniotic fluid infection/inflammation; MVU, maternal vascular underperfusion; FVTOD, fetal vascular thrombo-occlusive disease; SD, standard deviation.
![]()
Table 4.
| Placental pathology |
No ROP |
Any stage ROP |
Type 1 ROP |
|||
|---|---|---|---|---|---|---|
| Adjusted OR (95% CI) | p-valuea | Adjusted OR (95% CI) | p-valuea | Adjusted OR (95% CI) | p-valuea | |
| CPI | 1.008 (0.492–2.068) | .982 | 1.647 (0.702–3.992) | .246 | 2.739 (1.112–6.749) | .029* |
| ACA | 0.811 (0.429–1.940) | .811 | 1.267 (0.531–3.023) | .594 | 0.833 (0.319–2.173) | .708 |
| MVU | 0.630 (0.315–1.261) | .630 | 2.036 (0.865–4.792) | .103 | 0.570 (0.211–1.539) | .267 |
| FVTOD | 0.815 (0.298–2.226) | .690 | 1.080 (0.360–3.240) | .126 | 0.424 (0.141–1.272) | .126 |
Chronic placental inflammation was statistically associated with type 1 ROP by multiple logistic regression analysis.
ROP, retinopathy of prematurity; OR, odds ratio; CI, confidence interval; CPI, chronic placental inflammation; ACA, amniotic fluid infection/inflammation; MVU, maternal vascular underperfusion; FVTOD, fetal vascular thrombo-occlusive disease.
![]()
 XML Download