Journal List > J Pathol Transl Med > v.51(3) > 1152274

Jeon, Yoon, Paik, Kim, Shin, Kim, Cha, Kim, Huh, Ko, The Hematopathology Study Group of the Korean Society of Pathologists, and The Molecular Pathology Study Group of Korean Society of Pathologists: Molecular Testing of Lymphoproliferative Disorders: Current Status and Perspectives

Abstract

Molecular pathologic testing plays an important role for the diagnosis, prognostication and decision of treatment strategy in lymphoproliferative disease. Here, we briefly review the molecular tests currently used for lymphoproliferative disease and those which will be implicated in clinical practice in the near future. Specifically, this guideline addresses the clonality test for B- and T-cell proliferative lesions, molecular cytogenetic tests for malignant lymphoma, determination of cell-of-origin in diffuse large B-cell lymphoma, and molecular genetic alterations incorporated in the 2016 revision of the World Health Organization classification of lymphoid neoplasms. Finally, a new perspective on the next-generation sequencing for diagnostic, prognostic, and therapeutic purpose in malignant lymphoma will be summarized.

Molecular pathologic testing plays an important role for the diagnosis, prognostication and decision of treatment in lymphoproliferative disease. Classification of malignant lymphomas has been evolved to define unique clinicopathological entities for optimizing management of patients and thereby improving the clinical outcome. Advances in radiological and diagnostic techniques in medicine have made it possible to detect diseases earlier and with smaller sized tissues. Thus, pathologists are facing challenges in the diagnosis of lymphoproliferative disease. In addition, gene expression profile has clinical implication for the prognosis and patient management as exampled by diffuse large B-cell lymphoma (DLBCL). Moreover, various molecular genetic alterations have been reported in lymphoma, which are likely candidates for target therapy in the era of precision medicine. Therefore, pathologic diagnosis of malignant lymphoma currently demands multimodal approach including morphology, immunophenotype, viral status, and genetic alterations. In addition, introduction of next-generation sequencing (NGS) techniques to the pathologic diagnosis of lymphoma is around the corner. This review is intended to give a brief overview and guideline for molecular tests for lymphoproliferative disease with a focus on malignant lymphoma, including the B- and T-cell clonality test, molecular cytogenetic test, determination of cell-of-origin (COO) in DLBCL, and molecular genetic tests incorporated in the 2016 revision of World Health Organization (WHO) classification of lymphoid neoplasm. A perspective on NGS tests in lymphoma will also be addressed.

B- AND T-CELL CLONALITY TEST

Background: Ig and T-cell receptor gene rearrangements

B and T cells are the only cells undergoing physiological gene rearrangement of their genomic DNA to produce unique Ig and T-cell receptor (TCR) molecules, respectively. The Ig and TCR genes contain many different variable (V), diversity (D), and joining (J) gene segments, which undergoes random gene rearrangement during early lymphoid development [1,2]. Ig heavy chain (IGH), TCR beta (TCRB), and TCR delta (TCRD) genes have V, D, and J gene segments, and Ig kappa (IGK), Ig lambda (IGL), TCR alpha (TCRA), and TCR gamma (TCRG) genes have V and J gene segments [3]. To further create diversity of Ig and TCR molecules, variable numbers of nucleotides are lost and inserted at the joining lesion (i.e., the V-D, V-J, or D-J junction) through the action of terminal deoxynucleotidyl transferase (TdT) [4]. Consequently, these processes produce an incredibly large repertoire of Ig and TCR molecules due to both the combinatorial diversity and the junctional diversity [5]. The normal blood B-cell receptor (BCR) and TCR repertoire is estimated to comprise more than 1012 distinct sequences, and many of these are present at low frequency under physiologic condition [5]. Thus, the detection of a single predominant BCR or TCR population indicates the presence of a clonally expanded B- or T-cell population, respectively.
Ig and TCR gene rearrangements occur in a hierarchical order. During B-cell development, the IGH genes are first rearranged, followed by rearrangement of IGK genes potentially resulting in IgH/κ expression. Alternatively, IGH gene rearrangement is followed by IGK deletion and IGL rearrangement, potentially resulting in IgH/κ expression [5]. Thus, IGH gene is most widely utilized in the clonality test for B-cell proliferative disease, followed by IGK and IGL [3,6]. During T-cell development, TCRD gene rearrangement occurs first in early thymocytes, followed by TCRG gene rearrangement, potentially resulting in TCRγδ expression in a small subset of thymocytes and differentiation to γδT cells. However, in most thymocytes, TCRG and TCRD rearrangements are followed by TCRB rearrangement and subsequent TCRA rearrangement (this rearrangement leads to the deletion of the TCRD locus because TCRD gene is located within the TCRA gene), potentially followed by TCRαβ expression and further differentiation into αβT cells. Consistent with this hierarchical gene rearrangement, virtually all αβT cells have rearranged TCRG as well as TCRB and TCRA genes; however, the γδT cells harbor rearranged TCRG and only rarely contain rearranged TCRB genes [3,7,8]. This has important implications for T-cell clonality testing, because virtually all the αβTCR expressing T-cell lymphomas as well as the γδT cell neoplasms will have a rearranged TCRG gene. Thus, TCRG gene is most widely utilized, followed by TCRB and then TCRA, for T-cell clonality test [3,6,8].

Indication

Molecular clonality test is required for making a final diagnosis of lymphoproliferative disorder when the diagnosis is inconclusive despite of extensive morphologic and immunophenotypic analysis. Common indications are as follows: (1) all suspected T-cell proliferations, (2) any suspected B-cell proliferation when morphology and immunophenotyping are not conclusive, (3) when limited tissues are available (such as skin biopsy and needle biopsy), (4) to determine involvement of lymphoma in cytology material, especially in limited specimen such as cerebrospinal fluid and vitreous fluid, (5) to detect minimal residual disease, (6) when lymphoproliferations are noted in immunodeficient patients, including post-transplant patients, (7) to evaluate the clonal relationship between two lymphoid malignancies in one patient or to differentiate a relapse from a second malignancy, (8) to further classify malignancy via Ig/TCR gene rearrangement patterns or particular chromosome aberrations, and (9) to stage lymphomas, occasionally [3].

Methodology

B- and T-cell clonality can be either indirectly determined by detection of monotypic Ig and TCR molecules or directly by genetic tests. Because reactive polyclonal B cells have Igκ/Igλ ratio ranging from 0.7 to 2.8, Ig light chain expression with Igκ/Igλ ratios of > 4.0 or < 0.5 has been considered as an evidence suggestive of clonal B-cell proliferation. Ig light chain restriction can be detected by flow cytometry, in situ hybridization or immunohistochemistry [9]. The detection of monotypic TCR expression can be done using flow cytometry for TCR molecules. However, these indirect methods have limitations because flow cytometry is difficult to perform using tissue samples, antibodies against specific TCR molecules are limited and usage of TCR repertoire is often restricted even under non-neoplastic condition. In contrast, molecular techniques, including southern blot and polymerase chain reaction (PCR) analyses, are broadly applicable to the detection of clonally rearranged Ig and TCR genes.
Southern blot analysis has long been considered as a gold standard for molecular clonality studies. It detects rearranged DNA fragments after digestion with restriction enzymes. Large amount (10–20 mg) of high quality DNA from fresh tissue, well-chosen restriction enzymes, well-designed DNA probes and technical excellence are required for Southern blot analysis. In addition, because Southern blot analysis basically focuses on the combinational diversity of Ig and TCR gene segments, it is useful for the assessment of IGH, IGK, and TCRB genes, but is of limited value for highly complex IGL and TCRA genes or relatively simple TCRG and TCRD genes [3,8]. Thus, despite the high reliability of Southern blot, it has been replaced by PCR techniques in clinical laboratories.
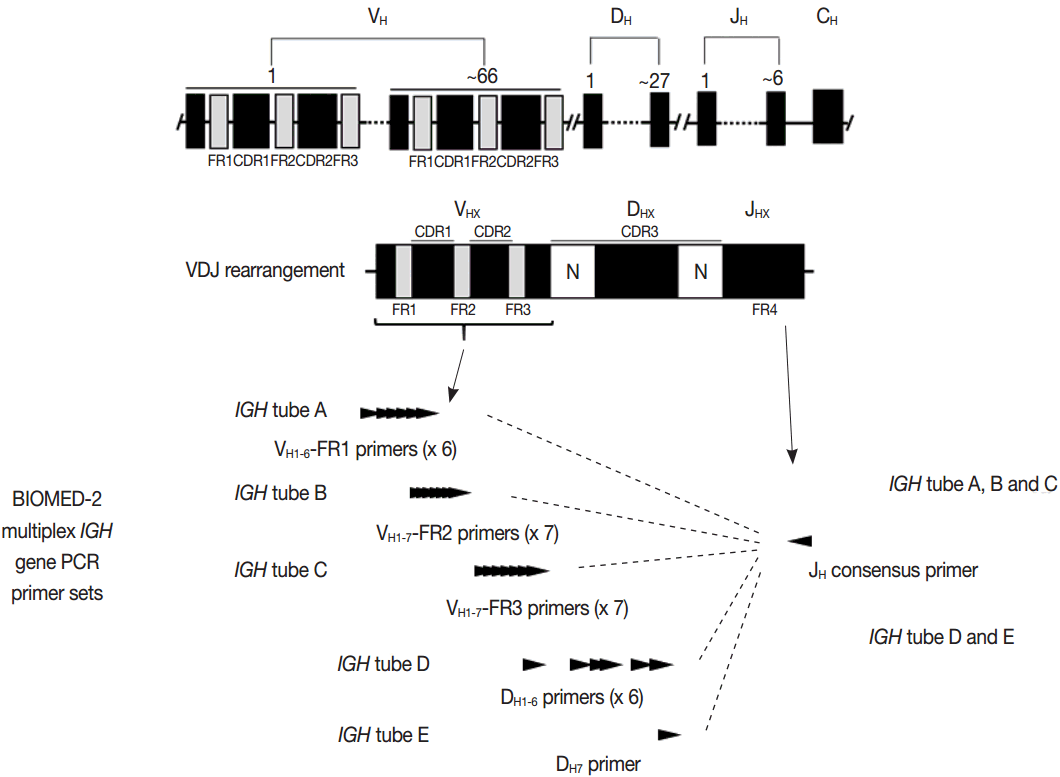
PCR techniques to detect rearranged Ig and TCR genes have considerable merits; it can be performed using a small amount of DNA and a variety of clinical samples including formalin fixed paraffin-embedded (FFPE) tissue, fresh tissue, and cytology samples, the turnaround time is short, and the PCR-based assay is relatively easy to perform and standardize. In PCR-based clonality test, as mentioned above, IGH genes are most widely used for B-cell clonality test followed by IGK, and TCRG genes are most widely utilized for T-cell clonality test followed by TCRB. PCR-based clonality test basically adopts multiplex-PCR techniques using multiple primers complementary to consensus or framework sequence of Ig and TCR gene families/segments. Due to the junctional diversity during gene rearrangement, polyclonal B and T cells produce PCR products having variable size and nucleotide composition. However, monoclonal B and T cells produce PCR products having identical size and nucleotide composition, which can be detected as an evidence of monoclonality [3,8]. Conventionally, a variety of primer sets have been developed and used among laboratories for PCR analysis of Ig and TCR gene rearrangement [10-13]. In recent years, laboratory-developed PCR tests to detect Ig and TCR gene rearrangement are being gradually replaced by BIOMED-2 (or EuroClonality) assay, which is now commercially available as IdentiClone clonality assay (Invivoscribe Technologies Inc., San Diego, CA, USA) [3,6,14-17]. In brief, BIOMED-2 assays utilize 14 multiplex PCR tubes altogether, including three VH-JH, two DH-JH, two IGK, one IGL, three TCRB, two TCRG, and one TCRD, to detect B- and T-cell clonality (Figs. 1, 2). The primer sets and design of multiplex PCR for each Ig and TCR gene rearrangement were previously described in detail [3]. A set of BIOMED-2 assays can be selected and implemented in individual laboratory for clinical practice [6].

Interpretation and reporting: PCR-based clonality assay

Evaluation of PCR product for clonality test can be performed using gel-based assay or capillary electrophoresis (CE) by gene scanner (Fig. 3). Gel-based assays are represented by denaturing gradient gel electrophoresis (EP) and heteroduplex analysis followed by non-denaturing polyacrylamide gel electrophoresis (PAGE). While denaturing gel EP and CE analysis can discriminate PCR products based on the size difference, heteroduplex analysis with non-denaturing PAGE has a merit to discriminate PCR products on the basis of sequence differences as well as size differences [3]. Thus, heteroduplex analysis can be considered to prevent false positive results.
In principal, monoclonal B- or T-cell population exhibits prominent unequivocal one or two clonal peak(s) and band(s) when analyzed by CE and gel-EP, respectively [3,6,15,17]. A common definition of a prominent peak in CE is one that is greater than twice the size of the background polyclonal population [8]. Meanwhile, commercial kits for BIOMED-2 assay defines a positive peak as one that is at least three times the amplitude of the third largest peak in the same polyclonal background distribution or the closest polyclonal background distribution to the product. Otherwise, commercial kit for BIOMED-2 assay of TCRG provides automated interpretation for the significance of a peak analyzed by CE through a mathematical algorithm. The presence of two predominant peaks rarely occurs, indicating biallelic rearrangements, usually at both TCR loci [17]. Polyclonal B- or T-cell populations typically exhibit a Gaussian distribution when analyzed by CE and a smear when analyzed by gel-EP. However, in many clinical samples, a polyclonal background may not exhibit an expected distribution due to fewer number of reactive B or T cells, PCR efficiencies, and other factors [6]. Moreover, it would be difficult to determine the presence of unequivocal clonality when weak peaks or bands are observed. Thus, interpretation of PCR-based clonality assay could be challenging.
Clonal peaks/bands observed in multiple multiplex-PCR reactions (i.e., tubes) and, moreover, reproducible in duplicate are highly convincing for the presence of monoclonal population. However, clear clonality would be detected in a single multiplex Ig/TCR PCR reaction (tube). The presence of an equivocal weak Ig/TCR band/peak within a polyclonal background can be regarded as low-level of clonality. Such equivocal products are often detected with either heteroduplex or Gene Scan. To avoid false-positivity of the clonality assay, duplicate test might be considered (see below), although not mandatory for the clonality test, particularly when using validated approved test [3,6]. General guidelines for interpretation and reporting of Ig/TCR clonality test are summarized in Table 1, on the condition that the test is appropriately validated.

Validation of test, quality assurance, and limitations and pitfalls

Utility and accuracy of molecular clonality test are affected by both biological and technical factors. For appropriate interpretation of results and quality assurance of clonality test, pathologists must be well-acquainted with the limitations and pitfalls [3]. Most importantly, pathologists and clinicians must understand that the results of clonality test should always be interpreted in the context of morphological, immunophenotypical, and clinical features of patients.

Validation of test and quality assurance

Each assay should be performed along with positive, negative, and no template controls. If the controls do not yield the expected results, the assay is not valid and the samples should not be interpreted. To ensure the quality and quantity of DNA and the absence of inhibitors of PCR reactions, specimen control size ladder, which amplifies multiple genes ranging the size of PCR product for Ig and TCR genes, is essential. If no bands are seen or smaller sized products are amplified only, the assay or sample should be re-evaluated unless the test result of specimen is positive.

Limited sensitivity and false-negative results

A sensitive PCR-based clonality test has detection limits of 1%–10%, depending on the applied techniques and the background of non-neoplastic B and T cells. In addition, false-negative results of PCR-based clonality test can be caused by improper primer annealing or difficulties in discrimination between monoclonal and polyclonal Ig/TCR gene rearrangements. Interpretation guideline of monoclonality and polyclonality is described above and in Table 1 and is also provided by manufacturer with commercial kit. However, this discrimination is occasionally not straightforward. In this case, analysis of multiple Ig and TCR genes and repeated examination might be helpful. Improper annealing of the PCR primers to the Ig and TCR genes can be mainly caused by two factors. First, family or consensus primers cannot precisely cover all different V, D, and J gene segments, particularly in Ig and TCR genes having many different gene segments. Second, mature B cells undergo somatic hypermutation in rearranged Ig genes and isotype class switching in germinal centers for affinity maturation of the Ig molecules. This physiologic phenomenon can hamper the proper annealing of PCR primers. Thus, mature B-cell lymphomas of germinal center or post-germinal center origin with somatically mutated Ig genes are more likely to show false-negative results [15,18].

Pseudoclonality and false-positive results

Pseudoclonality of a sensitive PCR assay refers to selective amplification of the Ig or TCR gene rearrangements from a few reactive B or T cells in the tissue samples, particularly in a small biopsy. Evaluating the reproducibility of clonal band/peak by performing duplicate or repeated PCR analyses will help to clarify whether the seemingly clonal PCR products are derived from different lymphocytes or not.6 On the other hand, PCR analyses can produce false-positive results, especially when discriminating the monoclonal, oligoclonal, or polyclonal populations solely based on the size of PCR products using techniques with low resolution. To avoid serious false-positive PCR results, discrimination of PCR products can be achieved via Gene Scanning, which has higher resolution than gel-based assay or via single-strand conformation polymorphism analysis, denaturing gradient gel EP and heteroduplex analysis [19,20]. These latter techniques discriminate PCR products in terms of composition of nucleotides, in addition to the length of nucleotides, derived from junctional diversity during Ig/TCR gene rearrangements.

Clonality is not equivalent to malignancy or lymphoma

Some clinically benign lymphoproliferative diseases (i.e., monoclonal gammopathy of unknown significance, lymphomatoid papulosis) can exhibit clonality. In addition, non-neoplastic lymphoproliferations including viral infection (i.e., Epstein-Barr virus, cytomegalovirus), bacterial infection (i.e., Helicobacter pylori gastritis), autoimmune diseases, and immunodeficiency status can harbor predominance of several antigen-specific subclones or reduced diversity of B- or T-cell repertoire, thus displaying oligoclonality or even monoclonality.

Ig and TCR gene rearrangements are not markers for lineage

Crosslineage Ig/TCR gene rearrangements occur relatively frequently in immature T- or B-cell malignancies (i.e., acute lymphoblastic lymphomas), and even in acute myeloid leukemias [21-24]. Virtually all αβT cell lymphomas have TCRG gene rearrangements and many αβT cell lymphomas have TCRB gene rearrangements, implying that the detection of TCRB or TCRG rearrangements is not indicative of T cells of the αβ or γδβ T-cell lineage, respectively, either [5,8,21,25,26]. Mature B- and T-cell lymphomas might rarely contain TCR and Ig gene rearrangements, respectively [21,24]. Particularly, angioimmunoblastic T-cell lymphomas (AITL) frequently exhibit Ig gene rearrangements up to 20%–30% of cases [17].

CHROMOSOME AND GENE TRANSLOCATIONS

Background and indications including changes in the 2016 revision of WHO classification

Structural alterations of chromosome and/or genes important for the diagnosis, prognostication and therapeutics in tumor include amplification, deletion and translocation (or rearrangement). B- and T-cell malignancies frequently undergo pathologic chromosome/gene rearrangement in addition to the physiologic rearrangement of Ig and TCR genes. Gene translocations in hematolymphoid malignancies result in the overexpression of oncogenes involving cell proliferation and apoptosis under the influence of Ig promoter or the production of fusion proteins having dysregulated expression or kinase activity. Gene translocations can be analyzed by multiple methods including conventional karyotyping, fluorescence in situ hybridization (FISH), Southern blotting, and reverse-transcription PCR. Otherwise, aberrant expression of proteins derived from gene translocation can be detected by immunohistochemistry [27]. Common chromosome/gene translocations with diagnostic and clinical implications in mature B and T-cell lymphomas and the detection method commonly used for clinical practice are summarized in Table 2.
Patients with DLBCL harboring MYC translocation (approximately in 5%–15% of DLBCL) or concurrent MYC and BCL2 translocations (approximately in 5%–6% of DLBCL) had very poor prognosis [28-31]. Of note, the 2016 revision of WHO classification has newly introduced high-grade B-cell lymphomas with MYC and BCL2 and/or BCL6 translocations (other than follicular lymphoma and lymphoblastic lymphoma) as a category of “double-/triple-hit” lymphomas [32]. These lymphomas morphologically resemble DLBCL or B-cell lymphoma, unclassifiable, with features intermediate between DLBCL and Burkitt lymphoma which had been recognized in 2008 WHO classification [33]. The patients with “double-/triple-hit” lymphomas show a very aggressive clinical course and poor prognosis despite high-intensity chemotherapy. However, a consensus has not yet been reached for the guidelines to test FISH for MYC, BCL2, and BCL6 rearrangements in high-grade B-cell lymphoma. In contrast, MYC protein expression is observed in 30%–50% of DLBCLs and concomitant expression of MYC and BCL2 in 20%–35% of the cases; these “double-expressor lymphoma” cases are four to five times higher in incidence than those with MYC and BCL2 double-hit (i.e., translocation) [29-31,34]. Although a cut-off for MYC and BCL2 expression for double-expressor has varied among studies, a cutoff of 30% or 40% for MYC and a cutoff of 50% or 70% for BCL2 are usually used to define these cases [34]. Several studies demonstrated that the double-expressor lymphomas have a worse outcome than other DLBCL, even irrespective of COO [31]. Thus, the 2016 revision of WHO classification suggests that coexpression of MYC and BCL2 should be considered new prognostic indicator in DLBCL, not otherwise specified (NOS) [32].

Method: FISH—procedures and probes

Interphase FISH is now widely used to detect chromosome/gene translocations using FFPE tissue, fresh tissue, and cytologic samples. FISH is a process by which fluorochrome-labeled specific DNA probe hybridizes to a complementary location on a chromosome. FISH test includes selection of appropriate probe, pretreatment, hybridization and interpretation [35,36]. When using validated probe, optimal pretreatment of tissue sections most affect the FISH test on FFPE tissue. Pretreatment refers to permeabilization of the cells to enable the probe to access the target DNA in the nucleus to hybridize. This procedure follows multiple steps including antigen retrieval procedure (i.e., citrate, EDTA), incubation with acid, detergent, and chaotropic agents (i.e., sodium thiocyanate [NaSCN]), and protease digestion, depending on the tissue condition. Hybridization procedures consist of co-denaturing target DNA and probe DNA at high temperature in the presence of formamide into single strands and incubating the slide to allow the probe DNA to attach to the target DNA [35].
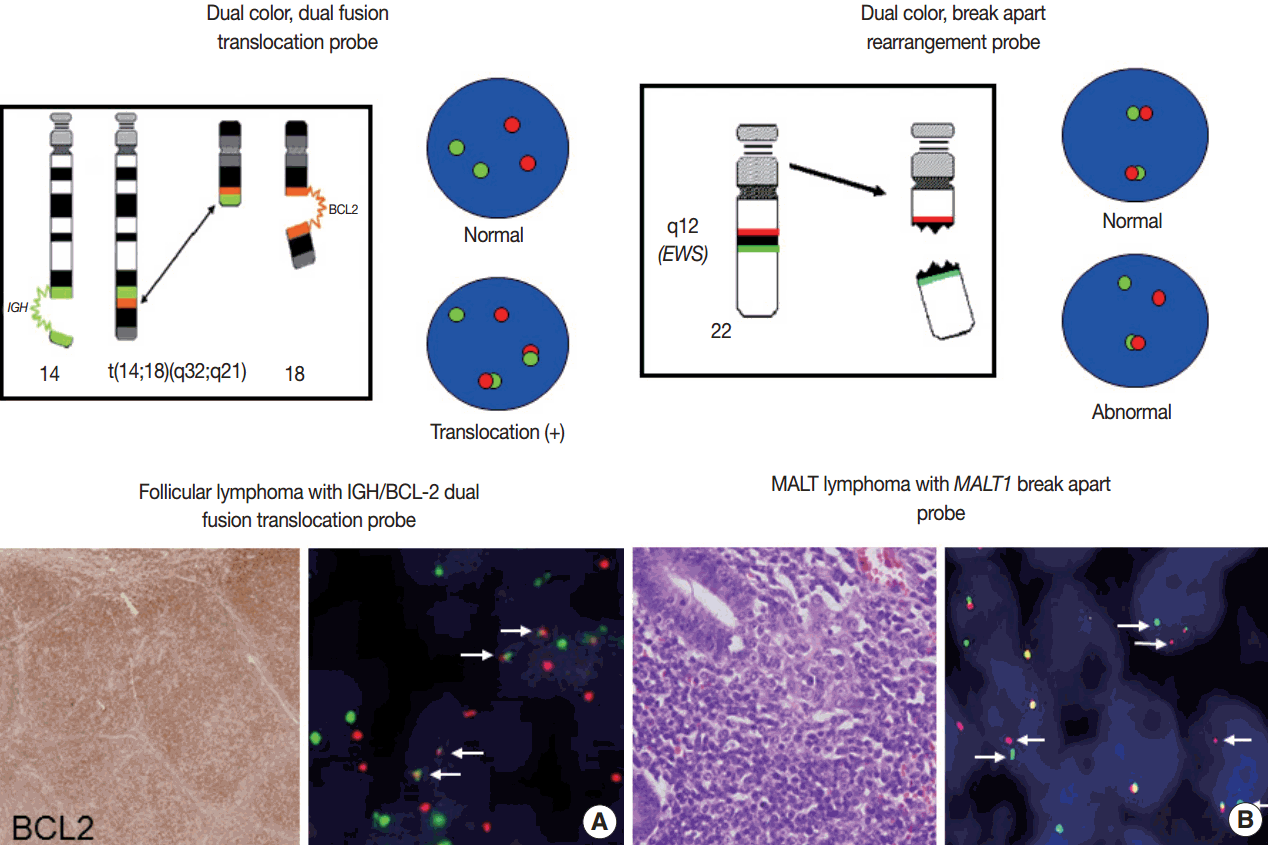
For detection of the common gene translocations in lymphoma, various probe sets and protocols for hybridization are now commercially available. FISH test for gene translocations are usually performed by two types of FISH probe [35,36]. One is the dual-color “dual-fusion” probe (or two break points spanning probe), in which each translocation partner is identified by a probe of different color, usually red and green. The normal configuration is therefore two red signals and two green signals in each nucleus. When a translocation occurs between two genes, one of each signal is split and the different halves join together; these result in signal pattern of one red, one green, and two fused signals (Fig. 4A). This probe has a merit to assure the fusion partners exactly and is useful for the diagnosis of gene translocations involving specific genes as in follicular lymphoma, which mostly harbors BCL2/IGH fusion. However, it has limitations in applying to the gene translocations having multiple fusion partners and can show false positive signals due to nuclear or chromosome overlapping in tissue FISH. To detect a gene translocation that can involve multiple partners, a dual-color “break-apart” probe (or breakpoint flanking probe) can be more useful. With this type of probe, the normal configuration is two paired signals. If there is any translocation present involving this gene, the two colors will be split apart, resulting in one paired (normal) signal, one red, and one green (Fig. 4B). There could be a small gap or space between the two colors in some probe when the DNA is unwound. However, when the translocation occurs inter-chromosomally, the signals are usually separated with ample space and the rate of false-positivity is very low. Thus, this type of probe is useful for detecting gene translocation to make a diagnosis by integrating other pathological features. Selection of FISH probe depends on the disease entity and the purpose of the test.

Reporting

In principle, FISH reporting follows a system for FISH nomenclature, the International System for Human Cytogenetic Nomenclature (ISCN) in both metaphase and interphase assay [27,35,37]. If a 14;18 translocation resulting in fusion of the IGH and BCL2 genes studied in interphase FISH using a dual-color, dualfusion probe set, the ISCN nomenclature would be written as follows: nuc ish (IGH × 3), (BCL2 × 3), (IGH con BCL2 × 2), indicating that each of the probes has been split apart and juxtaposed by the translocation. However, the system may seem confusing to pathologists not familiar with conventional cytogenetics, particularly those who are generally dealing with interphase FISH for solid tumors. FISH reporting may be modified according to the guideline provided by manufacturers of FISH probe and the purpose of the test in case of solid tumors. In principal, the report should also contain a statement as to the FISH results being normal or abnormal, and indicate the percentage of abnormal and normal cells. Specific names of the probes and the manufacturer and any specific limitations of the assay should be included in the report [36]. Interpretation of the report on the diagnostic and prognostic significance of the FISH findings, with the clinicopathological findings incorporated, and suggestion of any further tests could be recommended.

Validation of the test and quality assurance

When a new FISH test is implemented in the laboratory, extensive validation is required, including validation of the probe itself (probe validation) and validation of the procedures using the probe (analytical validation) (American College of Medical Genetics and Genomics, Standards and Guidelines for Clinical Genetic Laboratories, Section E: Clinical Cytogenetics, http://www.acmg.net) [36]. Commercial probes, which are supplied by various manufacturers including Abbott (Vysis), Cambio, Cytocell, Dako, Kreatech, and Poseidon (Stretton), are generally easy to use and validated. However, because they can vary in terms of application, size (50 kb–1 Mb) and covered chromosome loci, users must read the datasheet and probe map very carefully and become familiar with the FISH pattern using the probe. Regarding the analytical validation in interphase FISH using FFPE tissue, normal reference ranges can be calculated by evaluating available tissues without the rearrangement being validated. To validate a FISH test, known normal and abnormal cases should be assessed to establish clearly defined scoring criteria for determining whether the assay is acceptable or not. For this, inter-laboratory cross-validation and participation in a proficiency testing program are recommended [36].

CELL-OF-ORIGIN OF DIFFUSE LARGE B-CELL LYMPHOMA

Background and indications including changes in the 2016 revision of WHO classification

Gene expression profiling (GEP) studies classified DLBCL into clinically and biologically distinct subsets reflecting COO as follows: germinal center B-cell (GCB)-like DLBCL expresses genes related to normal GCBs, and activated B-cell (ABC)-like DLBCL lacks genes expressed in GCBs but expresses genes related to BCR activated B cells arrested during plasmacytic differentiation. Unclassifiable cases cannot be put into either category. Patients with ABC DLBCL have a worse clinical outcome than do patients with GCB DLBCL when treated with R-CHOP regimen [38-41]. Because GEP is hard to implement in a routine clinical test, many efforts have been made to classify COO of DLBCL using immunohistochemistry (IHC) for several markers, despite issues on reproducibility and reliability of IHC algorithms [42-45]. The 2008 classification recognized GCB and ABC/non-GCB “molecular or immunohistochemical subgroups” of DLBCL based on GEP or IHC but considered these subclassification of DLBCL as optional [33]. Subsequent studies have demonstrated that the differences in genetic alterations and activation of signaling pathways as well as prognosis between GCB and ABC/non-GCB DLBCLs may affect the potential therapeutic targets and personalized therapy of patients with DLBCL as described previously [46]. Thus, the 2016 revision of WHO classification requires the identification of GCB versus ABC/nonGCB DLBCL using either GEP or IHC [32].

Methodology

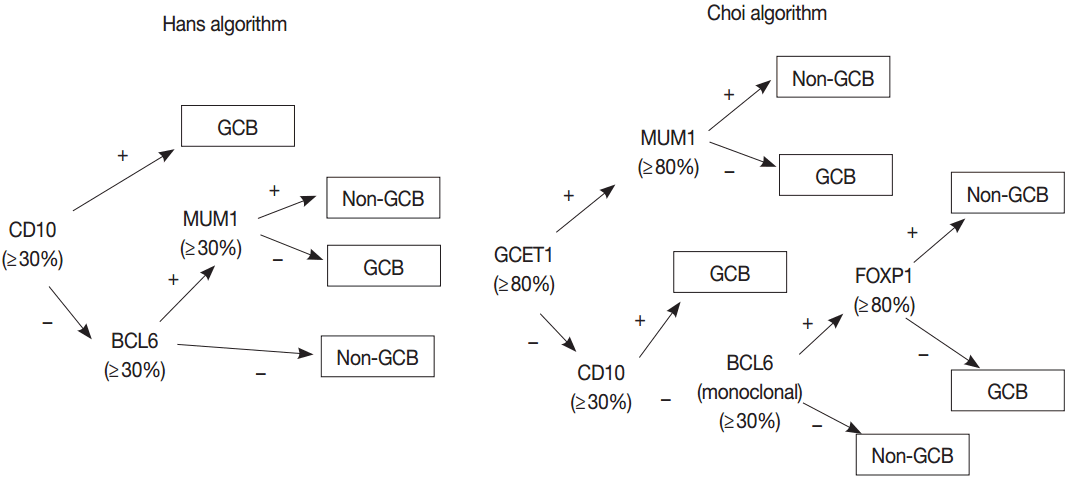
GEP using microarray, including Lymphochip microarray and Affymetrix microarray, robustly classified the GCB versus ABC DLBCL with prognostic significance [38,39]. However, these assays need fresh tissue for a large amount of RNA of high-quality and have restrictions for clinical application. Thus, several immunohistochemical algorithms as surrogates have been developed, as represented by Hans and Choi algorithm (Fig. 5), which have shown reasonable correlations with GEP [42,43]. However, in the following studies, the concordance rate between the immunohistochemically defined and GEP-defined subgroups has been variable and the IHC algorithm has some limitations in terms of accuracy, reproducibility and prognostic utility [44,45].
Recently, a 20-gene gene expression assay using FFPE tissues and NanoString-based digital gene expression technology has been proposed for the determination of COO subgroups of DLBCL [47]. This assay (Lymph2CX) identified GCB versus ABC/non-GCB subgroups by quantifying the RNA transcripts extracted from FFPE tissue and produced reproducible accuracy and prognostic value [48]. Although these assays using nCounter system are not yet accessible to most laboratories, it may be a promising alternative to the IHC-based algorithms.

MOLECULAR TESTING USING NEXT-GENERATION SEQUENCING: FUTURE NEXT-GENERATION SEQUENCING PANEL FOR DIAGNOSTIC, PROGNOSTIC AND PREDICTIVE PURPOSE

Background

Assays for single gene detection have been replaced by NGS which allows for the simultaneous evaluation of many genes. Targeted sequencing for gene sets is appropriate for clinical purpose and can acquire information for diagnosis, prognostication, and therapeutic targets. Currently, Korea Food and Drug Administration (KFDA) allows two levels of NGS test panel. Level 1 is composed of less than 50 genes including TP53 and MYD88. Level II is composed of less than 200 genes including NOTCH1 and NOTCH2. Although there is no general guideline for which gene sets should be included in molecular test using NGS, it is recommended that genes for pathologic diagnosis and prognostication according to the WHO classification and genes with implications for standard clinical management and current clinical trial be included in the level I gene set. Level II gene set may include potential therapeutic targets which are identified in high throughput sequencing of malignant lymphoma, but have no available drug yet. Recommended list of genes is depicted in Tables 3 and 4.

Genes incorporated in the 2016 revision of WHO classification as a diagnostic marker

Rearrangement of a specific gene is diagnostic for a certain type of malignant lymphoma. It includes BCL2 for follicular lymphoma, MYC for Burkitt lymphoma, simultaneous rearrangement of MYC with BCL2 and/or BCL6 for high grade B-cell lymphoma, and CCND1, CCND2, and CCND3 for mantle cell lymphoma (MCL) [32,33]. The 2016 revision of WHO classification incorporated a few additional genes in the diagnostic criteria [32]. BRAF V600E mutations are found in almost all cases of hairy cell leukemia (HCL) but not in HCL-variant (HCL-v) or other small B-cell lymphoid neoplasms [49-52]. Mutations in MAP2K1 which encodes MEK1 (which is downstream of BRAF) have been reported in almost half of HCL-v and in the majority of HCL that use IGHV4-34 and which, like HCL-v, lack BRAF V600E mutations [53,54]. MYD88 mutation is important in the differential diagnosis between nodal marginal zone lymphoma and lymphoplasmacytic lymphoma (LPL) [55-58]. Ninety percent of LPL or Waldenström macroglobulinemia have MYD88 L265P mutations. This mutation is also found in a significant proportion of IgM, but not IgG or IgA, monoclonal gammopathy of undetermined significance cases, approximately 30% of non-GCB–type DLBCL, more than half of primary cutaneous DLBCL (leg type), and many DLBCL at immuneprivileged sites, but not in plasma cell myeloma, even of IgM type. IG/IRF4 fusions are associated with a distinct subgroup of germinal center B-cell lymphomas composed of follicular lymphoma (FL) grade 3 or (centroblastic) DLBCL characterized by coexpression of MUM1 and BCL6 in the absence of PRDM1/BLIMP1, a specific gene expression profile, and a disease onset predominantly in childhood or young adulthood [59]. A new provisional entity designated Burkitt-like lymphoma with 11q aberration has a chromosome 11q alteration characterized by proximal gains and telomeric losses, but without MYC rearrangement [60,61].

Prognostic and predictive marker

TP53, NOTCH1, SF3B1, and BIRC3, are of clinical interest because of their adverse prognostic implications in chronic lymphocytic leukemia (CLL) and also because some are potential direct or indirect therapeutic targets [62,63]. TP53 mutations are present in 10.6% of CLL, ATM mutations in 11.1%, SF3B1 mutations in 12.6%, NOTCH1 mutations in 21.8%, and BIRC3 mutations in 4.2%. The ATM-p53 DNA damage response pathway plays a crucial role in chemoresistance in CLL, as indicated by the adverse prognostic impact of deletions of 17p (locus of TP53) and 11q (locus of ATM) detected by FISH analysis [64]. BIRC3 is a negative regulator of noncanonical nuclear factor κB (NF-κB) signaling. BIRC3 disruption by inactivating mutations and/or gene deletions selectively affects fludarabine-refractory CLL cases [65].
MCL is also characterized by having mutations affecting many different genes including ATM (40%–75%), CCND1 (35%), and TP53 (28%) [20]. Mutations of NOTCH1 and NOTCH2 occur in less than 10% of cases and are identified in a subset of tumors with more adverse biological features including blastoid/pleomorphic morphology. NOTCH1 and NOTCH2 have prognostic impact and potential therapeutic importance in MCL [66].
Mutations or copy number losses of TP53 genes are independent unfavorable prognostic factors in different types of B-cell lymphomas [67]. CD58 gene encodes a molecule involved in T and natural killer (NK)-cell-mediated responses. In addition to TP53, mutations or copy number losses of CD58 in DLBCL are independent unfavorable prognostic factors [68]. Recurrent mutations of the exportin 1 gene (XPO1) have been observed in primary mediastinal B-cell lymphoma and Hodgkin lymphoma and they have prognostic implication [69,70]. TET2 is a tumor suppressor gene and frequently mutated in a variety of T or NK-cell lymphoma. TET2 mutation is associated with advanced-stage disease, thrombocytopenia, high international prognostic index scores, and a shorter progression-free survival [71,72].

Therapeutic targets

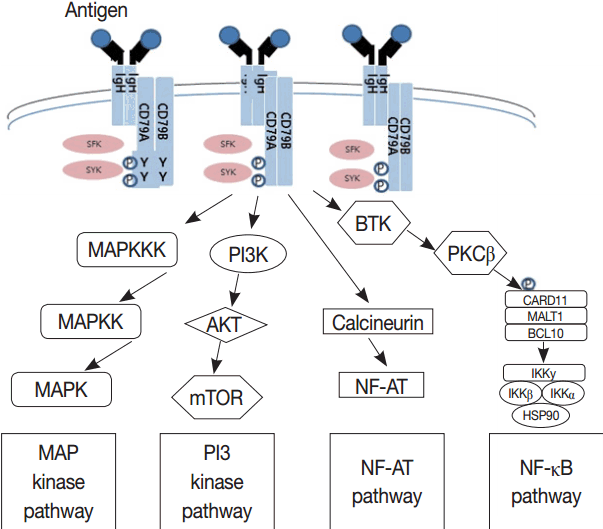
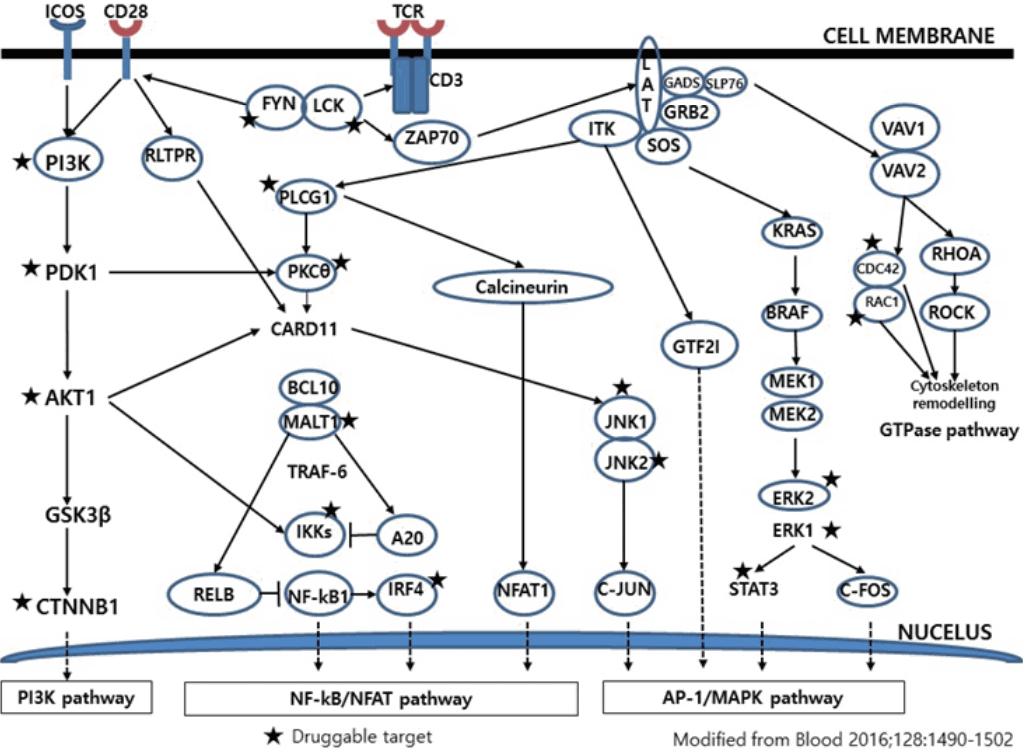
Much has been learned about the mutational landscape of malignant lymphomas. Genes identified in NGS analysis are important in the development and progression of malignant lymphoma and are potential therapeutic targets although drugs are currently available for only some of these targets. Genes involved in BCR signaling which converges to mitogen-activated protein kinase pathway, NF-κB pathway, and phosphoinositide 3-kinase (PI3K) pathway are therapeutic targets of B-cell lymphomas (Fig. 6). These include CD79A/B, SYK, and SFK of BCR signaling pathway, BTK, PKCβ, CARD11, MALT1, BCL10, IKKα, IKKβ, and IKKγ of NF-κB pathway, and PI3K, AKT, and mammalian target of rapaMYCin of PI3K pathway [73]. Most active clinical trials are targeting these genes. Mutations of chromatin regulator/modifier genes, such as CREBBP, KMT2D (MLL2), and EZH2 are extremely common early events and may be potential therapeutic targets [74-77]. Chromosomal rearrangements of DUSP22 and TP63 were identified in 30% and 8% of anaplastic lymphoma kinase (ALK)–negative anaplastic large cell lymphoma (ALCL), respectively [78]. ALCLs with DUSP22 rearrangements show significant differences from other ALK-negative ALCLs, typically showing sheets of hallmark cells with doughnut cells and a few large pleomorphic cells [78,79]. DUSP22 functions as a tumor suppressor gene and potential therapeutic manipulation. T-cell lymphoma of follicular helper T-cell (TFH) phenotype including AITL is characterized by mutations of genes involved in the TCR signaling pathway including RHOA G17V mutation (70%), CD28 mutation (11 %), CTLA4-CD28 fusion (58 %), PLCG1 (14.1%), PI3K elements (7%), CTNNB1 (6%), and GTF2I (6%) (Fig. 7) [80-85]. Although mutations of RHOA, CD28, and CTLA4-CD28 fusion themselves have no prognostic impact, targeting of TCR-related events may hold promise for the treatment of TFH-derived lymphomas. SYK-ITK fusion is detected in peripheral T-cell lymphoma (PTCL)-NOS, or AITL. The fusion kinase ITK-SYK mimics a TCR signal and drives oncogenesis in conditional mouse models of PTCL [86,87]. IDH2 mutation is frequently identified in AITL (19%–42%), but not in other types of T- or NK-cell lymphoma. These mutations alter IDH enzymatic function, resulting in the accumulation of D-2-hydroxyglutarate (D-2-HG) in cells and tissues. D-2-HG may act as an oncometabolite, driving tumor progression and affect hypoxia signaling (prolyl hydroxylases), histone methylation, and DNA methylation [88,89]. Genes involved in JAK-STAT pathway are frequently mutated in extranodal NK/T-cell lymphoma, including STAT3 (most common), STAT5B, JAK3, and JAK1. Other commonly mutated genes include histone modification-related genes such as BCOR and MLL2, RNA helicase DDX3, and P53 [90-92]. All these genes are important in the progression of NK/T-cell lymphoma and may be potential therapeutic targets. In addition to these genes, there are genes with inhibitors available, which are being tried in clinical trials.

Samples for targeted sequencing

FFPE sample is available for targeted sequencing. Single nucleotide variants and copy number alteration can be detected using DNA extracted from FFPE tissue and the translocation can be identified by RNA sequencing using FFPE samples. In general, lymphoma is often highly cellular; therefore, DNA extracted from FFPE sample is sufficient to obtain sequencing data, although there is a variation in the minimum requirement of DNA amount according to the NGS platform. Before starting the test, development of optimum operating procedure in each laboratory is mandatory.

CONCLUSION

Molecular diagnostics for B- and T-cell clonality test and cytogenetic test for malignant lymphoma have been much improved and introduced in routine clinical practice. In addition, determination of COO in DLBCL and NGS-based tests for genetic alterations in malignant lymphomas will open a pathway toward personalized medicine and targeted therapy in the near future.

Notes

Conflicts of Interest

No potential conflict of interest relevant to this article was reported.

ACKNOWLEDGMENTS

The authors would like to thank all the executive officers of the Hematopathology Study Group of the Korean Society of Pathologists for careful review and discussion on this manuscript.
This research was supported by The Korean Society of Pathologists Grant (2016).

REFERENCES

1. Tonegawa S. Somatic generation of antibody diversity. Nature. 1983; 302:575–81.
crossref
2. Davis MM, Bjorkman PJ. T-cell antigen receptor genes and T-cell recognition. Nature. 1988; 334:395–402.
crossref
3. van Dongen JJ, Langerak AW, BrÜggemann M, et al. Design and standardization of PCR primers and protocols for detection of clonal immunoglobulin and T-cell receptor gene recombinations in suspect lymphoproliferations: report of the BIOMED-2 Concerted Action BMH4-CT98-3936. Leukemia. 2003; 17:2257–317.
crossref
4. Gilfillan S, Dierich A, Lemeur M, Benoist C, Mathis D. Mice lacking TdT: mature animals with an immature lymphocyte repertoire. Science. 1993; 261:1175–8.
crossref
5. van Dongen JJ, Szczepanski T, Adriaansen HJ. Immunobiology of leukemia. In : Henderson ES, Lister TA, Greaves MF, editors. 7th ed. Leukemia. Philadelphia: WB Saunders Company;2002. p. 85–130.
6. Langerak AW, Groenen PJ, Bruggemann M, et al. EuroClonality/BIOMED-2 guidelines for interpretation and reporting of Ig/TCR clonality testing in suspected lymphoproliferations. Leukemia. 2012; 26:2159–71.
crossref
7. Sherwood AM, Desmarais C, Livingston RJ, et al. Deep sequencing of the human TCRγ and TCRβ repertoires suggests that TCRβ rearranges after αβ and γδ T cell commitment. Sci Transl Med. 2011; 3:90ra61.
crossref
8. Bailey NG, Elenitoba-Johnson KS. Molecular diagnostics of T-cell lymphoproliferative disorders. Cancer J. 2014; 20:48–60.
crossref
9. Schafernak KT, Variakojis D, Goolsby CL, et al. Clonality assessment of cutaneous B-cell lymphoid proliferations: a comparison of flow cytometry immunophenotyping, molecular studies, and immunohistochemistry/in situ hybridization and review of the literature. Am J Dermatopathol. 2014; 36:781–95.
10. FÖdinger M, Winkler K, Mannhalter C, Chott A. Combined polymerase chain reaction approach for clonality detection in lymphoid neoplasms. Diagn Mol Pathol. 1999; 8:80–91.
11. Thériault C, Galoin S, Valmary S, et al. PCR analysis of immunoglobulin heavy chain (IgH) and TcR-γ chain gene rearrangements in the diagnosis of lymphoproliferative disorders: results of a study of 525 cases. Mod Pathol. 2000; 13:1269–79.
crossref
12. Benhattar J, Delacretaz F, Martin P, Chaubert P, Costa J. Improved polymerase chain reaction detection of clonal T-cell lymphoid neoplasms. Diagn Mol Pathol. 1995; 4:108–12.
crossref
13. Signoretti S, Murphy M, Cangi MG, Puddu P, Kadin ME, Loda M. Detection of clonal T-cell receptor γ gene rearrangements in paraffin-embedded tissue by polymerase chain reaction and nonradioactive single-strand conformational polymorphism analysis. Am J Pathol. 1999; 154:67–75.
crossref
14. Patel KP, Pan Q, Wang Y, et al. Comparison of BIOMED-2 versus laboratory-developed polymerase chain reaction assays for detecting T-cell receptor-γ gene rearrangements. J Mol Diagn. 2010; 12:226–37.
crossref
15. van Krieken JH, Langerak AW, Macintyre EA, et al. Improved reliability of lymphoma diagnostics via PCR-based clonality testing: report of the BIOMED-2 Concerted Action BHM4-CT98-3936. Leukemia. 2007; 21:201–6.
16. Langerak AW, Molina TJ, Lavender FL, et al. Polymerase chain reaction-based clonality testing in tissue samples with reactive lymphoproliferations: usefulness and pitfalls. A report of the BIOMED-2 Concerted Action BMH4-CT98-3936. Leukemia. 2007; 21:222–9.
crossref
17. Brüggemann M, White H, Gaulard P, et al. Powerful strategy for polymerase chain reaction-based clonality assessment in T-cell malignancies Report of the BIOMED-2 Concerted Action BHM4 CT98-3936. Leukemia. 2007; 21:215–21.
crossref
18. Kuppers R, Klein U, Hansmann ML, Rajewsky K. Cellular origin of human B-cell lymphomas. N Engl J Med. 1999; 341:1520–9.
crossref
19. Davis TH, Yockey CE, Balk SP. Detection of clonal immunoglobulin gene rearrangements by polymerase chain reaction amplification and single-strand conformational polymorphism analysis. Am J Pathol. 1993; 142:1841–7.
20. Bourguin A, Tung R, Galili N, Sklar J. Rapid, nonradioactive detection of clonal T-cell receptor gene rearrangements in lymphoid neoplasms. Proc Natl Acad Sci U S A. 1990; 87:8536–40.
crossref
21. Medeiros LJ, Carr J. Overview of the role of molecular methods in the diagnosis of malignant lymphomas. Arch Pathol Lab Med. 1999; 123:1189–207.
crossref
22. Boeckx N, Willemse MJ, Szczepanski T, et al. Fusion gene transcripts and Ig/TCR gene rearrangements are complementary but infrequent targets for PCR-based detection of minimal residual disease in acute myeloid leukemia. Leukemia. 2002; 16:368–75.
crossref
23. Szczepanński T, Beishuizen A, Pongers-Willemse MJ, et al. Cross-lineage T cell receptor gene rearrangements occur in more than ninety percent of childhood precursor-B acute lymphoblastic leukemias: alternative PCR targets for detection of minimal residual disease. Leukemia. 1999; 13:196–205.
crossref
24. Szczepanński T, Langerak AW, van Dongen JJ, van Krieken JH. Lymphoma with multi-gene rearrangement on the level of immunoglobulin heavy chain, light chain, and T-cell receptor β chain. Am J Hematol. 1998; 59:99–100.
25. Moreau EJ, Langerak AW, van Gastel-Mol EJ, et al. Easy detection of all T cell receptor gamma (TCRG) gene rearrangements by Southern blot analysis: recommendations for optimal results. Leukemia. 1999; 13:1620–6.
26. Langerak AW, Wolvers-Tettero IL, van Dongen JJ. Detection of T cell receptor beta (TCRB) gene rearrangement patterns in T cell malignancies by Southern blot analysis. Leukemia. 1999; 13:965–74.
27. Kluin P, Schuuring E. Molecular cytogenetics of lymphoma: where do we stand in 2010? Histopathology. 2011; 58:128–44.
crossref
28. Niitsu N, Okamoto M, Miura I, Hirano M. Clinical features and prognosis of de novo diffuse large B-cell lymphoma with t(14;18) and 8q24/c-MYC translocations. Leukemia. 2009; 23:777–83.
crossref
29. Johnson NA, Slack GW, Savage KJ, et al. Concurrent expression of MYC and BCL2 in diffuse large B-cell lymphoma treated with rituximab plus cyclophosphamide, doxorubicin, vincristine, and prednisone. J Clin Oncol. 2012; 30:3452–9.
30. Horn H, Ziepert M, Becher C, et al. MYC status in concert with BCL2 and BCL6 expression predicts outcome in diffuse large B-cell lymphoma. Blood. 2013; 121:2253–63.
crossref
31. Hu S, Xu-Monette ZY, Tzankov A, et al. MYC/BCL2 protein coexpression contributes to the inferior survival of activated B-cell subtype of diffuse large B-cell lymphoma and demonstrates high-risk gene expression signatures: a report from The International DLBCL Rituximab-CHOP Consortium Program. Blood. 2013; 121:4021–31.
crossref
32. Swerdlow SH, Campo E, Pileri SA, et al. The 2016 revision of the World Health Organization classification of lymphoid neoplasms. Blood. 2016; 127:2375–90.
crossref
33. Swerdlow SH, Campo E, Harris NL, et al. WHO classification of tumours of haematopoietic and lymphoid tissues. 4th ed. Lyon: IARC Press;2008.
34. Green TM, Young KH, Visco C, et al. Immunohistochemical double-hit score is a strong predictor of outcome in patients with diffuse large B-cell lymphoma treated with rituximab plus cyclophosphamide, doxorubicin, vincristine, and prednisone. J Clin Oncol. 2012; 30:3460–7.
crossref
35. Campbell LJ. Cancer cytogenetics: methods and protocols. 2nd ed. New York: Humana Press;2011.
36. Wolff DJ, Bagg A, Cooley LD, et al. Guidance for fluorescence in situ hybridization testing in hematologic disorders. J Mol Diagn. 2007; 9:134–43.
37. McGowan-Jordan J, Simons A, Schmid M. ISCN 2016: an international system for human cytogenomic nomenclature (2016). Basel: Karger;2016.
38. Alizadeh AA, Eisen MB, Davis RE, et al. Distinct types of diffuse large B-cell lymphoma identified by gene expression profiling. Nature. 2000; 403:503–11.
crossref
39. Wright G, Tan B, Rosenwald A, Hurt EH, Wiestner A, Staudt LM. A gene expression-based method to diagnose clinically distinct subgroups of diffuse large B cell lymphoma. Proc Natl Acad Sci U S A. 2003; 100:9991–6.
crossref
40. Testoni M, Zucca E, Young KH, Bertoni F. Genetic lesions in diffuse large B-cell lymphomas. Ann Oncol. 2015; 26:1069–80.
crossref
41. Carbone A, Gloghini A, Kwong YL, Younes A. Diffuse large B cell lymphoma: using pathologic and molecular biomarkers to define subgroups for novel therapy. Ann Hematol. 2014; 93:1263–77.
crossref
42. Hans CP, Weisenburger DD, Greiner TC, et al. Confirmation of the molecular classification of diffuse large B-cell lymphoma by immunohistochemistry using a tissue microarray. Blood. 2004; 103:275–82.
crossref
43. Choi WW, Weisenburger DD, Greiner TC, et al. A new immunostain algorithm classifies diffuse large B-cell lymphoma into molecular subtypes with high accuracy. Clin Cancer Res. 2009; 15:5494–502.
crossref
44. Meyer PN, Fu K, Greiner TC, et al. Immunohistochemical methods for predicting cell of origin and survival in patients with diffuse large B-cell lymphoma treated with rituximab. J Clin Oncol. 2011; 29:200–7.
crossref
45. Gutiérrez-García G, Cardesa-Salzmann T, Climent F, et al. Gene-expression profiling and not immunophenotypic algorithms predicts prognosis in patients with diffuse large B-cell lymphoma treated with immunochemotherapy. Blood. 2011; 117:4836–43.
crossref
46. Intlekofer AM, Younes A. Precision therapy for lymphoma: current state and future directions. Nat Rev Clin Oncol. 2014; 11:585–96.
47. Scott DW, Wright GW, Williams PM, et al. Determining cell-of-origin subtypes of diffuse large B-cell lymphoma using gene expression in formalin-fixed paraffin-embedded tissue. Blood. 2014; 123:1214–7.
48. Scott DW, Mottok A, Ennishi D, et al. Prognostic significance of diffuse large B-cell lymphoma cell of origin determined by digital gene expression in formalin-fixed paraffin-embedded tissue biopsies. J Clin Oncol. 2015; 33:2848–56.
crossref
49. Dietrich S, Pircher A, Endris V, et al. BRAF inhibition in hairy cell leukemia with low-dose vemurafenib. Blood. 2016; 127:2847–55.
crossref
50. Raess PW, Mintzer D, Husson M, et al. BRAF V600E is also seen in unclassifiable splenic B-cell lymphoma/leukemia, a potential mimic of hairy cell leukemia. Blood. 2013; 122:3084–5.
51. Blombery PA, Wong SQ, Hewitt CA, et al. Detection of BRAF mutations in patients with hairy cell leukemia and related lymphoproliferative disorders. Haematologica. 2012; 97:780–3.
crossref
52. Arcaini L, Zibellini S, Boveri E, et al. The BRAF V600E mutation in hairy cell leukemia and other mature B-cell neoplasms. Blood. 2012; 119:188–91.
53. Mason EF, Brown RD, Szeto DP, et al. Detection of activating MAP2K1 mutations in atypical hairy cell leukemia and hairy cell leukemia variant. Leuk Lymphoma. 2017; 58:233–6.
54. Waterfall JJ, Arons E, Walker RL, et al. High prevalence of MAP2K1 mutations in variant and IGHV4-34-expressing hairy-cell leukemias. Nat Genet. 2014; 46:8–10.
55. Kapoor P, Ansell SM, Fonseca R, et al. Diagnosis and management of waldenstrom macroglobulinemia: Mayo stratification of macroglobulinemia and risk-adapted therapy (mSMART) guidelines 2016. JAMA Oncol 2017 Jan 5 [Epub]. https://doi.org/10.1001/jamaoncol.2016.5763.
crossref
56. Schmidt J, Federmann B, Schindler N, et al. MYD88 L265P and CXCR4 mutations in lymphoplasmacytic lymphoma identify cases with high disease activity. Br J Haematol. 2015; 169:795–803.
57. Martinez-Lopez A, Curiel-Olmo S, Mollejo M, et al. MYD88 (L265P) somatic mutation in marginal zone B-cell lymphoma. Am J Surg Pathol. 2015; 39:644–51.
58. Hamadeh F, MacNamara SP, Aguilera NS, Swerdlow SH, Cook JR. MYD88 L265P mutation analysis helps define nodal lymphoplasmacytic lymphoma. Mod Pathol. 2015; 28:564–74.
59. Salaverria I, Philipp C, Oschlies I, et al. Translocations activating IRF4 identify a subtype of germinal center-derived B-cell lymphoma affecting predominantly children and young adults. Blood. 2011; 118:139–47.
crossref
60. Salaverria I, Martin-Guerrero I, Wagener R, et al. A recurrent 11q aberration pattern characterizes a subset of MYC-negative high-grade B-cell lymphomas resembling Burkitt lymphoma. Blood. 2014; 123:1187–98.
crossref
61. Ferreiro JF, Morscio J, Dierickx D, et al. Post-transplant molecularly defined Burkitt lymphomas are frequently MYC-negative and characterized by the 11q-gain/loss pattern. Haematologica. 2015; 100:e275–9.
crossref
62. Stilgenbauer S, Schnaiter A, Paschka P, et al. Gene mutations and treatment outcome in chronic lymphocytic leukemia: results from the CLL8 trial. Blood. 2014; 123:3247–54.
crossref
63. Nadeu F, Delgado J, Royo C, et al. Clinical impact of clonal and subclonal TP53, SF3B1, BIRC3, NOTCH1, and ATM mutations in chronic lymphocytic leukemia. Blood. 2016; 127:2122–30.
64. te Raa GD, Malcikova J, Pospisilova S, et al. Overview of available p53 function tests in relation to TP53 and ATM gene alterations and chemoresistance in chronic lymphocytic leukemia. Leuk Lymphoma. 2013; 54:1849–53.
65. Rossi D, Fangazio M, Rasi S, et al. Disruption of BIRC3 associates with fludarabine chemorefractoriness in TP53 wild-type chronic lymphocytic leukemia. Blood. 2012; 119:2854–62.
crossref
66. Beà S, Valdés-Mas R, Navarro A, et al. Landscape of somatic mutations and clonal evolution in mantle cell lymphoma. Proc Natl Acad Sci U S A. 2013; 110:18250–5.
67. Xu-Monette ZY, Wu L, Visco C, et al. Mutational profile and prognostic significance of TP53 in diffuse large B-cell lymphoma patients treated with R-CHOP: report from an International DLBCL Rituximab-CHOP Consortium Program Study. Blood. 2012; 120:3986–96.
crossref
68. Cao Y, Zhu T, Zhang P, et al. Mutations or copy number losses of CD58 and TP53 genes in diffuse large B cell lymphoma are independent unfavorable prognostic factors. Oncotarget. 2016; 7:83294–307.
69. Jardin F, Pujals A, Pelletier L, et al. Recurrent mutations of the exportin 1 gene (XPO1) and their impact on selective inhibitor of nuclear export compounds sensitivity in primary mediastinal B-cell lymphoma. Am J Hematol. 2016; 91:923–30.
70. Camus V, Stamatoullas A, Mareschal S, et al. Detection and prognostic value of recurrent exportin 1 mutations in tumor and cell-free circulating DNA of patients with classical Hodgkin lymphoma. Haematologica. 2016; 101:1094–101.
crossref
71. Nakajima H, Kunimoto H. TET2 as an epigenetic master regulator for normal and malignant hematopoiesis. Cancer Sci. 2014; 105:1093–9.
72. Lemonnier F, Couronné L, Parrens M, et al. Recurrent TET2 mutations in peripheral T-cell lymphomas correlate with TFH-like features and adverse clinical parameters. Blood. 2012; 120:1466–9.
73. Young RM, Shaffer AL 3rd, Phelan JD, Staudt LM. B-cell receptor signaling in diffuse large B-cell lymphoma. Semin Hematol. 2015; 52:77–85.
crossref
74. Okosun J, Bödör C, Wang J, et al. Integrated genomic analysis identifies recurrent mutations and evolution patterns driving the initiation and progression of follicular lymphoma. Nat Genet. 2014; 46:176–81.
crossref
75. Bouska A, Zhang W, Gong Q, et al. Combined copy number and mutation analysis identifies oncogenic pathways associated with transformation of follicular lymphoma. Leukemia. 2017; 31:83–91.
crossref
76. Younes A. Promising novel agents for aggressive B-cell lymphoma. Hematol Oncol Clin North Am. 2016; 30:1229–37.
crossref
77. Kurmasheva RT, Sammons M, Favours E, et al. Initial testing (stage 1) of tazemetostat (EPZ-6438), a novel EZH2 inhibitor, by the pediatric preclinical testing program. Pediatr Blood Cancer. 2017; 64:e26218.
crossref
78. Parrilla Castellar ER, Jaffe ES, Said JW, et al. ALK-negative anaplastic large cell lymphoma is a genetically heterogeneous disease with widely disparate clinical outcomes. Blood. 2014; 124:1473–80.
crossref
79. King RL, Dao LN, McPhail ED, et al. Morphologic features of ALK-negative anaplastic large cell lymphomas with DUSP22 rearrangements. Am J Surg Pathol. 2016; 40:36–43.
80. Manso R, Sánchez-Beato M, Monsalvo S, et al. The RHOA G17V gene mutation occurs frequently in peripheral T-cell lymphoma and is associated with a characteristic molecular signature. Blood. 2014; 123:2893–4.
81. Yoo HY, Sung MK, Lee SH, et al. A recurrent inactivating mutation in RHOA GTPase in angioimmunoblastic T cell lymphoma. Nat Genet. 2014; 46:371–5.
crossref
82. Sakata-Yanagimoto M, Enami T, Yoshida K, et al. Somatic RHOA mutation in angioimmunoblastic T cell lymphoma. Nat Genet. 2014; 46:171–5.
83. Palomero T, Couronné L, Khiabanian H, et al. Recurrent mutations in epigenetic regulators, RHOA and FYN kinase in peripheral T cell lymphomas. Nat Genet. 2014; 46:166–70.
crossref
84. Vallois D, Dobay MP, Morin RD, et al. Activating mutations in genes related to TCR signaling in angioimmunoblastic and other follicular helper T-cell-derived lymphomas. Blood. 2016; 128:1490502.
crossref
85. Rohr J, Guo S, Huo J, et al. Recurrent activating mutations of CD28 in peripheral T-cell lymphomas. Leukemia. 2016; 30:1062–70.
86. Streubel B, Vinatzer U, Willheim M, Raderer M, Chott A. Novel t(5;9)(q33;q22) fuses ITK to SYK in unspecified peripheral T-cell lymphoma. Leukemia. 2006; 20:313–8.
crossref
87. Pechloff K, Holch J, Ferch U, et al. The fusion kinase ITK-SYK mimics a T cell receptor signal and drives oncogenesis in conditional mouse models of peripheral T cell lymphoma. J Exp Med. 2010; 207:1031–44.
crossref
88. Wang C, McKeithan TW, Gong Q, et al. IDH2R172 mutations define a unique subgroup of patients with angioimmunoblastic T-cell lymphoma. Blood. 2015; 126:1741–52.
89. Cairns RA, Iqbal J, Lemonnier F, et al. IDH2 mutations are frequent in angioimmunoblastic T-cell lymphoma. Blood. 2012; 119:1901–3.
90. Jiang L, Gu ZH, Yan ZX, et al. Exome sequencing identifies somatic mutations of DDX3X in natural killer/T-cell lymphoma. Nat Genet. 2015; 47:1061–6.
91. Lee S, Park HY, Kang SY, et al. Genetic alterations of JAK/STAT cascade and histone modification in extranodal NK/T-cell lymphoma nasal type. Oncotarget. 2015; 6:17764–76.
crossref
92. Dobashi A, Tsuyama N, Asaka R, et al. Frequent BCOR aberrations in extranodal NK/T-cell lymphoma, nasal type. Genes Chromosomes Cancer. 2016; 55:460–71.
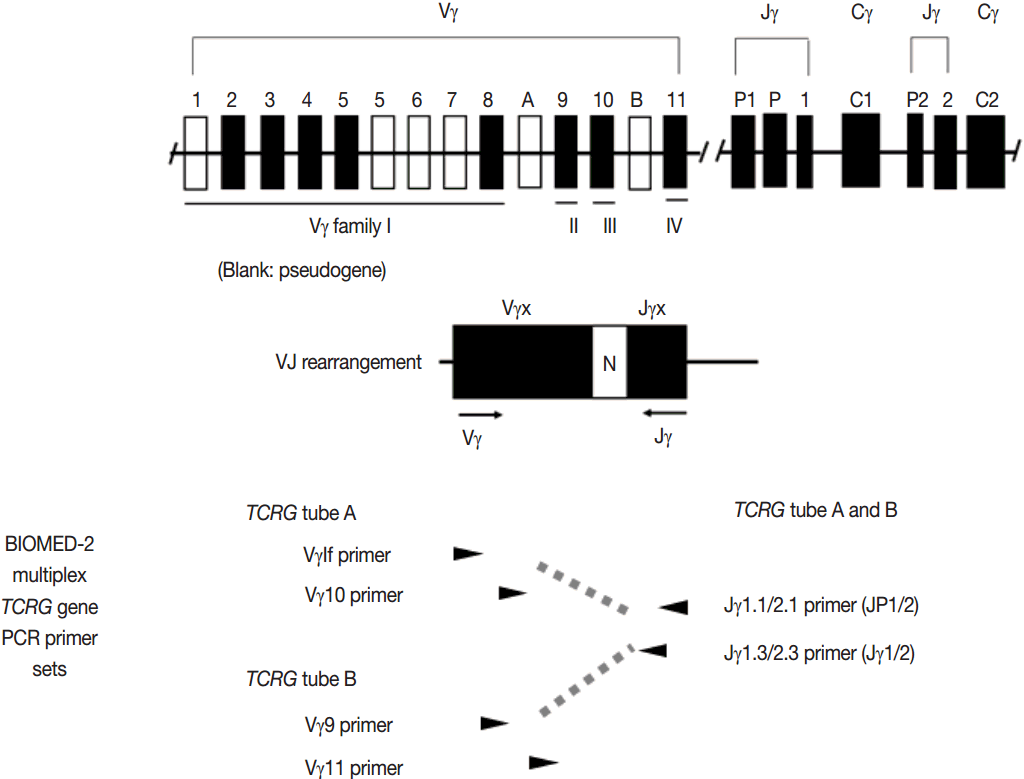
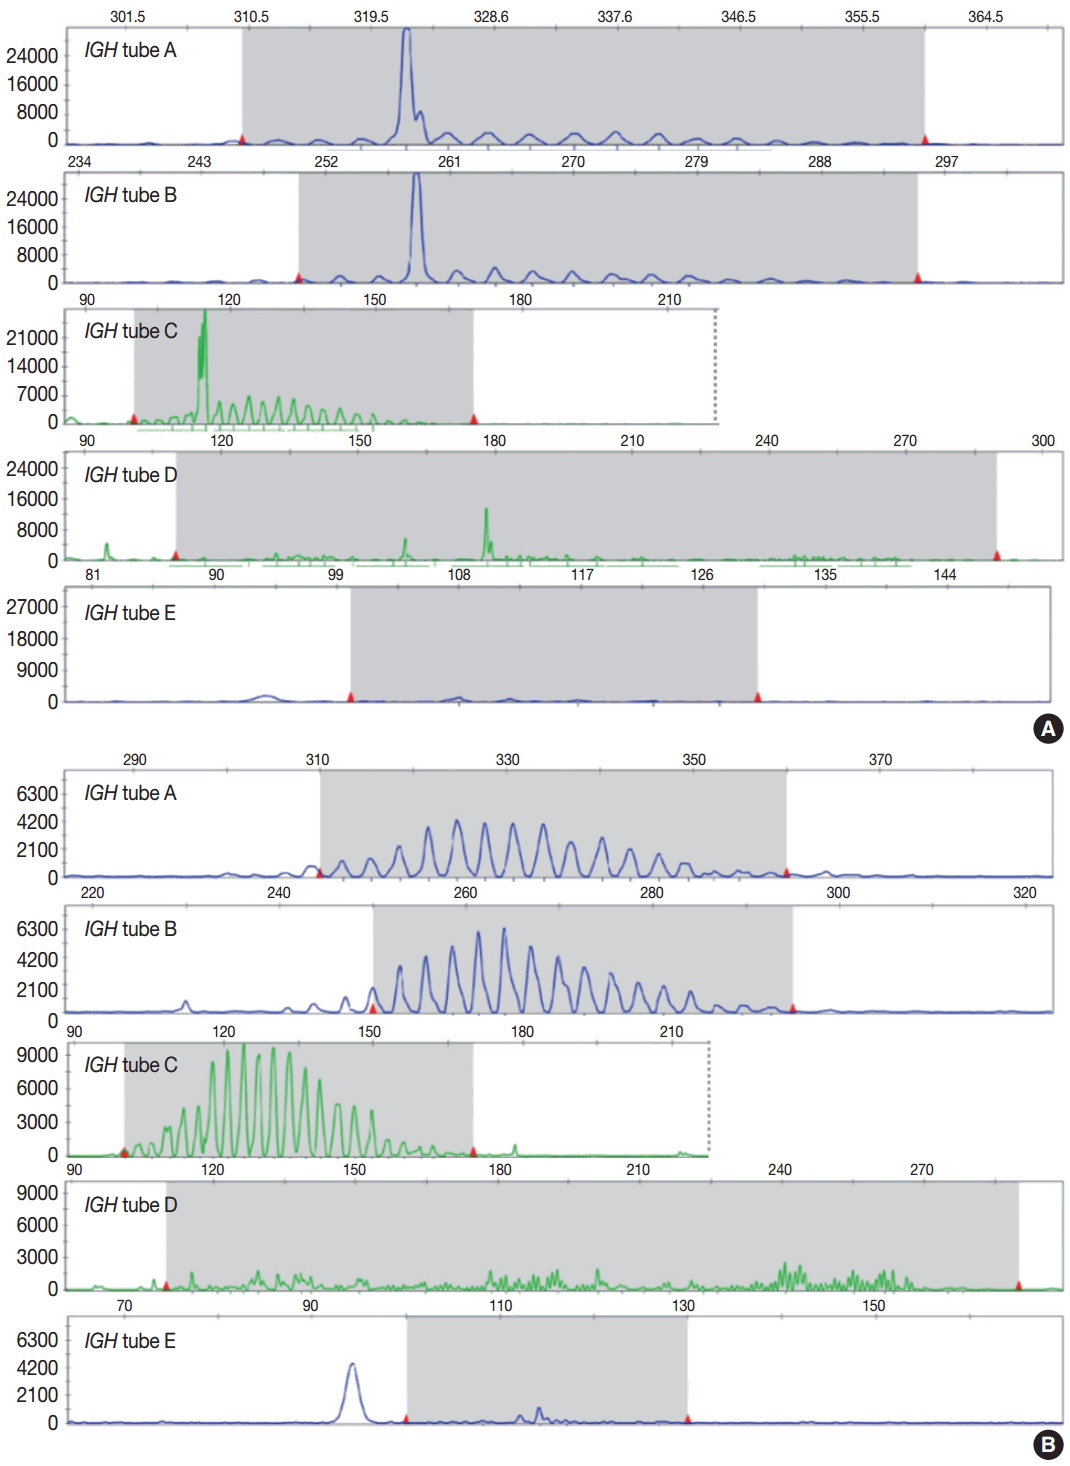
Fig. 1.
Structure of IGH genes and the BIOMED-2 multiplex IGH gene polymerase chain reaction assay.
jptm-2017-04-09f1.tif
Fig. 2.
Structure of TCRG genes and the BIOMED-2 multiplex TCRG gene polymerase chain reaction assay.
jptm-2017-04-09f2.tif
Fig. 3.
Representative results and interpretation of BIOMED-2 multiplex IGH PCR analyzed by gene scanning. Clonal IGH gene rearrangement was detected in case (A), but not in case (B).
jptm-2017-04-09f3.tif
Fig. 4.
Fluorescence in situ hybridization analysis to detect gene translocations using dual color, dual fusion probe (arrow, fused IGH and BCL2 genes) (A) and dual color, break apart probe (arrows, splitted MALT1 genes) (B). MALT, mucosa-associated lymphoid tissue.
jptm-2017-04-09f4.tif
Fig. 5.
Representative immunohistochemical algorithms for the subgrouping of diffuse large B-cell lymphoma [42, 43]. GCB, germinal center B-cell.
jptm-2017-04-09f5.tif
Fig. 6.
Genes involved in B-cell receptor signaling which converges to mitogen-activated protein (MAP) kinase pathway, nuclear factor κB (NF-κB) pathway, and phosphoinositide 3-kinase (PI3K) pathway are the therapeutic targets of B-cell lymphomas. MAPK, mitogen-activated protein kinase; MAPKK, mitogen-activated protein kinase kinase; MAPKKK, mitogen-activated protein kinase kinase kinase; mTOR, mammalian target of rapamycin. Modified from Young et al. Semin Hematol 2015;52:77-85, with permission of Elsevier [73].
jptm-2017-04-09f6.tif
Fig. 7.
T-cell receptor signaling-related genes in nodal lymphomas of follicular helper T-cell phenotype are therapeutic targets. PI3K, phosphoinositide 3-kinase; NF-κB, nuclear factor κB; MAPK, mitogen-activated protein kinase. Modified from Vallois et al. Blood 2016;128:1490- 502, with permission of American Society of Hematology [84].
jptm-2017-04-09f7.tif
Table 1.
EuroClonality/BIOMED-2 guidelines for interpretation and reporting of Ig/TCR clonality testing
Type of profile per tube (in duplicate) Technical description Molecular interpretation/conclusion
No peaks/bands (but: poor DNA quality) No (specific) product, poor DNA quality Not evaluable, due to poor DNA quality
No peaks/bands (without background) No (specific) product No rearrangement in Ig/TCR targets detected
One or two reproducible clonal peaks/bandsa Clonalb Clonality detected
One or two non-reproducible (clear) peaks/bandsa Pseudoclonal No clonality detected, suggestive
Multiple (n > 3) non-reproducible peaks/bandsa Pseudoclonal of low template amount
Multiple (n > 3) reproducible peaks/banda,c Multiple products Oligoclonality/multiple clones detected
Gaussian curve/smeard (with or without minor reproducible peaks/bandsa) Polyclonal (not clonald) Polyclonality detected (no clonality detected)
Polyclonality detected plus minor clone of unknown significancee
Pattern that cannot be categorized as one of the above Not evaluablef Not evaluable

Reprinted by permission from Macmillan Publishers Ltd: [Leukemia] Langerak et al. 2012;26:2159-71, [6] copyright (2012).

TCR, T-cell receptor.

a In heteroduplex analysis the number of bands does not necessarily reflect the number of different polymerase chain reaction products, as additional heteroduplexes can be formed between products;

b Clonal peaks/bands are not necessarily seen for every Ig/TCR target analyzed to reach the molecular conclusion ‘clonality detected’;

c For IGK and TCRB loci up to four clonal products may be compatible with one clone;

d In heteroduplex analysis a polyclonal smear may not always be smooth or clear, despite specific product in gel; hence this is scored as ‘not clonal’;

e For those cases in which minor reproducible peaks/bands are detected in the polyclonal background;

f In < 5% of polymerase chain reaction results the description per tube cannot be made.

Table 2.
Common chromosome/gene translocations having diagnostic and clinical implications in mature B- and T-cell lymphoma
Entity Chromosome/Gene translocation Frequency Detection method Implication
Mantle cell lymphoma t(11;14)(q13:q32), CCND1 and IGH > 90% IHC, FISH Diagnostic
Follicular lymphoma t(14;18)(q32:q21), BCL2 and IGH Grade 1, 2: 90% IHC, FISH Diagnostic
t(2;18)(p12:q21), BCL2 and IGK Grade 3a, 3b: < 30%
Burkitt lymphoma t(8;14)(q24:q32), MYC and IGH > 95% FISH Diagnostic
t(2;8)(p12;q24), MYC and IGK
t(8;22)(q24;q11), MYC and IGL
Diffuse large B-cell lymphoma t(8)(q24), MYC ~10% FISH Prognostic (poor)
High-grade B-cell lymphoma with MYC and BCL2 and/or BCL6 rearrangements (double-/triple-hit lymphoma)a t(8)(q24), MYC FISH Diagnostic
t(14;18)(q32:q21), BCL2 and IGH Prognostic (poor)
t(3)(q27), BCL6
MALT lymphoma t(11;18)(q21;q21), API2 and MALTI 5%-20% (stomach) FISH Therapeutic (resistance to Helicobacter pyroii eradication)
30%-50% (lung) RT-PCR
Anaplastic large cell lymphoma, ALK-positive t(2;5)(p23;q35), NPM and ALK t(2;5) 85% IHC, FISH Diagnostic
Variants involving 2p23, ALK Variants 15% Prognostic

IHC, immunohistochemistry; FISH, fluorescence in situ hybridization; MALT, mucosa-associated lymphoid tissue; RT-PCR, reverse transcription polymerase chain reaction; ALK, anaplastic lymphoma kinase.

a Included in the 2016 Revision of World Health Organization classification.

Table 3.
Level I gene list in NGS panel
Genes Purpose of test
Diagnosis Prognosis Selection of drug
11q gain/loss O - -
1P36 deletion O - -
AKT - - O
ALK - - O
BCL2 translocation O - O
BCL6 translocation O - O
BCOR - - O
BIRC3 - O -
BRAF V600E O - -
BTK - - O
Calcineurin - - O
CARD11 - - O
CCND1 rearrangement O - -
CD28 - - O
CD58 - O -
CD79A - - O
CD79B - - O
CDK4 - - O
CDK6 - - O
CHEK1 - - O
CTLA4 - - O
CXCR4 - O O
DDX3X - O -
DUSP22 rearrangement - O -
EZH2 - - O
FYN - - O
GATA3 - O -
IDH2 - O O
IRAK1 - - O
IRAK4 - - O
IRF4 O - -
JAK1 - - O
JAK2 - - O
MAP2K1 - - -
MAPK - - O
MLL2 - - O
MTOR - - O
MYC rearrangement O - O
MYD88 O - O
PI3K - - O
PI3KCD - - O
PKCbeta - - O
RHOA O - O
STAT3 - - O
SYK - - O
TBL1XR1 - - O
TP53 - O -
TP63 rearrangement - O -
VAV1 - - O
XPO1 - O -

NGS, next-generation sequencing.

Table 4.
Level II gene list in NGS panel
ACTB ANKRD11 APC AR1D1A ATM
AURKA AURKB B2M BAP1 BCL10
BCL11B BCL2L2 BCL7A BCORL1 BRCA1
BRCA2 BTG1 CCND2 CCND3 CCNE1
CCR4 CCT6B CD22 CD274 (PDL1) CDK12
CDK8 CDKN1B CDKN2A CDKN2B CDKN2C
CHEK2 CIITA DNMT3A DUSP9 EGFR
EP300 ERG-1 ERK ETS1 ETm1
Em ETm6 FAK FAS (TNFRSF6) FGFR1, 3
FOXO1 FOXO3 FOXP1 GNA13 HDAC1
HDAC4 HDAC7 HIST1H1C HIST1H1D HIST1H1E
HIST1H2AC HIST1H2AG HIST1H2AL HIST1H2AM HIST1H2BC
HIST1H2BJ HIST1H2BK HIST1H2BO HIST1H3B HRAS
ID3 IGH IGK IGL IKBKE
IKKapha IKKbeta IKKgamma IL7R IRF1
IRF8 JAK3 JUN KLHL6 KMT2A (MLL)
KMT2B (MLL2) KMT2C (MLL3) KRAS LEF1 LILRB1
LYN MAF MALT1 MAP2K2 MAP2K4
MAP3K1 MAP3K14 MAP3K6 MAP3K7 MAPK1
MCL1 MDM2 MDM4 MED12 MEF2B
MEF2C MET MUC2 MYCL (MYCL1) MYCN
NF1 NF2 NFAT NFKBIA NORE1
NOTCH 2 NOTCH1 NPM1 NRAS NTRK2
NTRK3 P2RY8 PAX5 PCLO PDCD1 (PD-1)
CD274 (PD-L1) PDCD1LG2 (PD-L2) PDGFRA PDGFRB PIK3CA
PIK3CG PIK3R1 PIK3R2 PIM1 PLCgamma 1
PLCgamma2 POU2F2 PRDM1 PRKD2 PTEN
PTPN1 RAF RASSF1 RB1 RET
RHOT2 RUNX1 SETBP1 SETD2 SF3B1
SF3B1 SFK SGK1 SMAD2 SMAD4
SMARCA1 SMARCA4 SMARCAL1 SMARCB1 SMARCD1
SOCS1 SOCS2 SOCS3 SOX10 SOX2
STAT1 STAT2 STAT4 STAT5A STAT5B
STAT6 TCF3 TCL1A TET1 TET2
TET3 TLL2 TNFAIP3 TNFRSF11A TNFRSF14
TNFRSF17 TRAF2 TRAF3 TRAF5 TSC1
TSC2 TYK2 WIF1 WT1 XBP1
CTNNB1 GSK3B PDK1

NGS, next-generation sequencing.

TOOLS
Similar articles