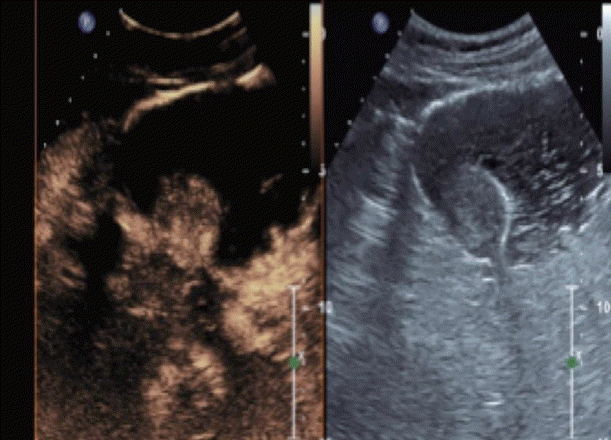
Abstract
The histologic analysis of gastrointestinal stromal tumors (GISTs) is a common method to detect the mitotic activity and to subsequently determine the risk of GISTs for malignancy. The potential false negative error due to inadequate yield of specimens and actual determination of malignancy risk requires analysis of the whole tumor. We aimed to assess the role of contrast enhanced endoscopic ultrasound (CE-EUS) in the management of GISTs. Two authors individually did review of English literatures to identify nine peer-reviewed original articles using keywords- contrast endoscopic ultrasound, GIST and submucosal tumor. Studies were heterogeneous in their aims looking either at differentiating submucosal lesions from GISTs, estimating malignant potential of GISTs with histologic correlation or studying the role of angiogenesis in malignant risk stratification. CE-EUS had moderate to high efficacy in differentiating GISTs from alternative submucosal tumors. CE-EUS had a higher sensitivity than EUS-guided fine needle aspiration, contrast computed tomography and Doppler EUS for detection of neo-vascularity within the GISTs. However, the evidence of abnormal angiogenesis within GIST as a prognostic factor needs further validation. CE-EUS is a non-invasive modality, which can help differentiate GISTs and provide valuable assessment of their perfusion patterns to allow better prediction of their malignant potential but more experience is needed.
Gastrointestinal stromal tumors (GISTs) are mesenchymal tumors originating from interstitial cells of Cajal within the gastrointestinal (GI) tract. They constitute the majority of mesenchymal tumors worldwide with annual incidence of 11–14 per 1,000,000 persons [1,2]. They have variable presentation and many of them are asymptomatic, detected incidentally on routine procedures and imaging. Even though only 10%–30% of these lesions are malignant, all of them have malignant potential [3]. It is important to distinguish GIST from other submucosal tumors and to assess their malignant risk to allow appropriate use of drugs like imatinib, sunitinib and other anti-vascular endothelial growth factor (VEGF) medication as a pre-surgical neo-adjuvant therapy [4]. As a predictive tool, Fletchers classification has been used to determine the risk for malignancy among GIST patients [5]. However, in a pre-operative setting this score has limited utility since whole tumor needs to be resected for determination of mitotic count.
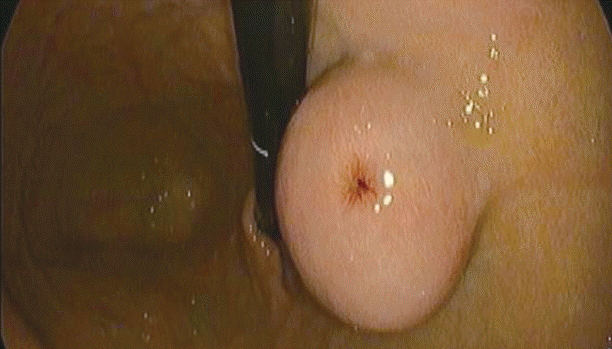
A method of choice for diagnosis, endoscopic ultrasound (EUS) provides good spatial resolution in imaging of upper GI lesions and also guides in acquisition of biopsy specimen. It has been used to distinguish GISTs from submucosal tumors and determine its malignant potential [6]. However, it has a limited role in this regard and is based on subtle differences in the shape, echogenicity and homogeneity [7,8]. Among all the characteristics, abnormal blood vessel have a major role in distinguishing GISTs from other submucosal lesions and also in prediction of malignant risk.
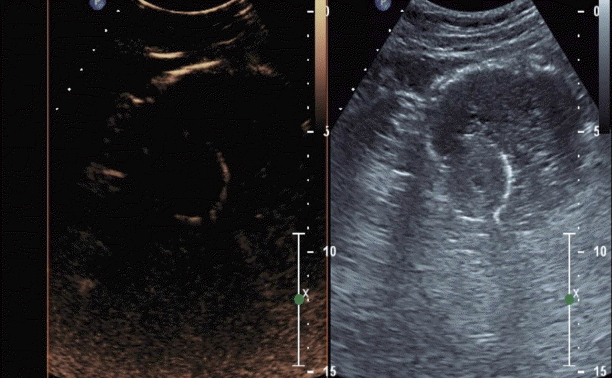
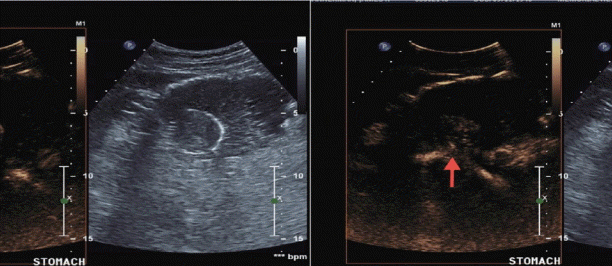
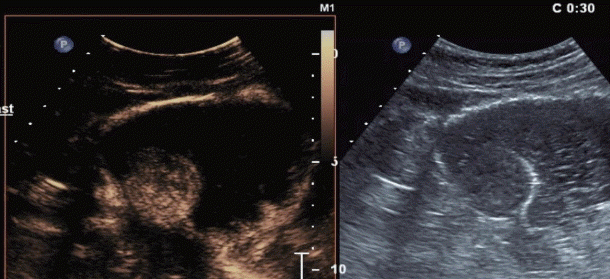
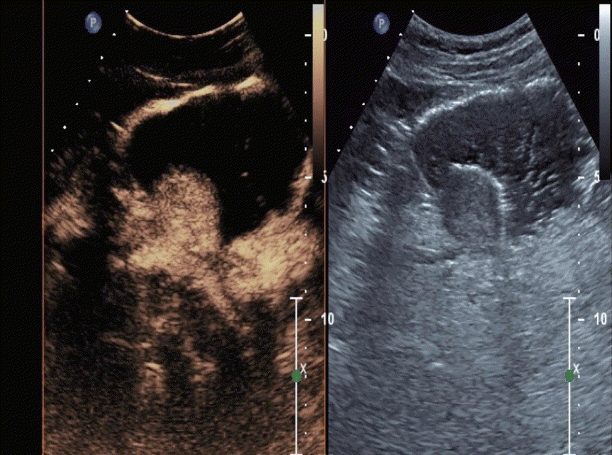
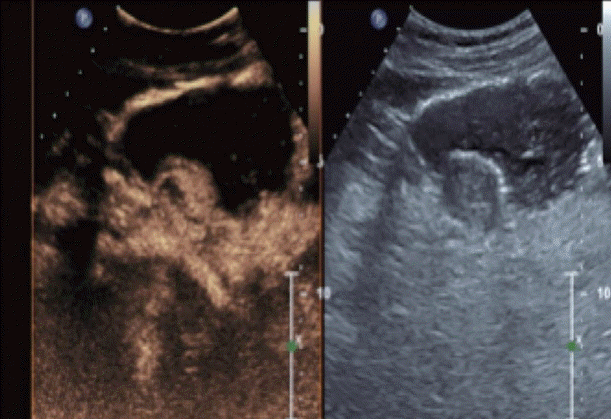
Contrast enhanced harmonic (CEH) imaging has evolved to differentiate GISTs from other submucosal tumors and to assess abnormal angiogenesis within the tumors.
In this article we review the principles of CEH imaging, and evaluate its role in accurate diagnosis of GISTs and prediction of their malignant potential.
CEH imaging is based on nonlinear acoustic response of tissue or micro-bubble to US signal. The nonlinear response means that on insonation, the resultant signals include sum of insonated frequency and integer multiple (n=1,2,3…) of transmitted frequency, known as harmonics. Received signal when twice of transmission frequency is called as second harmonic [9-11]. For example, transmit at 3 Mhz and receive at 6 Mhz. The higher frequency and the one-way travel of returning signal leads to better resolution of final images. Over the past decade, there has been advent of ultrasound transducers with wider bandwidth and optimal acoustic power. This is coupled with contrast agents, which comprises infusion of air filled micro-bubbles surrounded by surface-active substance. On US insonation micro-bubble contracts and relaxes in response to pressure waves. The mechanical index (MI) is a unitless number calculated by dividing the peak negative pressure (MPascal) by the square root of transmission frequency (Mhz). At low MI the micro-bubbles behave linearly, while in medium range (0.1–0.6) they have asymmetrical expansion and at MI >0.6 they have transient nonlinear scattering followed by micro-bubble destruction [9-11]. Thus while tissues have linear response to insonation at low MI, micro-bubbles produce optimal backscattering of acoustic signals and improve detectability of smaller blood vessels [12].
In harmonic imaging common modalities are utilized like:
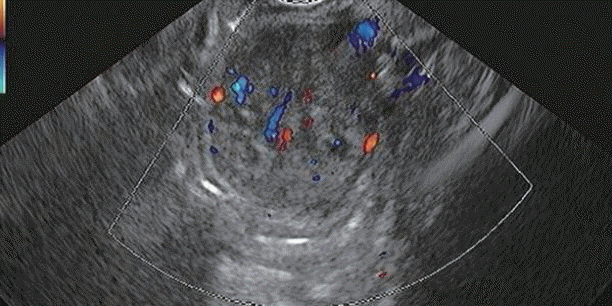
Contrast harmonic Doppler US: It is beneficial in detection of blood flow, depending on fast blood flow within the tumor vessels [13]. It has limited role among smaller blood vessels with slower blood flow and is limited by artifacts like over-painting, blooming and flash artifacts from movement of tissues.
Contrast phase inversion mode: This modality (HITACHI system) includes imaging via 2 waves wherein one is inverted as compared to other and thereby linear response will sum up to zero output. But the nonlinear response of micro-bubbles will not be inverted and will add up to produce intense signals as compared to tissues [12-14]. Despite this the system is not able to filter out the nonlinear response from tissues.
Extended Pure Harmonic Detection: In this system (ALOKA system) the signals from micro-bubbles have higher amplitude and phase shift than those from the tissues. The signals from the tissues are filtered out and the machine receives only the signals from the micro-bubbles in the vasculature [15,16]. This gives an accurate estimate of vascularity even among lesions with vascular supply with slow flow.
Two authors individually did review of English literatures from inception through May, 2017. PubMed and Google scholar were used to identify the peer reviewed original and review articles using keywords- contrast endoscopic ultrasound; GIST; submucosal tumor. The references of pertinent studies were manually searched to identify additional relevant studies. The indication, procedural details, clinical outcomes, complications and limitations were reviewed for each study.
We selected nine original studies to be included in this review article; one of them was a prelim study [16], while rest of them were observational human studies [15,17-23]. Most of the studies are from Asia and Europe and were mostly retrospective and observational. The studies aimed at differentiating submucosal lesions from GISTs [18,19,23], estimating malignant potential of GISTs with histologic correlation [17,20,22,23] and studying the role of angiogenesis in malignant risk stratification [21,22].
A study by Kitano et al. revealed the utility of prototype curved endoscope with wide bandwidth transducer in visualization of GI organs post intravenous contrast infusion among in vivo experimental dog subjects (n=12) and evaluation of vascular defects artificially created with radiofrequency ablation in pancreatic tissue (n=6) along with histologic correlation [16]. This was also clinically applied to 2 human patients one of whom had GIST lesion revealing diffuse blood vessels.
Eight observational human studies included a total of 175 GIST patients [15,17-23]. There was symmetric gender distribution (Male-60 vs. Female-65) among six studies [17-23]. While the inclusion criteria was suspected submucosal lesion and suspected or histologically proven GISTs, the exclusion criteria included morphologic confounders like esophageal varices, extrinsic compressions, lipomas, cysts and/or adenocarcinomas on histology post resection [20]. It also included demographic characters i.e. age <18 years, pregnancy, lactation, severe heart failure, severe chronic obstructive lung disease, or, known allergic disposition [17,19].
All the studies included routine EUS for localization of sub-epithelial lesions and injecting second-generation contrast agents to define the lesions. The study by Kitano et al. investigated the role of CEH-EUS in perfusion imaging of pancreatic lesions (n=27; lesions=32) [16]. It initially delineated optimal settings for imaging resulting in MI of 0.4 and frame interval of 2 seconds in intermittent imaging and 0.6 MHz in continuous imaging. Furthermore 2 GIST lesions were visualized to reveal diffuse rich vascularity on real time imaging. The image settings and contrast agents utilized are described in the Table 1. The images were obtained in the early arterial phase post injection of contrast material. The sub-epithelial lesions were characterized mostly on the basis of their size and localization of abnormal intra-tumor vessels and additional factors such as necrotic center. They underwent histologic review post acquisition via EUS-guided fine needle aspiration (FNA), trucut biopsy and/or surgical resection. Histologic review were analyzed mostly via hematoxylin and eosin stain while immune-histo-chemisty for C-kit, DESMIN, S-100, CD-34 and DOG was done in certain studies [21]. Only 2 studies utilized marker for angiogenesis (factor VIII and VEGF) for histologic correlation of abnormal vascular structures appreciated in contrast EUS studies [21,22].
This has been discreetly mentioned only in a few manuscripts and the time for the procedure was not significantly increased due to additional perfusion studies [22].
The study outcomes included accuracy in distinguishing GISTs from submucosal tumor, grading the malignant risk of GIST lesions and histologic correlation of abnormal angiogenesis. The sensitivity and specificity of CEH-EUS in differentiating GISTS from subepithelial tumors ranged from 53.8% to 100% [18,19,23]. In differentiating low-grade from high-grade malignancy, the range of sensitivity, specificity and accuracy were 75%–100%, 63%–100% and 83%–98% respectively [17,20,23]. Yamashita et al. investigated role of visualization of abnormal intra-tumor blood vessel on CEH-EUS and found significant correlation with VEGF expression (p<0.005) [22]. There was also higher proportion of high-grade malignancy in CEH-EUS positive for neovascularization, which on histologic review revealed large vessels deficient in elastic fibers. Fukuta et al. compared vessel density (vessel count/mm2) among “Poor” (11.0 +/– 1.6/mm2) and “Rich” pattern GISTs (26.7 +/– 3.7/mm2) as visualized on contrast EUS and found significant difference (p<0.01) [21]. In the study by Park et al., the non-enhancing spots were significantly higher among high-grade malignancy as compared to low-grade malignancy (p<0.022) and there was no significant difference in the presence of irregular vessels or heterogeneous perfusion on CEH-EUS [23]. Besides the above, presence of a necrotic center, avascular core and contrast agent arrival time (AAT) were also investigated [18,20]. Sakamoto et al. reported the presence of necrotic center within the lesion as a marker for high-grade malignant lesion (p<0.05) [20]. Contrast AAT was significantly different in GIST as compared to benign lesions per Kannengiesser et al., but it had no role in differentiating benign from malignant lesions [17,19].
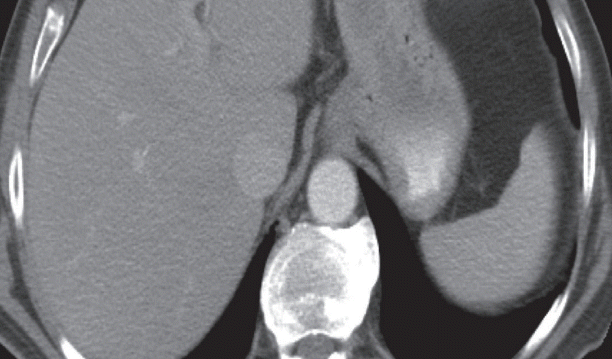
CEH-EUS was compared with other modalities in few studies [20,21]. Contrast enhanced computed tomography (CT) failed to demonstrate any neovascularization in study by Fukuta et al. [21] Its sensitivity for detection of blood vessels was 0% in small lesions (<3 cm) and 42% in in large lesions (>3 cm) in the study by Sakamoto et al. [20] In this study EUS-FNA was demonstrated to have sensitivity, specificity and overall accuracy of 92%, 62% and 81% for diagnosis of high-grade malignancy against that of CEH-EUS -100%, 63% and 83%, respectively. Sensitivities with which CEH-EUS and contrast enhanced-CT detected intra-tumor vessels in smaller (<3 cm) high-grade malignancy GISTs were 25%, and 0%, respectively, whereas those values for larger (>3 cm) high-grade malignancy GISTs were 75%, and 42%, respectively.
In conclusion contrast enhanced EUS is a non-invasive modality with valuable assessment of perfusion patterns of GISTs and submucosal tumors. It has a higher sensitivity than EUS–FNA, contrast CT and Doppler EUS for detection of neo-vascularity. The evidence of abnormal angiogenesis within GISTs as a prognostic factor however needs to be evaluated with prospective studies with greater sample size and follow-up periods.
REFERENCES
1. Kim KM, Kang DW, Moon WS, et al. Gastrointestinal stromal tumors in Koreans: it’s incidence and the clinical, pathologic and immunohistochemical findings. J Korean Med Sci. 2005; 20:977–984.
2. Goettsch WG, Bos SD, Breekveldt-Postma N, Casparie M, Herings RM, Hogendoorn PC. Incidence of gastrointestinal stromal tumours is underestimated: results of a nation-wide study. Eur J Cancer. 2005; 41:2868–2872.
3. Croom KF, Perry CM. Imatinib mesylate: in the treatment of gastrointestinal stromal tumours. Drugs. 2003; 63:513–522. discussion 523-524.
4. Rammohan A, Sathyanesan J, Rajendran K, et al. A gist of gastrointestinal stromal tumors: a review. World J Gastrointest Oncol. 2013; 5:102–112.
5. Fletcher CD, Berman JJ, Corless C, et al. Diagnosis of gastrointestinal stromal tumors: a consensus approach. Int J Surg Pathol. 2002; 10:81–89.
6. Chak A, Canto MI, Rösch T, et al. Endosonographic differentiation of benign and malignant stromal cell tumors. Gastrointest Endosc. 1997; 45:468–473.
7. Kim GH, Kim KB, Lee SH, et al. Digital image analysis of endoscopic ultrasonography is helpful in diagnosing gastric mesenchymal tumors. BMC Gastroenterol. 2014; 14:7.
8. Kim GH, Park DY, Kim S, et al. Is it possible to differentiate gastric GISTs from gastric leiomyomas by EUS? World J Gastroenterol. 2009; 15:3376–3381.
9. Desser TS, Jeffrey RB. Tissue harmonic imaging techniques: physical principles and clinical applications. Semin Ultrasound CT MR. 2001; 22:1–10.
10. Kollmann C. New sonographic techniques for harmonic imaging--underlying physical principles. Eur J Radiol. 2007; 64:164–172.
11. Sanchez MV, Varadarajulu S, Napoleon B. EUS contrast agents: what is available, how do they work, and are they effective? Gastrointest Endosc. 2009; 69(2 Suppl):S71–S77.
12. Săftoiu A, Dietrich CF, Vilmann P. Contrast-enhanced harmonic endoscopic ultrasound. Endoscopy. 2012; 44:612–617.
13. Wilson SR, Greenbaum LD, Goldberg BB. Contrast-enhanced ultrasound: what is the evidence and what are the obstacles? AJR Am J Roentgenol. 2009; 193:55–60.
14. Unnikrishnan S, Klibanov AL. Microbubbles as ultrasound contrast agents for molecular imaging: preparation and application. AJR Am J Roentgenol. 2012; 199:292–299.
15. Kitano M, Sakamoto H, Matsui U, et al. A novel perfusion imaging technique of the pancreas: contrast-enhanced harmonic EUS (with video). Gastrointest Endosc. 2008; 67:141–150.
16. Kitano M, Kudo M, Sakamoto H, et al. Preliminary study of contrast-enhanced harmonic endosonography with second-generation contrast agents. J Med Ultrason (2001). 2008; 35:11–18.
17. Zhao Y, Qian L, Li P, Zhang S. The diagnostic value of endoscopic ultrasonography and contrast-enhanced harmonic endoscopic ultrasonography in gastrointestinal stromal tumors. Endosc Ultrasound. 2016; 5:111–117.
18. Ignee A, Jenssen C, Hocke M, et al. Contrast-enhanced (endoscopic) ultrasound and endoscopic ultrasound elastography in gastrointestinal stromal tumors. Endosc Ultrasound. 2017; 6:55–60.
19. Kannengiesser K, Mahlke R, Petersen F, et al. Contrast-enhanced harmonic endoscopic ultrasound is able to discriminate benign submucosal lesions from gastrointestinal stromal tumors. Scand J Gastroenterol. 2012; 47:1515–1520.
20. Sakamoto H, Kitano M, Matsui S, et al. Estimation of malignant potential of GI stromal tumors by contrast-enhanced harmonic EUS (with videos). Gastrointest Endosc. 2011; 73:227–237.
21. Fukuta N, Kitano M, Maekawa K, Chikugo T, Kudo M. Estimation of the malignant potential of gastrointestinal stromal tumors: the value of contrast-enhanced coded phase-inversion harmonics US. J Gastroenterol. 2005; 40:247–255.
Table 1.
Study | Aim of study | Number of subjects | Gender distribution | Mean age (yr) | Location of lesion | Diameter of lesion | Diagnostic modality | Contrast agent | Diagnostic test performance | Complication |
---|---|---|---|---|---|---|---|---|---|---|
Kitano et al. (2008) [15], Japan | Prelim study | Human- 2 | N/A | N/A | N/A | N/A | Imaging mode: extended pure harmonic detection mode | Sonovue (2 mL) | Visualization of 2 GIST with rich vasculature | None |
Mechanical index: 0.4 | ||||||||||
Frequency: 6 Hz | ||||||||||
Kitano et al. (2008) [16], Germany and Japan | Prelim study | Animal (Dog)- 12 Humans- 2 (GIST- 1, pancreatic cancer- 1) | N/A | N/A | N/A | N/A | Imaging mode: extended pure harmonic detection mode | Definity Sonovue (2mL) | Visualization of 1 GIST lesion with rich vasculature | None |
Mechanical index: 0.35-0.40 | ||||||||||
Frequency: 7.5 MHz | ||||||||||
Zhao et al. (2016) [17], China | - Grade malignant potential | Human-18 | 1. Very Low grade and low grade- | 1. Very Low-grade and low-grade-51.5±10.0 | 1. Gastric-18 | 1. Very Low-grade and low-grade-14.6±5.8 mm | Imaging mode: extended pure harmonic detection mode | Sonovue (59 mg/5 mL) | Grade malignant potential: | None |
M- 6 | 2. Intermediate and high-grade-58.9±14.1 | 2. Intermediate and high-grade-33.4±10.6 mm | Mechanical index: 0.25 | Hyper-enhancement onCEH-EUS: | ||||||
F- 4 | Frequency: 4.7 MHz | 1. Sensitivity- 75% | ||||||||
2. Intermediate and high grade- | 2. Specificity-100% | |||||||||
M-5 | 3. PPV- 33% | |||||||||
F-3 | 4.NPV-100% | |||||||||
Ignee et al. (2017) [18], Romania, China and Germany | - Differentiation of GIST from SMT | Human- 57 | N/A | N/A | 1. Gastric- 39 | N/A | Imaging mode: extended pure harmonic detection mode | Sonovue (4.5 mL) | Differentiation of GIST from SMT: | None |
2. Intestine- 17 | hyper-enhancement on CEH-EUS: | |||||||||
3. Extra-intestinal- 1 | 1. Sensitivity- 98% | |||||||||
2. Specificity-100% | ||||||||||
3. PPV-100% | ||||||||||
4.NPV-93% | ||||||||||
5. Accuracy- 98% | ||||||||||
Kannengiesser et al. (2012) [19], Germany | - Differentiation of GIST from SMT | Human-17 | M-9 | 69±12.0 | N/A | 1. GIST-25.4±18.6 mm | Imaging mode: extended pure harmonic detection mode | Sonovue (2 mL) | Differentiation of GIST from SMT: | 1. Bleeding- |
F-8 | 2. Benign lesions-23.8±7.5 mm | Hyper-enhanced lesion-100% accuracy | a) Spontaneous-1 | |||||||
b) Secondary to biopsy- 5 | ||||||||||
Sakamoto et al. (2011) [20], Japan | - Grade malignant potential | Human-29 | 1. Low-grade- | 1. Low grade-61.7 | 1. Low-grade-stomach- 11 duodenum- 2 | 1. Low-grade-2.9±2.1 cm (range, 1.1-5) | Imaging mode: extended pure harmonic detection mode | Sonazoid (15 μL/kg) | Grade malignant potential: | 1. Bleeding-a) Secondary to fine needle aspiration-1 |
- Differentiation of GIST from SMT | M- 6 | 2. High grade-64.5 | 2. High-grade-stomach- 11 duodenum- 5 | |||||||
F-7 | 2. High-grade-3.2±2.5 cm (range, 2-12.1) | Mechanical index: | abnormal vessel visualization | |||||||
2. High-grade- | Frequency: 4.7 MHz | |||||||||
M- 6 | 1. Sensitivity- 100% | |||||||||
F-10 | 2. Specificity- 63% | |||||||||
3. Accuracy- 83% | ||||||||||
Fukuta et al. (2005) [21], Japan | - Histologic correlation of perfusion imaging | Human- 0 | M-4 | 64.7 | 1. Gastric- 8 | N/A | Imaging mode: contrast enhanced coded phase inversion harmonic US | Levovist (2-5 g) | Histologic correlation of perfusion imaging: | None |
- Grade malignant potential | F-9 | 2. Duodenum- 3 | Mechanical index: 0.6-0.8 | Vessel density: | ||||||
3. Jejunum-1 | Frequency: 2-4 Hz | 11.0 +/- 1.6/mm2poor versus 26.7 +/- 3.7/mm2 (p<0.0l) | ||||||||
4. Ileum-1 | Grade malignant potential: | |||||||||
NPV-100% | ||||||||||
PPV- 87.5% | ||||||||||
Yamashita et al. (2015) [22], Japan | - Histologic correlation of perfusion imaging | Human-13 | M- 6 | 68.2 | 1. Gastric-12 | 3.0 cm (range, 1.3-11) | Imaging mode: extended pure harmonic detection mode | Sonazoid (0.7 mL) | Histologic correlation of perfusion imaging: | None |
- Grade malignant potential | F-7 | 2. Duodenal-1 | Mechanical index: 0.35 | abnormal perfusion image correlation with histology and VEGF expression (p=0.005) | ||||||
Frequency: 4.7 MHz | Grade malignant potential: | |||||||||
NPV-100% | ||||||||||
PPV- 83.3% (p=0.005) | ||||||||||
Park et al. (2016) [23], Korea | - Grade malignant potential | Human- 35 | M-18 | 56.9±11.9 | 1. Esophagus- 3 | 32.5±12.5 mm | Imaging mode: extended pure harmonic detection mode | Sonovue (2.4 mL) | Grade malignant potential: | None |
- Differentiation of GIST from SMT | GIST- 26 | F-17 | 2. Gastric- 26 | Mechanical index: 0.17 | Sensitivity-18.2% | |||||
3. Duodenum- 3 | Specificity- 73.3% | |||||||||
4. Rectum- 3 | PPV- 33.3% | |||||||||
NPV- 55.0% | ||||||||||
Accuracy- 42.9% | ||||||||||
Differentiation of GIST from S.E.L.: | ||||||||||
Sensitivity- 23.1% | ||||||||||
Specificity-100% | ||||||||||
PPV-100% | ||||||||||
NPV- 55.0% | ||||||||||
Accuracy- 50.0% |