Abstract
Background/Aims
Chronic liquid and/or food stasis caused by retention esophagitis (RE) in achalasia is a notable endoscopic finding because of the presence of a thickened or whitish esophageal mucosa and histologically altered squamous hyperplasia. We aimed to identify the clinical features of RE associated with achalasia and to clarify the clinical definition of RE in achalasia as a precancerous lesion identified by analyzing biomarker expressions.
Methods
From 2006 to 2015, we retrospectively reviewed 37 patients with achalasia without previous treatment. Among them, 21 patients had diagnostic findings of RE (RE+) and 16 patients had no diagnostic findings of RE (RE–). Immunohistochemical staining of p53, p16, and Ki-67 was performed on the endoscopic biopsy tissues from the patients with achalasia and 10 control patients with non-obstructive dysphagia.
Results
The symptom duration and transit delay were significantly longer in the RE+ group than in the RE– group. We found particularly high p53 positivity rates in the RE+ group (p<0.001). The rate of p16 expression was also significantly higher in the RE+ group than in the other two groups (p=0.003).
Achalasia is a primary esophageal motility disorder of unknown etiology, characterized by an insufficient relaxation of the lower esophageal sphincter and loss of esophageal peristalsis [1]. The classic symptoms of achalasia consist of dysphagia for both solids and liquids, regurgitation of undigested food or saliva, respiratory symptoms (nocturnal cough, recurrent aspiration, and pneumonia), chest pain, and weight loss [2,3]. Achalasia is thought to be a premalignant lesion associated with an increased risk of esophageal cancer [4]. The risk of esophageal cancer in patients with achalasia ranges between 10 and 50 times that in the general population [5-7].
Increased bacterial growth and chemical irritation from the continuous retention of food and saliva in patients with achalasia can induce chronic hyperplastic esophagitis, mucosal dysplasia, and eventually, malignant transformation of the esophageal epithelial cells [8]. Chronic retention of food and saliva leads to esophagitis, which can sometimes be observed on endoscopic findings with the presence of mucosal thickening, nodularity, or cobblestone-like appearance of the mucosa and whitish discoloration [8,9]. The inflammatory changes found in the distal part of the esophagus of patients with achalasia are what physicians refer to as retention esophagitis (RE) [10,11]. There have been recent increases in the amount of available data regarding the morphologic alterations that occur during primary achalasia; these data indicate that alterations in the squamous mucosa are uniformly observed [12,13]. The inflammatory squamous mucosa associated with end-stage achalasia appears significantly altered, including marked squamous hyperplasia and increased frequency of p53 immunoreactivity [14]. These changes may be related to an increased risk for esophageal cancer. Although RE in patients with achalasia should be considered as a precancerous stage of esophageal cancer, there have been few reports regarding endoscopic and histologic diagnoses of RE.
Therefore, we aimed to analyze the endoscopic and histologic features of RE in patients with achalasia and clarify the clinical meaning of RE as a precancerous lesion based on analyses of two tumor suppressor genes, p53 and p16, and a proliferation marker, Ki-67.
A total of 88 patients with achalasia underwent esophagogastroduodenoscopy (EGD) at Gangnam Severance Hospital between January 2006 and June 2015. Achalasia was diagnosed on the basis of the results of EGD, followed by barium esophagography and manometry. Excluding patients who underwent previous treatment for achalasia, we retrospectively reviewed 37 patients who had undergone histologic examination at the initial endoscopy. EGD was conducted using a high-definition white-light video endoscope (GIFH260Z; Olympus medical systems, Tokyo, Japan). Following endoscopic observation, the biopsy specimens were obtained within 5 cm above the esophagogastric junction. Each specimen was fixed in 10% formalin and embedded in paraffin wax.
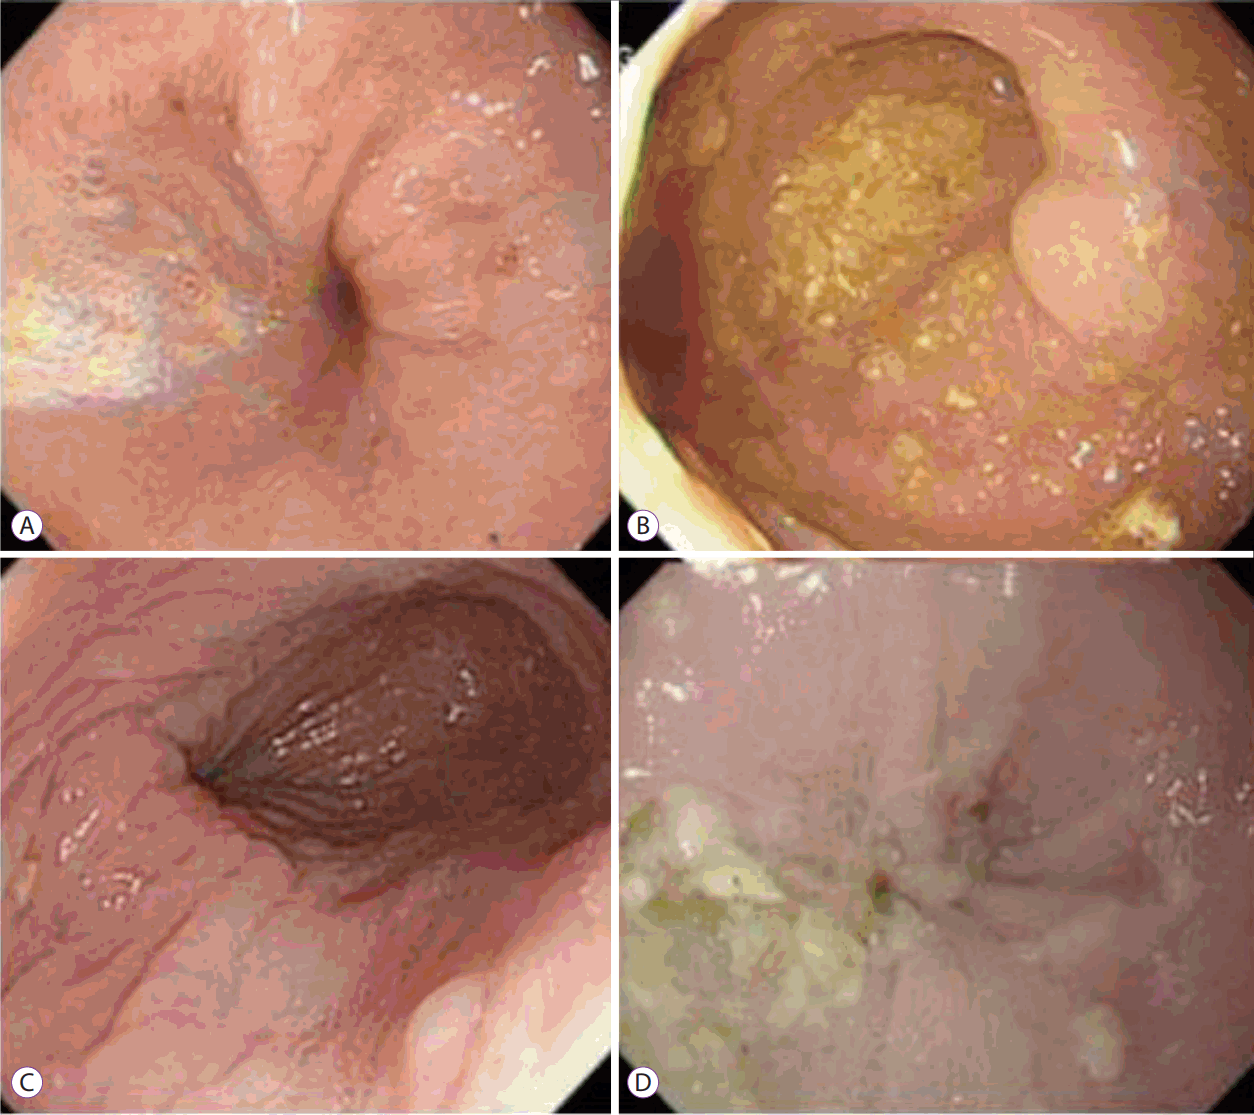
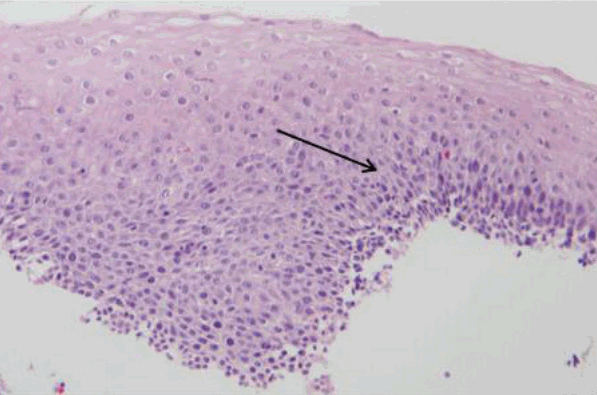
All endoscopic images of the patients with achalasia were reviewed by an experienced endoscopist (HP) who had particular experience treating esophageal motility diseases. Using the Descriptive Rules for Achalasia of the Esophagus that were published by the Japan Society of Esophageal Diseases in 2012 (Fig. 1), we considered the endoscopic findings of RE, i.e., abnormal liquid and/or food retention or thickened and whitish changes in the mucosal surface of the esophagus at endoscopy [15]. Histologic review was performed by two experienced gastrointestinal pathologists. They reviewed the tissues from which sufficient specimens were obtained. In all cases, hematoxylin and eosin-stained slides were reviewed to confirm the diagnosis and to evaluate the presence or absence of morphologic alterations in the esophageal squamous mucosa. Inflammatory epithelia (esophagitis) were identified by the presence of squamous hyperplasia in the mucosal layer (Fig. 2).
We diagnosed RE when both of the following findings were present: (1) endoscopically observed food or liquid/foam stasis or thickened and whitish color changes in the esophagus mucosa and (2) histologically confirmed esophageal squamous hyperplasia. To evaluate retention severity, we classified retention into the following grades: grade 0 = no retention, grade I = foam, grade II = liquid, and grade III = food.
To serve as controls, we included patients who had undergone random esophageal biopsy for the evaluation of non-obstructive dysphagia during the study period (January 2006 to June 2015). Excluding patients with specific esophagitis (viral, reflux, or eosinophilic etc.), 10 patients were evaluated as the control group.
This study was approved by the ethics committee of Gangnam Severance Hospital, and written informed consent was obtained from all subjects.
Immunohistochemical (IHC) staining was performed on 35 patients with achalasia (after excluding two empty or inaccessible specimens) and 10 control patients. IHC staining for p53 (sc-126, dilution 1:50; Santa Cruz Biotechnology, Dallas, TX, USA), p16 (5A8A4, dilution 1:1,000; Thermo Fisher Scientific, Waltham, MA, USA), and Ki-67 (ab15580, dilution 1:1,000; Abcam®, Cambridge, UK) was performed using the Novolink Polymer Detection System (Leica Biosystems, Richmond, IL, USA) according to the manufacturer’s instructions. p53, p16, and Ki-67 with immunostaining in ≥15% of cells were considered positive (Supplementary Fig. 1). The degree of overexpression was classified as follows: negative, <15%; moderate positive, 15%–40%; and strong positive, >40% [16,17].
The Chi-square and Fisher’s exact tests were used to evaluate associations among various categorical variables and Student’s t-test, among non-categorical variables. All analyses were conducted using SPSS version 20.0 for Windows (SPSS, Chicago, IL, USA), and p-value <0.05 was considered statistically significant.
Among the 37 patients with esophageal achalasia in this study (male:female sex = 15:22), the mean age at diagnosis was 42.0±15.9 years (mean±standard deviation). Twenty-eight patients had endoscopic findings of retention in the esophagus; however, seven of these patients did not have squamous hyperplasia in the esophagus mucosa. These seven patients without squamous hyperplasia were included in the non-RE achalasia group. Ultimately, 21 patients had diagnostic findings of RE (RE+), and 16 patients had no diagnostic findings of RE (RE–). Table 1 shows the clinical features of all enrolled patients with achalasia. The mean symptom duration was longer in the RE+ group than in the RE– group (54.9±75.8 months vs. 39.3±38.7 months, respectively, p=0.008). The RE+ group showed food stasis in the esophagus lumen more often than did the RE– group. Additionally, the RE+ group had significantly longer transit delays on esophageal transit scintigraphy than did the RE– group (R30 = 48.8%±21.3% vs. 43.2%±30.6%, respectively, p=0.003).
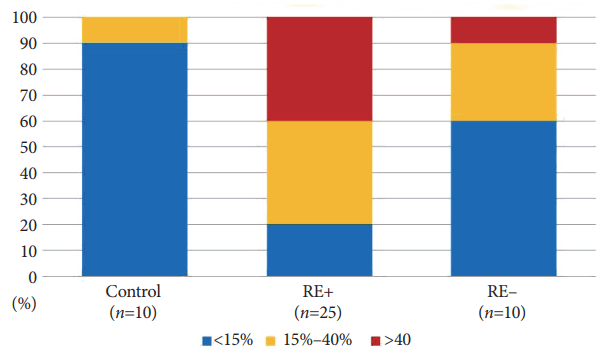
There was a significantly greater frequency of p53 immunoreactivity in the RE+ group than in the control and the RE– groups (Table 2). Further, we also observed significantly higher levels of p53 expression (>40%) in the RE+ group than in the other two groups (Table 3, Fig. 3). In the post hoc analysis, the RE+ group vs. control group and RE+ control vs. RE–group showed statistical significances (Tables 2, 3).
p16 expression was available in 33 of the 37 patients with achalasia and in 10 control patients. On p16 staining, four achalasia samples were excluded owing to inaccessible background staining. The incidence of positive p16 expression was significantly higher in the RE+ group than in the other two groups (Table 4). However, the degree of overexpression was not statistically significant (data not shown).
Table 5 shows the Ki-67 protein expression profiles for the enrolled samples. There was no significant difference in the Ki-67 expression among the RE+, RE–, and control groups.
Patients with achalasia have a significantly increased risk of developing esophageal cancer [4,18]. Achalasia-associated esophageal cancer may arise as a result of chronic food stasis, leading to chronic inflammation, epithelial hyperplasia, and multi-focal dysplasia [18]. Although many studies suggest that chronic food and saliva stasis in achalasia may lead to esophageal cancer, only a few reports have analyzed achalasia-associated “retention” esophagitis [9,10,19].
Herein, we analyzed the endoscopic and histologic findings in patients with achalasia according to the presence or absence of RE. We defined RE on the basis of both endoscopic and histologic features, such as abnormal liquid and/or food retention in the esophagus or thickening and whitish changes in the mucosal surface and histological squamous hyperplasia in the esophageal mucosa. Several previous studies have reported that the squamous mucosa from esophagectomy specimens that were obtained from patients with end-stage achalasia showed evidence of gastroesophageal reflux disease, which is characterized by the presence of marked and diffuse squamous hyperplasia with papillomatosis and basal cell hyperplasia [13,14,20]. On the basis of these data, we defined achalasia-associated RE from the histological findings based on evidence of squamous hyperplasia in the mucosal layer. These inflammatory changes in the esophageal mucosa may be triggered by continuous retention of food and saliva.
We found that patients with achalasia and RE experienced significantly longer symptom durations. Furthermore, the esophageal mucosal tissues from the RE+ group had higher positive rates of p53 and p16 expression than those from the RE– and control groups. These results suggest that long-standing achalasia with RE may be related to an increased risk of esophageal cancer. Leeuwenburgh et al. [16] reported that overexpression of the tumor suppressor gene p53 was a predictor for the development of esophageal cancer in patients with achalasia. Additionally, p16 was found to be a key regulator at the G1-S checkpoint in the cell cycle, and functional alterations in its expression may be important in carcinogenesis [21]. Nowadays, with the introduction of high-resolution endoscopy and chromoendoscopy with Lugol’s staining, the detection sensitivity for premalignant lesions has improved significantly [22]. Therefore, we suggest that patients with RE+ undergo more intensive endoscopic surveillance with shorter intervals to detect malignant changes in the esophageal mucosa.
Our study had several limitations. First, we only analyzed patients who underwent endoscopic biopsy; thus, we had a selection bias. Second, the sample size of each group and tissue amount were too small. A large-scale prospective study is needed to validate the precancerous risks found to be associated with RE in patients with achalasia. Nevertheless, this study is the first study to suggest that endoscopic and histologic diagnoses of RE are important for cancer prediction and is also the first to clarify the clinical significance of RE as a precancerous lesion through IHC staining of biomarkers.
In conclusion, RE could be an important endoscopic and histologic feature of achalasia, which may help physicians predict esophageal cancer risk in patients with achalasia. Therefore, patients with achalasia and RE should undergo more intensive surveillance in shorter intervals to detect malignant transformations.
Supplementary Material
Supplemental Fig. S1.
Immunohistochemical analysis of p53, p16, and Ki-67 in the squamous mucosa from a patient with retention esophagitis. (A) Nuclear p53 immunoreactive cells (×400). (B) p16 immunoreactive cells (×200). (C) Ki-67 immunoreactive cells (×200).
REFERENCES
1. Moonen A, Boeckxstaens G. Current diagnosis and management of achalasia. J Clin Gastroenterol. 2014; 48:484–490.

2. Vaezi MF, Pandolfino JE, Vela MF. ACG clinical guideline: diagnosis and management of achalasia. Am J Gastroenterol. 2013; 108:1238–1249. quiz 1250.

3. Ates F, Vaezi MF. The pathogenesis and management of achalasia: current status and future directions. Gut Liver. 2015; 9:449–463.

5. Streitz JM Jr, Ellis FH Jr, Gibb SP, Heatley GM. Achalasia and squamous cell carcinoma of the esophagus: analysis of 241 patients. Ann Thorac Surg. 1995; 59:1604–1609.

6. Dunaway PM, Wong RK. Risk and surveillance intervals for squamous cell carcinoma in achalasia. Gastrointest Endosc Clin N Am. 2001; 11:425–434. ix.

7. Leeuwenburgh I, Scholten P, Alderliesten J, et al. Long-term esophageal cancer risk in patients with primary achalasia: a prospective study. Am J Gastroenterol. 2010; 105:2144–2149.

8. Chino O, Kijima H, Shimada H, et al. Clinicopathological studies of esophageal carcinoma in achalasia: analyses of carcinogenesis using histological and immunohistochemical procedures. Anticancer Res. 2000; 20:3717–3722.
9. Shields TW, LoCicero J 3rd, Reed CE, Feins RH. General thoracic surgery. 7th ed. Philadelphia (PA): Lippincott Williams & Wilkins;2009.
10. Crookes PF, Corkill S, DeMeester TR. Gastroesophageal reflux in achalasia. When is reflux really reflux? Dig Dis Sci. 1997; 42:1354–1361.

11. Kiraly A, Illés A, Undi S, Varga G, Kalmár K, Horváth PO. Gastroesophageal reflux disease progressing to achalasia. Dis Esophagus. 2005; 18:355–358.
12. Goldblum JR, Rice TW, Richter JE. Histopathologic features in esophagomyotomy specimens from patients with achalasia. Gastroenterology. 1996; 111:648–654.

13. Goldblum JR, Whyte RI, Orringer MB, Appelman HD. Achalasia. A morphologic study of 42 resected specimens. Am J Surg Pathol. 1994; 18:327–337.
14. Lehman MB, Clark SB, Ormsby AH, Rice TW, Richter JE, Goldblum JR. Squamous mucosal alterations in esophagectomy specimens from patients with end-stage achalasia. Am J Surg Pathol. 2001; 25:1413–1418.

15. Minami H, Isomoto H, Miuma S, et al. New endoscopic indicator of esophageal achalasia: “pinstripe pattern”. PLoS One. 2015; 10:e0101833.

16. Leeuwenburgh I, Gerrits MM, Capello A, et al. Expression of p53 as predictor for the development of esophageal cancer in achalasia patients. Dis Esophagus. 2010; 23:506–511.
17. Sikkema M, Kerkhof M, Steyerberg EW, et al. Aneuploidy and overexpression of Ki67 and p53 as markers for neoplastic progression in Barrett’s esophagus: a case-control study. Am J Gastroenterol. 2009; 104:2673–2680.

18. Meijssen MA, Tilanus HW, van Blankenstein M, Hop WC, Ong GL. Achalasia complicated by oesophageal squamous cell carcinoma: a prospective study in 195 patients. Gut. 1992; 33:155–158.

Fig. 1.
Endoscopic diagnostic findings for retention esophagitis. (A) Liquid/foam stasis with mucosal thickening. (B) Food stasis with mucosal thickening. (C) Mucosal thickening. (D) Whitish change with food stasis.

Fig. 2.
Histologic findings of retention esophagitis (arrow, squamous hyperplasia, hematoxylin and eosin stain, ×200).

Fig. 3.
Level of p53 expression in retention esophagitis by study group. RE+, patients had diagnostic findings of retention esophagitis; RE–, patients had no diagnostic findings of retention esophagitis.

Table 1.
Comparison of Clinical Features between RE+ and RE– Patients
| RE+ (n=21) (n, %) | RE– (n=16) (n, %) | p-value | |
|---|---|---|---|
| Age at diagnosis (mean±SD, yr) | 42.4±14.2 | 41.5±18.3 | 0.872 |
| Sex (M:F) | 1:1.3 | 1:1.6 | 0.505 |
| Main symptom | |||
| Dysphagia | 10 (47.6) | 9 (56.2) | 0.825 |
| Regurgitation | 10 (47.6) | 6 (37.5) | |
| Chest pain | 1 (4.8) | 1 (6.2) | |
| Duration of symptoms (mean±SD, mo) | 54.9±75.8 | 39.3±38.7 | 0.008 |
| Grade of retention (n, %) | |||
| Grade 0: no retention | 0 (0.0) | 9 (56.2) | <0.001 |
| Grade I: foam | 3 (14.3) | 4 (25.0) | |
| Grade II: liquid | 8 (38.1) | 3 (18.8) | |
| Grade III: food | 10 (47.6) | 0 (0.0) | |
| Eckardt score (mean±SD) | 6.7±2.5 | 5.6±2.3 | 0.481 |
| Achalasia typea) (n, %) | |||
| I | 5 (38.5) | 4 (44.4) | 0.506 |
| II | 7 (53.8) | 3 (33.3) | |
| III | 1 (7.7) | 2 (22.2) | |
| LES pressure in HRM (IRP, mm Hg) | 25.3±15.8 | 19.2±12.5 | 0.290 |
| ETS R30b) (%) | 48.8±21.3 | 43.2±30.6 | 0.003 |
| Progression of maligancy | 0 (0.0) | 0 (0.0) | - |
Table 2.
p53 Protein Expression Profiles
| RE+ (n=25) (n, %) | RE– (n=10) (n, %) | Control (n=10) (n, %) | p-value | |
|---|---|---|---|---|
| Negative | 5 (20.0) | 6 (60.0) | 9 (90.0) | |
| Positive | 20 (80.0) | 4 (40.0) | 1 (10.0) | <0.001a) |
Table 3.
Degree of p53 Protein Expression Positivity
| RE+ (n=25) (n, %) | RE– (n=10) (n, %) | Control (n=10) (n, %) | p-value | |
|---|---|---|---|---|
| Negative (<15%) | 5 (20.0) | 6 (60.0) | 9 (90.0) | |
| 15%–40% | 10 (40.0) | 3 (30.0) | 1 (10.0) | <0.001a) |
| >40% | 10 (40.0) | 1 (10.0) | 0 (0.0) |
Table 4.
p16 Protein Expression Profiles
| RE+ (n=23) (n, %) | RE– (n=10) (n, %) | Control (n=10) (n, %) | p-value | |
|---|---|---|---|---|
| Negative | 7 (30.4) | 6 (60.0) | 9 (90.0) | |
| Positive | 16 (69.6) | 4 (40.0) | 1 (10.0) | 0.003a) |


 PDF
PDF Citation
 Print
Print


 XML Download