INTRODUCTION
ENDOSCOPIC ASSESSMENT OF GASTRIC ATROPHY ACCORDING TO THE KIMURA-TAKEMOTO CLASSIFICATION
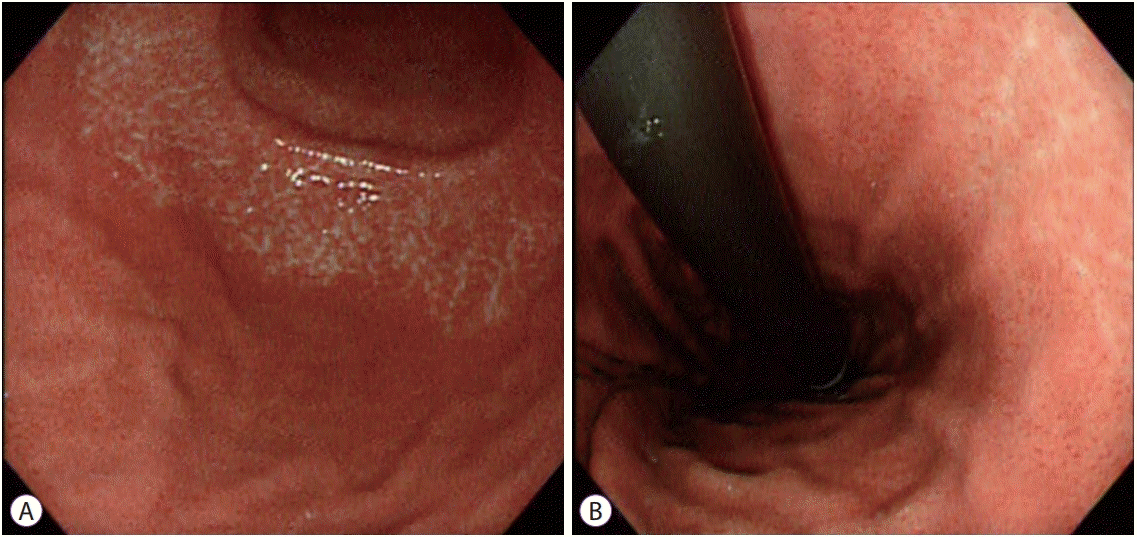
Endoscopic atrophic border
 | Fig. 1.Atrophic border on the greater curvature (A) and lesser curvature (B). The gastric mucosa shows differences in level and color between the 2 sides of the atrophic border. The endoscopic atrophic border represents both the transition from non-atrophic gastric mucosa to atrophic gastric mucosa and the transition from fundic glands to pyloric glands in a non-atrophic stomach [6]. Its presence, however, does not always mean that a patient has gastric mucosal atrophy. The term “atrophic border” is not accurate and might cause some misunderstanding, but is still used in daily practice due to its historical meaning. |
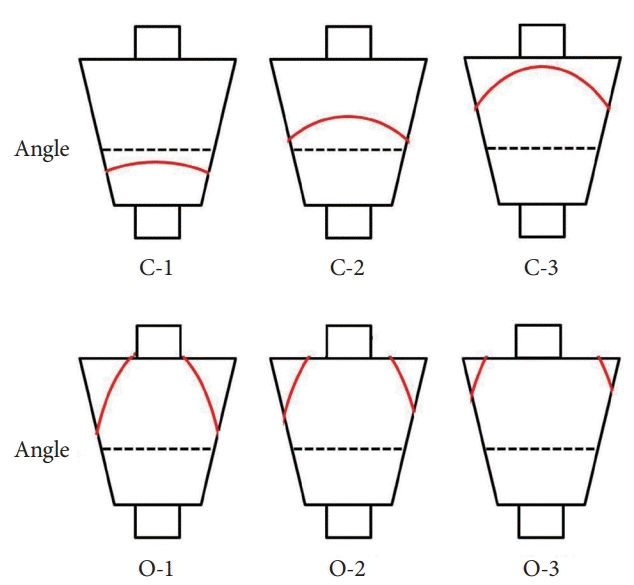
Endoscopic gastric pattern according to the Kimura-Takemoto classification
 | Fig. 2.Extension of the atrophic border (red line) and patterns of endoscopic gastric atrophy as classified by Kimura and Takemoto [13]. |
Severity of gastric atrophy graded according to the Kimura-Takemoto classification and correlation with histology
Interobserver and intraobserver agreement for gastric mucosal atrophy assessment according to the Kimura-Takemoto classification
Progression of gastric atrophy assessed with the Kimura-Takemoto classification
CLINICAL APPLICATION IN DAILY PRACTICE
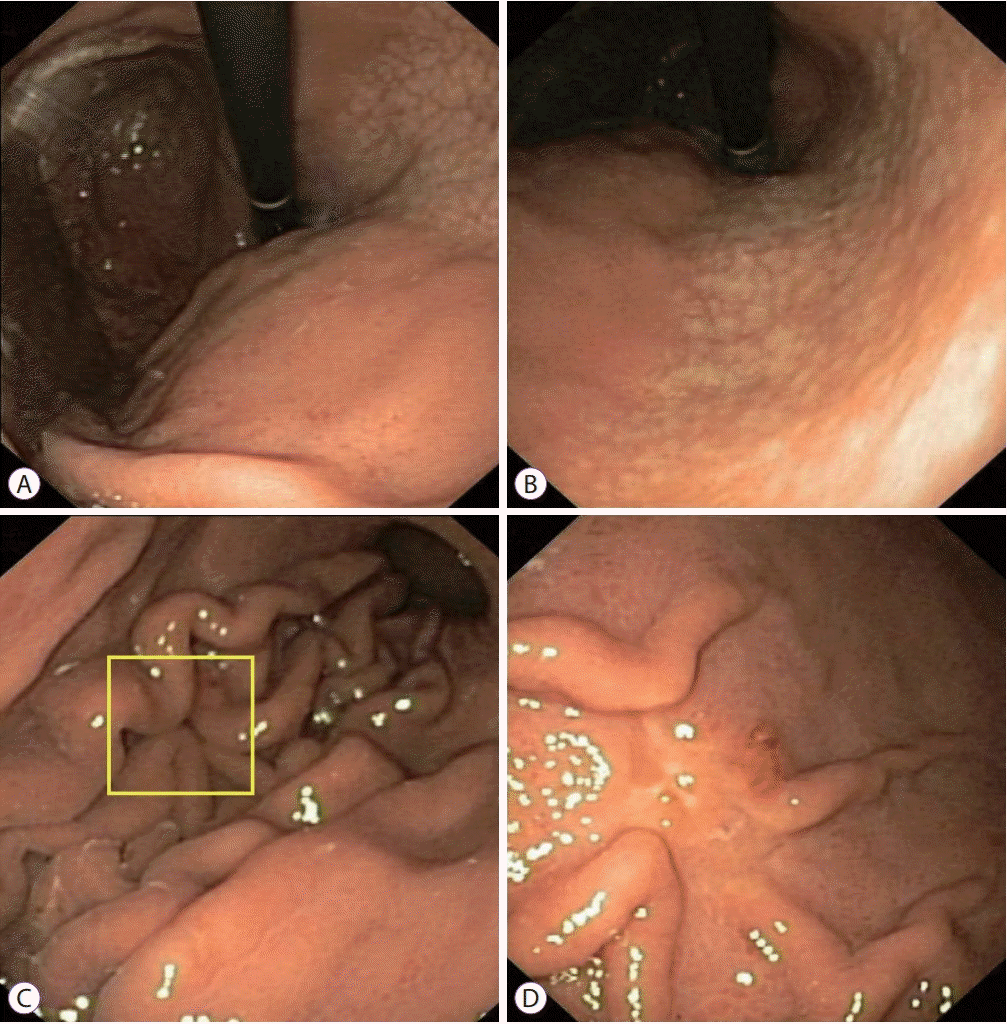
Moderate-to-severe EGA as an endoscopic indicator for the presence of gastric cancer
 | Fig. 3.A 24-year-old Vietnamese female underwent upper gastrointestinal endoscopy for epigastric pain. The patient had no alarming features. (A, B) White-light endoscopy clearly demonstrated moderate endoscopic gastric atrophy (type O-1), even with an older-generation gastroscope (Olympus EXERA-GIF 160 Video Gastroscope; Olympus Co., Tokyo, Japan), which prompted the endoscopist to search carefully for gastric cancer. (C) An easily-missed subtle change (yellow box) could be identified on the greater curvature of the corpus. (D) The gastroscope was advanced closer to the suspicious area and more air was insufflated. A small 0-IIc lesion hidden beneath gastric mucosal folds was identified. This lesion was diagnosed as undifferentiated adenocarcinoma on pathology. |
Moderate-to-severe EGA as an indicator for high risk of GC development
Table 1.
| Study | Type of study | Number of patients | H. pylori status | Follow-up period (yr) | Number of cancer | EGA severity as risk factor | Other risk factors |
|---|---|---|---|---|---|---|---|
| Uemura et al. [38] | Prospective cohort study | 1,526 | Before eradication | 7.8 | 36 | Severe (O-2, O-3) | Corpus-predominant gastritis |
| Intestinal metaplasia | |||||||
| Kaji et al. [29] | Retrospective cohort study | 12,941 | N/A | 3.6 | 63 | Open type > C-2, C-3 > C-1, C-0 | Age ≥62 |
| Presence of ulcer | |||||||
| Uric acid level | |||||||
| Hosokawa et al. [39] | Retrospective cohort study | 3,672 | N/A | 1.9 | 32 | Severe (O2, O3) | Age (60–69) |
| Masuyama et al. [26] | Cross-sectional | 27,777 | N/A | 13 | 407 | C-2 or more severe | |
| Sekikawa et al. [35] | Retrospective cohort study | 1,823 | N/A | 8.0 | 29 | Open type | Gastric xanthelasma |
| Sugimoto et al. [36] | Cross-sectional | 1,200 | N/A | 4.6 | 79 | Severe (O-2, O-3) | Intestinal metaplasia |
| Take et al. [30] | Prospective cohort study | 1,674 | Post successful eradication | 14.1 | 28 | Open type, C-3 | |
| Toyoshima et al. [31] | Retrospective cohort study | 1,232 | Post successful eradication | 2.5 | 15 | Open type > C-2, C-3 | - |
| Shichijo et al. [37] | Retrospective cohort study | 573 | Post successful eradication | 6.2 | 21 | Open type > C-2, C-3 > C-1, C-0 | Intestinal metaplasia |
| Sakitani et al. [33] | Retrospective cohort study | 965 | Post successful eradication | 4.5 | 21 | O-2, O-3 | - |
| Kodama et al. [34] | Retrospective cohort study | 2,355 | Post successful eradication | 2.4 | 33 | C-3 or more severe | Intestinal metaplasia |
Table 2.
| Study | Type of study | Number of patients | Patients’ characteristics | Duration of study (yr) | Type and number of patients with gastric neoplasm | EGA severity as a high-risk factor | Other high-risk factors |
|---|---|---|---|---|---|---|---|
| Mori et al. [42] | Retrospective cohort study | 594 | After EMR/ESD | 4.5 | 79 (MGC) | Severe (O-2/O-3) | Male |
| Successful H. pylori eradication | Number of GC before successful H. pylori eradication | ||||||
| Masuyama et al. [26] | Cross-sectional | 272 | N/A | 13.0 | 30 (SGC) | Open type | - |
| 20 (MGC) | |||||||
| Nam et al. [43] | Retrospective cohort study | 488 | After ESD / Surgery | 3.1 | 18 (MGC) | C-3 or more severe | Age ≥65 |
| 7 (MHD) | elevated morphology of primary lesions | ||||||
| 52 (MLD) |
Synchronous gastric cancer (SGC), synchronous high-grade dysplasia and synchronous low-grade dysplasia were defined as gastric epithelial neoplastic lesions that have already been detected before the initial endoscopic submucosal dissection (ESD) or found endoscopically and confirmed pathologically with endoscopic forceps biopsy within 1 year of ESD. Metachronous gastric cancer (MGC) was defined as a new GC detected at least 1 year after successful H. pylori eradication and located in an area other than the site of the previous endoscopic resection.
EGA, endoscopic gastric atrophy; EMR, endoscopic mucosal resection; MHD, metachronous high-grade dysplasia; MLD, metachronous low-grade dysplasia; N/A, no applicable.


 PDF
PDF Citation
 Print
Print


 XML Download