Abstract
Subepithelial tumors are divided into benign subepithelial and potentially malignant gastrointestinal stromal tumors. It is difficult to distinguish between these tumor types. Contrast-enhanced harmonic endoscopic ultrasound is reportedly useful for diagnosing subepithelial tumors, can be safely and easily performed by understanding the principle and method, and can be used to distinguish between tumor types with high sensitivity on the basis of differences in contrast effect. The generated image shows a hyper-enhancement pattern in gastrointestinal stromal tumors (sensitivity, 78%–100%; specificity, 60%–100%; accuracy, 60%–100%) and hypo-enhancement pattern in benign subepithelial tumors. Contrast-enhanced harmonic endoscopic ultrasound can be used to estimate the malignancy potential of gastrointestinal stromal tumors by evaluating the uniformity of the contrast and the blood vessels inside the tumor, with abnormal intra-tumor blood vessels, heterogeneous enhancement, and non-enhancing spots suggesting malignancy. Contrast-enhanced harmonic endoscopic ultrasound has a higher sensitivity than other imaging modalities for the detection of vascularity within gastrointestinal stromal tumors. Additionally, it has been reported that treatment effects can be estimated by evaluating the blood flow in the gastrointestinal stromal tumor before and after treatment with tyrosine kinase inhibitors using contrast-enhanced ultrasound. However, there will be subjective-bias and the results depends on the performer’s skill.
Subepithelial tumors (SETs) are covered with normal epithelium; they are often detected during gastrointestinal endoscopy and up to 20% of these may be neoplastic [1,2]. These comprise not only benign SETs such as leiomyomas, cysts, and lipomas but also potentially malignant tumors such as gastrointestinal stromal tumors (GISTs). GISTs are soft tissue sarcomas arising in mesenchymal tissues, and are the most common tumors of this origin in the gastrointestinal tract, accounting for approximately 3% of all gastrointestinal tumors and 5%–6% of all mesenchymal tumors [3,4]. However, it is difficult to distinguish between benign SET and GIST by only assessing SET size during upper gastrointestinal endoscopy.
Endoscopic ultrasound (EUS) has been reported to be useful in distinguishing GISTs from benign SETs [5,6]. EUS can differentially diagnose SETs by determining the wall layer of the origin and assessing its echogenicity. In EUS images, GISTs are usually hypoechoic masses that originate from the proper muscle layer. Some retrospective studies have shown that differences in shape, echogenicity, and homogeneity on EUS could differentiate GISTs from other benign SETs and assess the malignancy risk of GISTs [5,6]. However, it is reportedly difficult to differentiate small GISTs from leiomyomas because of a difference in the shape, echogenicity, and homogeneity of EUS [7].
It was reported that contrast-enhanced harmonic (CH) imaging of EUS was useful in distinguishing GIST from benign SET [8-12]; 10% to 30% of GISTs have a malignant clinical course. Therefore, it is necessary to estimate the malignancy potential of GIST by examining the pattern of microvasculature [10,13-15]. Contrast-enhanced ultrasound (US) has recently been found to be useful in the evaluation of treatment response by assessing blood flow in the tumors [16,17].
In this article, we review the principle of CH imaging, provide examples of CH imaging of GIST and benign SET, and describe the prediction of GIST malignancy potential and the evaluation of treatment response in GIST.
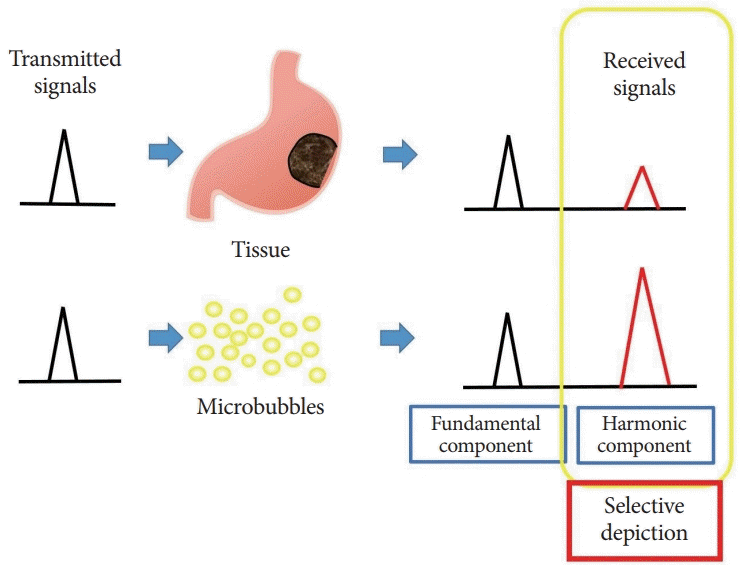
Three different second-generation US contrast agents are used in CH-EUS: SonoVue® (Bracco Diagnostics, Milan, Italy), Sonazoid® (Daiichi-Sankyo Co., Tokyo, Japan), and Definity® (Bristol-Myers Squibb Co., New York, NY, USA). US contrast agents contain gas-filled microbubbles with a lipid monolayer, forming a lipophilic shell. On US insonation, the microbubbles resonate in response to pressure waves. The reflection signal from the resonated contrast microbubbles contains multiple insonated frequencies known as harmonic [18-20]. On the other hand, the harmonic component causing reflection signals from biological tissue is known as “tissue harmonics”. However, microbubbles, having larger nonlinearity, exceed the tissue harmonic component. The harmonic method depicts microbubbles selectively with high sensitivity by extracting only the harmonic component [21,22]. The value of mechanical index (MI) (a measure of acoustic power) that can resonate but break the microbubbles is 0.3–0.4 [21,22]. Therefore, US of the contrast agent can detect even a small blood vessel in the tissue (Fig. 1) [21-23].
After SET is detected by fundamental B-mode EUS, the MI is set to 0.2–0.4. The EUS screen is changed to dual image mode before the intravenous injection of contrast agent, with one image being the fundamental B-mode and the other being the contrast harmonic mode. The focal point is also set at the bottom. US beam penetration during CH is lesser than that in the fundamental B-mode; hence it is important to image the target lesion closely. A bolus infusion of contrast agent (Sonazoid® 15 μL/kg bwt; SonoVue®, 2.4–4.8 mL/bwt; Definity®, 10 μL/kg bwt) is administered intravenously. Both continuous 0- to 15-second (vessel image) and 40- to 60-second (perfusion image) images were examined to allow for real time assessment of vascular structures.
There are three patterns used to quantify within-lesion blood flow on CH-EUS: hypo-enhancement, iso-enhancement, and hyper-enhancement. Quantification is done by comparing within-the target lesion blood flow with surrounding normal tissue blood flow, as described in a previous report [8]. The vessel image is reportedly used to detect irregular vessels in GIST. The enhancement patterns in the perfusion image are defined as either homogenous or heterogeneous enhancement.
It is difficult to distinguish GIST from benign submucosal lesions on fundamental B-mode EUS images. There have been some reports that CH-EUS is useful in distinguishing GIST from benign SET [8-12], as GISTs had hyper-enhancement patterns and benign SETs had hypo-enhancement patterns on CH-EUS images (Fig. 2). Literature on the use of CH-EUS for diagnostic differentiation of GIST from SET are summarized in Table 1. The sensitivity, specificity, and accuracy of the hyper-enhancement pattern on CH-EUS in the diagnosis of GIST ranged from 78 to 100%, 60 to 100%, and 82.2 to 100%, respectively [8-12].
Kamata et al. reported the homogeneity and heterogeneity of the contrast effect of GIST in CH-EUS images [9]. The homogeneity and heterogeneity of the contrast effect of SET were evaluated by the extent of blood flow in the perfusion image during the blood-pool phase (40–60 seconds after infusion of the contrast agent (Sonazoid) in the same study. This study found that 84.5% (49/58) of GISTs showed the hyper-enhancement pattern, whereas 26.7% (4/15) of benign SETs (lipoma, leiomyoma, schwannoma, glomus tumor, or ectopic pancreas) showed a hyper-enhancement pattern. Concurrently, 36.2% (21/58) of GISTs showed heterogeneous contrast enhancement, whereas only 13.3% (2/15) of benign SETs demonstrated heterogeneous contrast enhancement in the perfusion image. The sensitivity, specificity, and accuracy of the heterogeneous enhancement pattern on CH-EUS in the diagnosis of GISTs were 36.2%, 86.7%, and 46.6%, respectively. Almost all of the GISTs showed a hyper-enhancement pattern on CH-EUS. There was a tendency for smaller and larger GISTs to show homogeneous and heterogeneous enhancement patterns, respectively.
Lee et al. reported that the perfusion quantification analysis software was useful in differentiating GIST from SET by EUS [11]. They calculated and compared peak enhancement, wash-in rate (WiR), wash-in perfusion index (WiPl), and wash-in and wash-out areas time-intensity curve (WiWo-AUC) between the GISTs and benign SETs. The time-intensity curves were automatically analyzed to determine the CH-EUS parameters. The parameters for perfusion quantification include peak enhancement in arbitrary units (a.u), rise time in seconds, WiR in a.u, WiPl in a.u, and area under time-intensity curve in a.u. In GISTs, the WiR, WiPI, and WiWo-AUC were significantly higher than those in leiomyomas (p=0.024, 0.012, 0.006, respectively).
Fukuta et al. reported that the contrast enhancement in transabdominal US was useful for estimation of the malignancy potential of GIST [24]. The CH-US images of GIST were classified into two image patterns describing the extent of blood flow area of the tumors, with real-time continuous imaging of the tumor vessels used to make this distinction. If an image pattern was designated as “poor”, it was suggestive of only peripheral tumor vessels and “rich” represented copious vessels flowing from the outer edge to the center of the tumor (Fig. 3). According to their report, 83.3% of benign GISTs had “poor” image vessel patterns and all malignant GISTs had “rich” image vessel patterns on CH-US [24]. In addition, the GISTs indicating a “rich” image on US had a high possibility of hematogenous metastases, because of the velocity of blood flow or a higher density of vessels in GIST.
However, in the evaluation of GIST, transabdominal US has a limitation because of subcutaneous or visceral fat and gastrointestinal gas. EUS could evaluate GISTs without being affected by gastrointestinal gas and subcutaneous or visceral fat. CH-EUS is not only useful for distinguishing GIST from benign SET but also for estimating the malignancy potential of GIST. The literature on the use of CH-EUS to estimate the malignancy potential of GIST is summarized in Table 2.
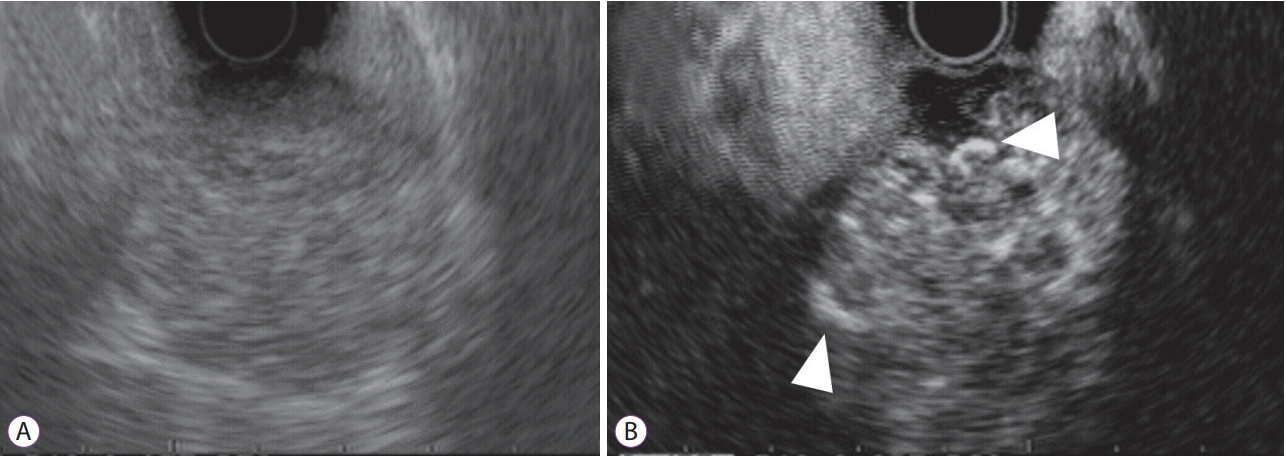
There are about three findings on malignant GIST on CH-EUS— the first being intra-tumor blood vessels (Fig. 4). There are some reports that in patients with GISTs, angiogenesis and expression of vascular endothelial growth factor were associated with prognosis [25-27]. Yamashita et al. found that high-grade malignancy GIST had significantly more intratumoral vessels than low-grade malignancy on CH-EUS (p<0.005) [13]. GISTs whose neovascularization could be detected on CH-EUS had large vessels deficient in elastic fibers on histologic review. The visualization of abnormal intra-tumor blood vessels determined GIST malignancy with a sensitivity, specificity, and accuracy of 100%, 87.5%, and 92.3%, respectively [13].
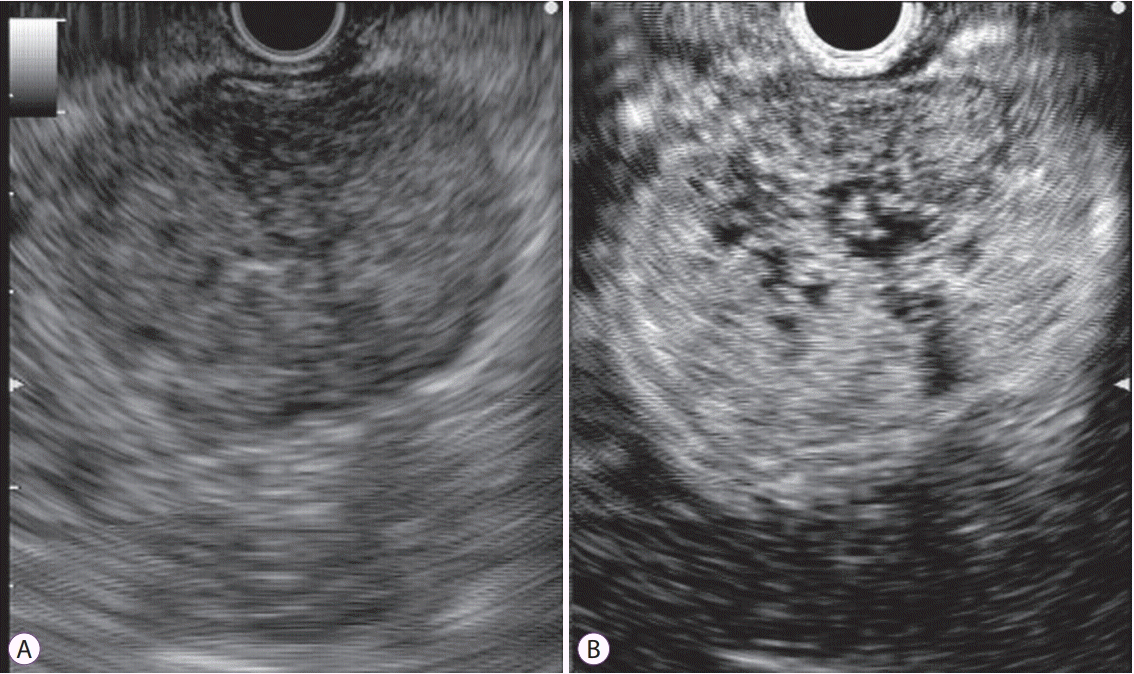
On CH-EUS, another finding of malignant GIST was heterogeneous enhancement on the perfusion image (Fig. 5). Sakamoto et al. reported the classification of GISTs based on the CH-EUS vessel patterns and perfusion images [15]. Irregular vessels on vessel images and heterogeneous enhancement on perfusion images [15] determined GIST malignancy with a sensitivity, specificity, and accuracy of 100%, 63%, and 83%, respectively [15].
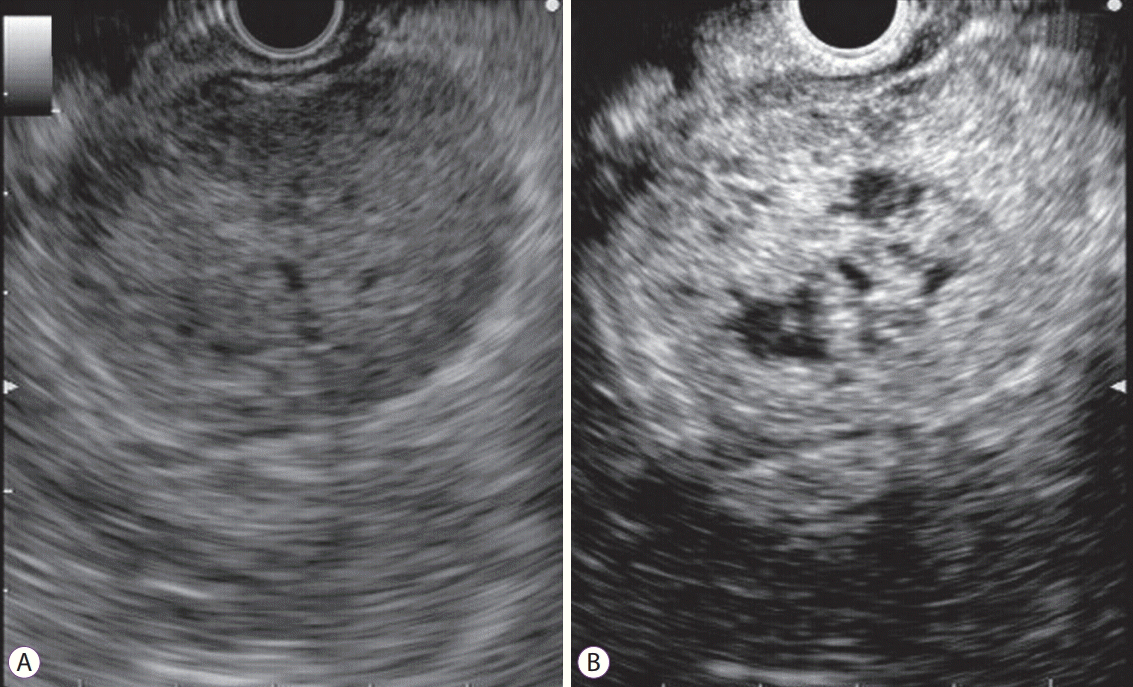
On CH-EUS, an additional finding typical of malignant GIST was the existence of non-enhancing spots (Fig. 6). Park et al. reported that high-grade malignancy GIST had significantly more non-enhancing spots than low-grade malignancy GIST on CH-EUS (p<0.022) [14]. The non-enhancing spot determined GIST malignancy with a sensitivity, specificity, and accuracy of 63.6%, 53.3%, and 57.6%, respectively [14].
There were few reports that compared CH-EUS with other imaging modalities. Contrast-enhanced computed tomography (CECT) could not identify an intratumoral vessel of GIST in the study [15]. The sensitivity of the detection of blood vessels on CECT was 0% in small (<3 cm) GISTs and 42% in large (>3 cm) GISTs. Sakamoto et al. reported that CH-EUS had significantly higher sensitivity for detecting irregular vessels than CECT and power-Doppler EUS (p<0.05) [15]. In this study, EUSfine needle aspiration was demonstrated to have a sensitivity, specificity, and accuracy of 92%, 62%, and 81%, respectively, for the diagnosis of high-grade malignancy compared with 100%, 63%, and 83%, respectively, in CH-EUS [15]. From these results, CH-EUS was found to be similar to EUS-fine needle aspiration in sensitivity, specificity, and accuracy [15].
The contrast agents of US and EUS are useful in distinguishing GIST from benign SET and estimating the malignancy potential of GIST. In addition, recently, the contrast agent of US has been found to be useful in estimating the effectiveness of treatment of GIST with tyrosine kinase inhibitors (TKIs) such as imatinib [16]. TKIs are antiangiogenic agents that reduce the growth of new blood vessels that supply tumors, resulting in hemorrhage and/or necrosis. This can result in a clinical improvement, but tumor size does not necessarily reduce. Therefore, positron emission tomography (PET) with CT was used for estimating the treatment effectiveness of TKIs because PET has a high sensitivity in detecting effectiveness of TKI to metastatic GIST at an early stage. In contrast, PET-CT is prohibitively expensive for weekly monitoring to establish an early response [28,29]. In this regard, the European Society for Medical Oncology suggested that the use of contrast-enhanced US was useful for establishing an early response. Lassau et al. reported that 3 contrast-enhanced US variables were useful in predicting the effectiveness of TKIs in the treatment of GISTs: the area under the curve (AUC), the area under wash-in (AUWI), and the area under washout (AUWO) [16]. These measurements are all related to blood volume. In this regard, they were useful in evaluating the outcome of reduction in tumor vascularization by TKI treatment [16]. In the aforementioned study, 90% (18/20) of patients showed improvement and were treated for at least one year. There were no significant changes in the CH-US variables on day 1 and 7, when compared with those before treatment. However, there were significant reductions in the CH-US variables that relate to blood volume on day 15: AUC (p=0.004), AUWI (p=0.002), and AUWO (p=0.002). There were 63.6% (7/11) of patients with reduction in Standard Uptake Values (SUV). In addition, reduction of AUC, AUWI, and AUWO values on day 7 in the CH-US were highly predictive of the PET result. AUC, AUWI, and AUWO values on day 15 in the CH-US can be used as predictors of the response of GISTs to treatment with TKIs.
CH-EUS is useful in distinguishing GISTs from benign SETs and evaluating the malignancy potential of GIST. CH-EUS is an imaging modality that allows valuable assessment of the perfusion pattern of GISTs and SETs. Malignant GISTs have irregular vessels and heterogenous enhancement patterns in the tumor on CH-EUS. This method has a higher sensitivity than contrast CT and Doppler EUS for evaluating the malignancy potential of GIST. In addition, CH-EUS may be useful for the evaluation of treatment response by examining the blood flow in GIST. However, CH-EUS has some limitations in the diagnosis of gastrointestinal SETs. The limitations are that evaluation of SETs depends on performers’ skills and subjective analyses. Therefore, accumulation of more reports on CH-EUS is necessary to clarify its use.
ACKNOWLEDGMENTS
We thank all members of the second department of internal medicine and clinical study support center of Wakayama Medical University.
REFERENCES
1. Hwang JH, Rulyak SD, Kimmey MB. American Gastroenterological Association Institute technical review on the management of gastric subepithelial masses. Gastroenterology. 2006; 130:2217–2228.

2. Min YW, Park HN, Min BH, Choi D, Kim KM, Kim S. Preoperative predictive factors for gastrointestinal stromal tumors: analysis of 375 surgically resected gastric subepithelial tumors. J Gastrointest Surg. 2015; 19:631–638.

3. Nishida T, Hirota S. Biological and clinical review of stromal tumors in the gastrointestinal tract. Histol Histopathol. 2000; 15:1293–1301.
5. Okai T, Minamoto T, Ohtsubo K, et al. Endosonographic evaluation of c-kit-positive gastrointestinal stromal tumor. Abdom Imaging. 2003; 28:301–307.

6. Chak A, Canto MI, Rösch T, et al. Endosonographic differentiation of benign and malignant stromal cell tumors. Gastrointest Endosc. 1997; 45:468–473.

7. Seo SW, Hong SJ, Han JP, et al. Accuracy of a scoring system for the differential diagnosis of common gastric subepithelial tumors based on endoscopic ultrasonography. J Dig Dis. 2013; 14:647–653.

8. Kannengiesser K, Mahlke R, Petersen F, et al. Contrast-enhanced harmonic endoscopic ultrasound is able to discriminate benign submucosal lesions from gastrointestinal stromal tumors. Scand J Gastroenterol. 2012; 47:1515–1520.

9. Kamata K, Takenaka M, Kitano M, et al. Contrast-enhanced harmonic endoscopic ultrasonography for differential diagnosis of submucosal tumors of the upper gastrointestinal tract. J Gastroenterol Hepatol. 2017; 32:1686–1692.

10. Pesenti C, Bories E, Caillol F, et al. Characterization of subepithelial lesions of the stomach and esophagus by contrast-enhanced EUS: a retrospective study. Endosc Ultrasound. 2019; 8:43–49.

11. Lee HS, Cho CM, Kwon YH, Nam SY. Predicting malignancy risk in gastrointestinal subepithelial tumors with contrast-enhanced harmonic endoscopic ultrasonography using perfusion analysis software. Gut Liver. 2019; 13:161–168.

12. Ignee A, Jenssen C, Hocke M, et al. Contrast-enhanced (endoscopic) ultrasound and endoscopic ultrasound elastography in gastrointestinal stromal tumors. Endosc Ultrasound. 2017; 6:55–60.

13. Yamashita Y, Kato J, Ueda K, et al. Contrast-enhanced endoscopic ultrasonography can predict a higher malignant potential of gastrointestinal stromal tumors by visualizing large newly formed vessels. J Clin Ultrasound. 2015; 43:89–97.

14. Park HY, Jeon SW, Lee HS, et al. Can contrast-enhanced harmonic endosonography predict malignancy risk in gastrointestinal subepithelial tumors? Endosc Ultrasound. 2016; 5:384–389.

15. Sakamoto H, Kitano M, Matsui S, et al. Estimation of malignant potential of GI stromal tumors by contrast-enhanced harmonic EUS (with videos). Gastrointest Endosc. 2011; 73:227–237.

16. Lassau N, Chami L, Koscielny S, et al. Quantitative functional imaging by dynamic contrast enhanced ultrasonography (DCE-US) in GIST patients treated with masatinib. Invest New Drugs. 2012; 30:765–771.

17. Chhoda A, Jain D, Surabhi VR, Singhal S. Contrast enhanced harmonic endoscopic ultrasound: a novel approach for diagnosis and management of gastrointestinal stromal tumors. Clin Endosc. 2018; 51:215–221.

18. Desser TS, Jeffrey RB. Tissue harmonic imaging techniques: physical principles and clinical applications. Semin Ultrasound CT MR. 2001; 22:1–10.

19. Kollmann C. New sonographic techniques for harmonic imaging--underlying physical principles. Eur J Radiol. 2007; 64:164–172.

20. Sanchez MV, Varadarajulu S, Napoleon B. EUS contrast agents: what is available, how do they work, and are they effective? Gastrointest Endosc. 2009; 69(2 Suppl):S71–S77.
21. Kitano M, Kudo M, Sakamoto H, et al. Preliminary study of contrast-enhanced harmonic endosonography with second-generation contrast agents. J Med Ultrason (2001). 2008; 35:11–18.

22. Kitano M, Sakamoto H, Matsui U, et al. A novel perfusion imaging technique of the pancreas: contrast-enhanced harmonic EUS (with video). Gastrointest Endosc. 2008; 67:141–150.

23. Săftoiu A, Dietrich CF, Vilmann P. Contrast-enhanced harmonic endoscopic ultrasound. Endoscopy. 2012; 44:612–617.

24. Fukuta N, Kitano M, Maekawa K, Chikugo T, Kudo M. Estimation of the malignant potential of gastrointestinal stromal tumors: the value of contrast-enhanced coded phase-inversion harmonics US. J Gastroenterol. 2005; 40:247–255.

25. Chen WT, Huang CJ, Wu MT, Yang SF, Su YC, Chai CY. Hypoxia-inducible factor-1alpha is associated with risk of aggressive behavior and tumor angiogenesis in gastrointestinal stromal tumor. Jpn J Clin Oncol. 2005; 35:207–213.
26. Takahashi R, Tanaka S, Hiyama T, et al. Hypoxia-inducible factor-1alpha expression and angiogenesis in gastrointestinal stromal tumor of the stomach. Oncol Rep. 2003; 10:797–802.
27. Takahashi R, Tanaka S, Kitadai Y, et al. Expression of vascular endothelial growth factor and angiogenesis in gastrointestinal stromal tumor of the stomach. Oncology. 2003; 64:266–274.

28. Van den Abbeele AD, Badawi RD. Use of positron emission tomography in oncology and its potential role to assess response to imatinib mesylate therapy in gastrointestinal stromal tumors (GISTs). Eur J Cancer. 2002; 38 Suppl 5:S60–S65.

29. Choi H, Charnsangavej C, Faria SC, et al. Correlation of computed tomography and positron emission tomography in patients with metastatic gastrointestinal stromal tumor treated at a single institution with imatinib mesylate: proposal of new computed tomography response criteria. J Clin Oncol. 2007; 25:1753–1759.

Fig. 1.
Basis of contrast harmonic imaging. Upon exposure to ultrasound beams, microbubbles in the contrast agent oscillate, resulting in resonation and release of many harmonic signals. Upon receiving the transmitted ultrasound waves, tissues and microbubbles both produce harmonic components from the microbubbles. The harmonic components from microbubbles are at a higher level than those from the tissue. By selectively depicting the second harmonic component, signals from microbubbles are visualized more strongly than those from the tissue.

Fig. 2.
Contrast-enhanced harmonic endoscopic ultrasound (CH-EUS) images of gastrointestinal stromal tumor (GIST). (A, B) CH-EUS image of a GIST. (A) Fundamental B-mode EUS shows a low echoic tumor. (B) An image of CH-EUS demonstrating the hyper-enhancement pattern. (C, D) CH-EUS image of a leiomyoma (C) B-mode EUS shows a low echoic tumor. (D) An image of CH-EUS demonstrating the hypo-enhancement pattern.

Fig. 3.
Contrast-enhanced harmonic ultrasound (CH-US) images of gastrointestinal stromal tumor (GIST). (A, B) GIST with “poor” pattern on abdominal ultrasound and contrast-enhanced harmonic abdominal ultrasound. (A) Fundamental B-mode abdominal ultrasound shows iso-echoic tumor. (B) An image of CH-US showing blood flow restricted to the periphery, without filling the parenchymal flow of the tumor (C, D). GIST with “rich” pattern on abdominal ultrasound and contrast-enhanced harmonic abdominal ultrasound. (C) Fundamental B-mode abdominal ultrasound showing an iso-echoic tumor. (D) An image of CH-US shows plentiful vessels extending from the periphery to the tumor center.

Fig. 4.
Detection of intratumoral vessels in gastrointestinal stromal tumor by contrast-enhanced harmonic endoscopic ultrasound (CH-EUS). (A) Fundamental B-mode EUS shows a low echoic mass. (B) A vessel image of CH-EUS demonstrating irregular vessel subepithelial intratumoral vessels (arrow heads) originating peripherally and extending centrally into the tumor.

Fig. 5.
Detection of heterogeneous enhancement in gastrointestinal stromal tumor by contrast-enhanced harmonic endoscopic ultrasound (CH-EUS). (A) Fundamental B-mode EUS shows a low echoic mass. (B) A perfusion image of CH-EUS demonstrating the heterogeneous enhancement.

Fig. 6.
Detection of non-enhancing spots in gastrointestinal stromal tumor by contrast-enhanced harmonic endoscopic ultrasound (CH-EUS). (A) Fundamental B-mode EUS shows a low echoic mass. (B) A perfusion image of CH-EUS demonstrating the non-enhancing spot.

Table 1.
Diagnostic Ability of on Contrast-Enhanced Harmonic Endoscopic Ultrasound in Distinguishing GIST from Benign SET
| Study | Number of subjects | Location of lesion | Diameter of lesion (mm) (mean) | Contrast agent | Differentiation of GIST from SET hyper-enhancement on CH-EUS |
|---|---|---|---|---|---|
| Kannengiesser et al. (2012) [8] Germany | 17 | N/A | GIST: 25.4 | SonoVue® (2.0 mL) | Sensitivity- 100% |
| Benign lesion: 23.8 | Specificity- 100% | ||||
| Ignee et al. (2017) [12] Romania, China and Germany | 62 | Stomach- 62 | GIST: 62.6 | SonoVue® (4.5 mL) | Sensitivity- 98% |
| Small intestine- 17 | Leiomyoma: 33.6 | Specificity- 100% | |||
| Esophagus- 2 | |||||
| Extraintestinal- 1 | |||||
| Kamata et al. (2017) [9] Japan | 73 | Stomach- 64 | 28 | Sonazoid® (15 μL/kg body weight) | Sensitivity- 85% |
| Esophagus- 4 | Specificity- 73% | ||||
| Duodenum- 5 | |||||
| Pesenti et al. (2019) [10] France | 14 | Stomach- 11 | GIST: 35 | SonoVue® (5.0 mL) | Sensitivity- 100% |
| Esophagus- 3 | Benign lesion: 41 | Specificity- 88% | |||
| Lee et al. (2019) [11] Korea | 44 | Stomach- 34 | High grade GIST: 34 | SonoVue® (2.4 mL) | Sensitivity- 78%–84.4% |
| Esophagus- 2 | Low-grade GIST: 27 | Specificity- 60% | |||
| Duodenum- 4 | Leiomyoma: 29 | ||||
| Rectum- 3 | Benign SETs: 25 |
Table 2.
Ability of Contrast-Enhanced Harmonic Endoscopic Ultrasound in Estimating the Malignancy Potential GIST
| Study | Number of subjects | Location of lesion | Diameter of lesion (mm) (mean) | Contrast agent | Diagnostic test performance Findings suspicious of malignancy |
|---|---|---|---|---|---|
| Sakamoto et al. (2011) [15] Japan | 29 | Stomach- 22 | Low-grade: 29 | Sonazoid® (15 μL/kg) | Grade malignant potential: |
| Duodenum- 7 | High-grade: 32 | Abnormal vessel visualization and heterogeneous enhancement | |||
| Sensitivity- 100%, Specificity- 63%, Accuracy- 83% | |||||
| Yamashita et al. (2015) [13] Japan | 13 | Stomach- 12 | Low-grade: 24 | Sonazoid® (0.7 mL) | Grade malignant potential: |
| Duodenum- 1 | High-grade: 62 | Abnormal vessel visualization | |||
| Sensitivity- 100%, Specificity- 87.5%, Accuracy- 92.3% | |||||
| Park et al. (2016) [14] Korea | SET- 35 | Stomach- 26 | Low-grade: 28 | SonoVue® (2.4 mL) | Grade malignant potential: |
| GIST- 26 | Esophagus- 3 | High-grade: 43 | Non-enhancing spot | ||
| Duodenum- 3 | Sensitivity- 63.6%, Specificity- 53.3%, Accuracy- 57.6% | ||||
| Rectum- 3 |


 PDF
PDF Citation
 Print
Print


 XML Download