Abstract
Background/Aims
Seasonal variation has previously been reported in relation to the incidence of non-variceal upper gastrointestinal bleeding; however, the impact of seasonal variation on variceal bleeding is not known.
Methods
We conducted a cross-sectional study using the Nationwide Inpatient Sample database from 2005 to 2014. International Classification of Diseases, Clinical Modification- 9th Revision codes were used to identify patients hospitalized with a primary or secondary diagnosis of esophageal variceal hemorrhage. The data were analyzed based on the month of hospitalization. Our primary aim was to assess seasonal variations in variceal bleeding-related hospitalizations. The secondary aims were to assess the impact of seasonal variation on outcomes in variceal bleeding including in-hospital mortality and healthcare resource utilization.
Results
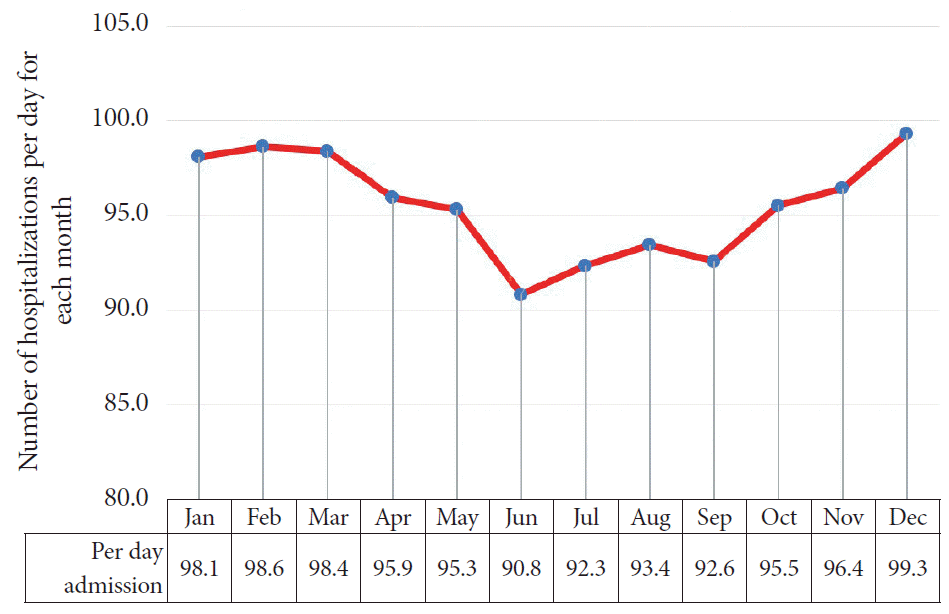
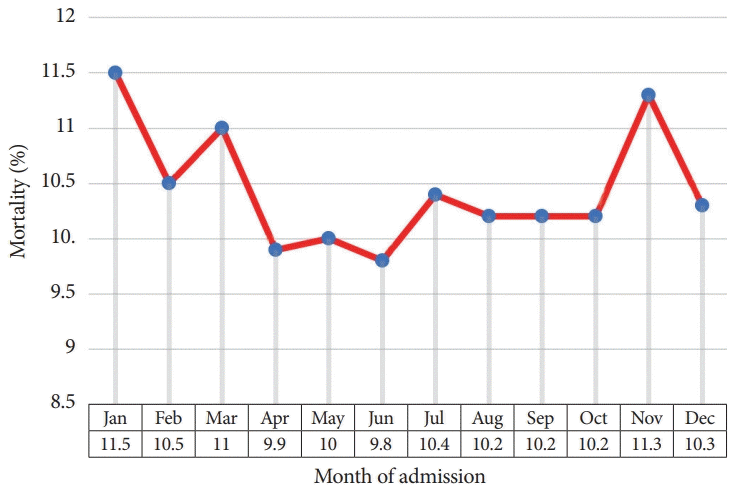
A total of 348,958 patients hospitalized with esophageal variceal bleeding were included. The highest number of hospitalizations was reported in December (99.3/day) and the lowest was reported in June (90.8/day). In-hospital mortality was highest in January (11.5%) and lowest in June (9.8%). There was no significant difference in hospital length of stay or total hospitalization costs across all months in all years combined.
Esophageal variceal hemorrhage has a significant impact on mortality and morbidity in patients with cirrhosis and results in considerable burdens on healthcare resources [1-3]. Over the last decade, several clinical and epidemiological factors were reported to impact the outcome of esophageal variceal bleeding, including the presence of an underlying malignancy, the etiology and severity of cirrhosis, and hospital characteristics such as hospital volume [3-6]. Recently, the effects of various environmental factors on the disease patterns of gastrointestinal disorders were explored [7,8]. A seasonal periodicity in upper gastrointestinal bleeding was reported, particularly for peptic ulcer diseases. However, the underlying basis for such variation was unclear and whether esophageal variceal bleeding rates also varied with seasonal change was not well described [8-10]. Therefore, the current study aimed to assess whether seasonal and monthly variations exist with regard to the hospitalizations and outcomes of esophageal variceal hemorrhage.
We obtained data from the Nationwide Inpatient Sample (NIS) database, which is the largest openly accessible all-payer inpatient healthcare database in the United States. The NIS database was created by the Healthcare Cost and Utilization Project (HCUP) and is used to frame health policies at the federal, state, and county levels. The HCUP is a program developed by the Agency for Healthcare Research and Quality. It comprises de-identified hospitalization records for more than 7 million unweighted annual hospital stays and 35 million weighted annual hospitalizations in the US. The NIS records 7–8 million hospitalizations annually. The data were sampled from approximately 4,411 hospitals and 45 states throughout the US. We used data from 2005 to 2014.
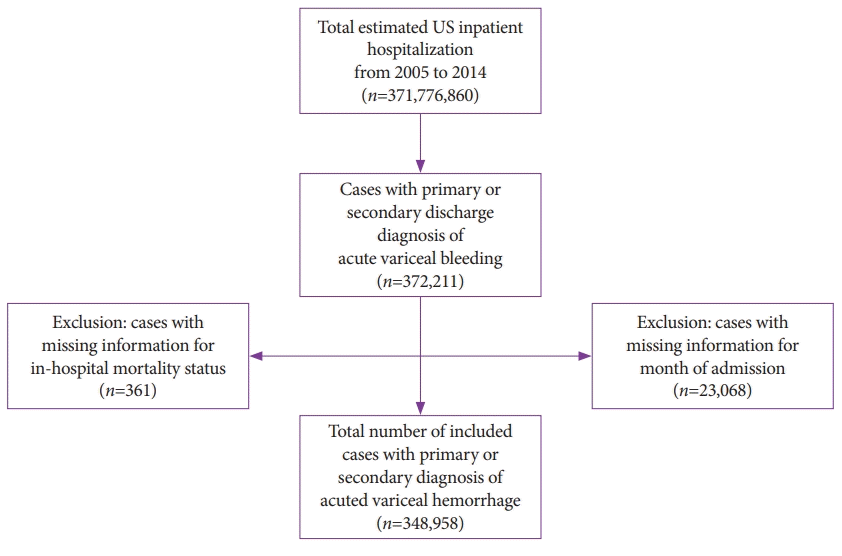
Patients in our sample were selected based on International Classification of Diseases, Clinical Modification- 9th Revision (ICD-9-CM) codes. We identified cases hospitalized with primary or secondary discharge diagnoses of esophageal varices with hemorrhage. We excluded cases lacking information on in-hospital mortality or month of hospitalization. The final study sample consisted of all adult hospitalizations with a discharge diagnosis of esophageal varices with hemorrhage (ICD-9-CM codes 456.0 and 456.20) as previously described [3,11]. A flow diagram of case selection is shown in Fig. 1.
The primary outcome measure for this study was a comparison of the frequency of hospitalizations by each month of the year. For January, March, May, July, August, October, and December, calculations were based on a 31-day month; while for April, June, September, and November calculations were based on a 30-day month. For February, we calculated 29 days for two leap years and 28 days for each month for the other eight years. The secondary outcome measure was the rate of in-hospital mortality associated with esophageal varices bleeding. We also analyzed the admission and in-hospital mortality rates for each geographic region in the US; namely, the Northeastern, Midwestern, Southern, and Western regions. We estimated the differences in resource utilization for each month by calculating the length of stay and hospital costs of care. Potential confounders and covariates including age, sex, race, comorbidities (with Elixhauser comorbidity index), length of stay, admission, and hospital characteristics (location and teaching status) were accounted for in our multivariable regression analysis.
To compare the demographic characteristics, covariates, and other outcomes of interest among our study groups, we performed bivariate analysis and used Pearson’s chi-squared tests. We calculated two-tailed p-values and defined statistical significance as p-value less than 0.05. We adjusted for the pertinent demographics and confounders by performing a multivariable regression analysis.
To calculate the burden of comorbidities, we utilized the software provided by the HCUP and generated the Elixhauser index from the ICD-9-CM diagnosis codes [12,13]. The mean length of stay and hospital cost were calculated for each month. All statistical analyses were performed using IBM SPSS Statistics for Windows, version 25.0 (IBM Co., Armonk, NY, USA).
Between 2005 and 2014, a total of 348,958 cases with esophageal variceal hemorrhage were identified and included in the study sample. The mean age of the entire cohort was 55.7 years, with the 51–65-year age group constituting approximately half (48.3%) of all hospitalizations. Men comprised 69.1% of cases, with the most common race being White (62.3%), followed by Hispanic (22.3%), and Black (7.7%). Almost 90% of all acute variceal hemorrhage hospitalizations were in urban hospital settings, with 40% in urban non-teaching hospitals and 50% in urban teaching hospitals.
The highest number of variceal hemorrhage-related admissions was reported in December (n=30,786; 8.8%), followed by March (n=30,492; 8.7%) and January (n=30,404; 8.7%). The lowest number of admissions was reported in June (27,247; 7.8%). Table 1 summarizes the total number of hospitalizations for each month. We further compared the months based on per-day hospitalizations, as summarized in Table 2 and Fig. 2. June (90.8 admissions per day) had the fewest number of hospitalizations for esophageal varices hemorrhage in contrast to December (99.3 admissions per day), which had the highest daily admission rate.
The overall in-hospital mortality is displayed in Table 1 and a graphical presentation is shown in Fig. 3. The lowest and highest in-hospital mortality rates occurred in June (9.8 %) and January (11.5%), respectively. We further compared the in-hospital mortality for each month by adjusting for various confounding factors between each month and calculated the adjusted odds ratios (ORs) with June as the reference month. After adjusting for the confounding effects of age, sex, race, comorbidities (Elixhauser comorbidity index), length of stay, elective/non-elective admission status, and hospital characteristics (hospital location and teaching status), we assessed mortality rates and calculated the adjusted OR. The adjusted mortality was highest in January (overall morality = 11.5%, adjusted OR, 1.268; 95% confidence interval, 1.194–1.345; p<0.0001) and lowest in June (overall mortality rate = 9.8%). The results of the multivariable regression analysis are summarized in Table 3.
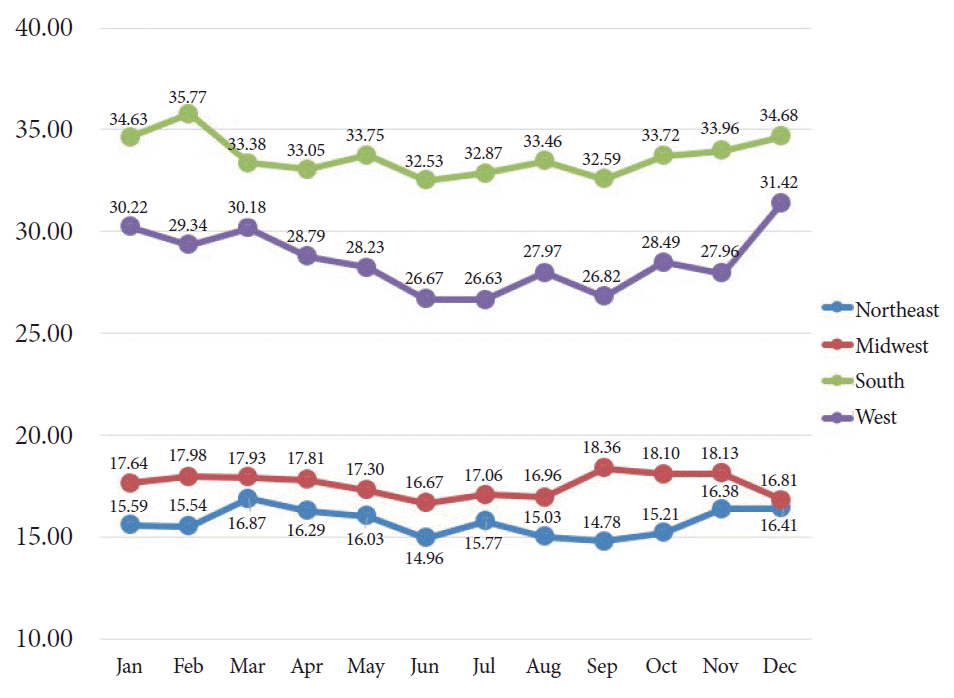
The results of our regional analysis showed that the overall rates of hospitalization for acute variceal hemorrhage were relatively higher in hospitals located in the South, followed by those in the West, Midwest, and Northeast. Fig. 4 shows a graphical presentation of these regional differences. Across all four geographical areas, we noted a relative decrease in variceal hemorrhage-related hospitalizations in June. We also noted relatively higher hospitalization rates in the winter months in all regions; however, the Midwest region showed the highest admission rates in the fall months. All-cause in-hospital mortality associated with esophageal variceal bleeding for each region is summarized in Table 3. In-hospital mortality remained relatively higher in winter months across all geographical regions.
The mean length of stay for the entire cohort was 6.35 days (6.21–6.46 days) and the average total hospitalization cost was $17,123. We did not find substantial differences in hospital lengths of stay or hospital costs across the various months (Table 4). The highest number of esophagogastroduodenoscopy (EGD) procedures for variceal hemorrhage was performed in December (n=25,940), 77.5% (n=20,129) of which involved endoscopic therapy for hemostasis. The fewest EGD procedures were performed in June (n=22,849), 75.1% (n=17,176) of which involved endoscopic therapy for hemostasis. We also noted that the overall in-hospital mortality for the patients undergoing EGD was 8.2%, which was lower than that in patients who did not undergo EGD (21.5%).
We utilized the largest all-payer inpatient database to evaluate whether seasonal variation existed for hospitalizations and outcomes associated with esophageal variceal hemorrhage over a ten-year period. We found a significant month to month difference in the rate of esophageal variceal bleeding-related hospitalizations. Both the monthly volume of hospitalizations and per-day admission rates were higher for December than those for June. We also observed comparable differences in mortality rates. However, hospital costs and length of stay associated with each admission remained relatively similar for each month.
Seasonal variation in acute upper gastrointestinal hemorrhage has been previously described in North America and Europe. However, there is lack of consensus regarding the importance of these findings. While several studies observed seasonal variation in upper gastrointestinal bleeding [7-10,14-16], others did not [17-19]. Boulay et al. specifically studied seasonal variation in esophageal variceal bleeding by utilizing a French public hospital database [15]. They observed that both hospitalizations and mortality from esophageal varices hemorrhage peaked in winter, specifically in December [15]. A similar study by Yen et al. from Taiwan found that the occurrence of esophageal varices hemorrhage peaked in February [14]. Kanotra et al. utilized the United States NIS database to assess the seasonal variation in peptic ulcer disease [20]. They found that the admission rate peaked in February [20]. To our knowledge, the current study is the first to assess the seasonal pattern in esophageal variceal hemorrhage at a national scale within the United States.
Advances in endoscopic therapy and intensive screening for esophageal varices have led to significant reduction in the overall mortality associated with esophageal variceal hemorrhage over the last several decades [3,6,21,22]. However, esophageal variceal bleeding continues to have a higher mortality rate compared to the rates for other causes of upper gastrointestinal bleeding [11]. It is important to analyze whether environmental factors related to changes of season contribute to the observed epidemiology of esophageal variceal bleeding. Indepth understanding of this disease pattern can help clinicians redirect their resources, which can ultimately lead to an improvement in healthcare delivery.
Several authors have hypothesized that the seasonal variation in upper gastrointestinal hemorrhage is at least partially secondary to seasonal fluctuations in the use of non-steroidal anti-inflammatory drugs (NSAIDs) [9]. NSAIDs are a well-known cause for esophageal variceal bleeding [23]. Therefore, increased use of NSAIDs in winter months could predispose or increased the risk of hemorrhage from esophageal varices. A recently published study by Ventura-Cots et al. found that alcohol use increased in winter months, which increased the burden of alcohol-associated liver diseases [24]. Their study also noted that both lower temperatures and decreased sunshine hours were correlated with increased alcohol consumption [24]. Relatively lower temperatures cause peripheral vasoconstriction; therefore, increased portal blood flow could perhaps be attributed to this physiological change. Budzyński et al. did not find any correlation between seasonal changes in the upper gastrointestinal hemorrhage and changes in atmospheric pressure [18]. It is also possible that single or multiple unknown epidemiological or clinical factors may be impacting the incidence of gastrointestinal bleeding in general and variceal bleeding in particular.
Our study has several limitations. This observational study relied on a large nationwide database. Therefore, individual chart review was not possible. The accuracy of analysis depended upon the ICD 9 codes entered at the time of hospitalization. However, ICD codes have high diagnostic and procedural accuracies for outcome research related to upper gastrointestinal hemorrhage [25]. Despite these limitations, the strength of the study lies in the breadth of the data which involved all hospitalizations over a decade. The use of a nationwide database eliminates the bias generated from single-center or even smaller multi-center studies. Our findings suggest the need for further studies to more fully identify seasonal variations related to particular geographical regions.
There are seasonal variations in hospitalizations related to esophageal variceal hemorrhage across the United States. The effect of variation in environmental and patient-specific triggers across various seasons and their impact on esophageal variceal hemorrhage requires further exploration.
Notes
Author Contributions
Conceptualization: Mohamed Tausif Siddiqui, Mohammad Bilal, Beth Schorr-Lesnick, David C. Wolf
Formal analysis: MTS, Christopher Nabors
Methodology: MTS, MB, BSL, DCW
Project administration: MTS, MB, BSL, DCW
Writing-original draft: MTS, Khwaja Fahad Haq
Writing-review&editing: BSL, DCW
REFERENCES
1. Jansen PL. Life expectancy in liver cirrhosis after the first variceal hemorrhage: how can survival be improved? Scand J Gastroenterol Suppl. 1990; 178:106–110.

2. Sempokuya T, Zhang G, Nakagawa K. Temporal trends of cirrhosis associated conditions. World J Hepatol. 2019; 11:74–85.

3. Myers RP, Papay KD, Shaheen AA, Kaplan GG. Relationship between hospital volume and outcomes of esophageal variceal bleeding in the United States. Clin Gastroenterol Hepatol. 2008; 6:789–798.

4. Le Moine O, Hadengue A, Moreau R, et al. Relationship between portal pressure, esophageal varices, and variceal bleeding on the basis of the stage and cause of cirrhosis. Scand J Gastroenterol. 1997; 32:731–735.
5. Wang F, Cui S, Wang F, et al. Different scoring systems to predict 6-week mortality in cirrhosis patients with acute variceal bleeding: a retrospective analysis of 202 patients. Scand J Gastroenterol. 2018; 53:885–890.

6. Abougergi MS, Travis AC, Saltzman JR. The in-hospital mortality rate for upper GI hemorrhage has decreased over 2 decades in the United States: a nationwide analysis. Gastrointest Endosc. 2015; 81:882–888.e1.

7. Fares A. Global patterns of seasonal variation in gastrointestinal diseases. J Postgrad Med. 2013; 59:203–207.

8. Ostensen H, Gudmundsen TE, Burhol PG, Bonnevie O. Seasonal periodicity of peptic ulcer disease. A prospective radiologic study. Scand J Gastroenterol. 1985; 20:1281–1284.
9. Sezgin O, Altintaş E, Tombak A. Effects of seasonal variations on acute upper gastrointestinal bleeding and its etiology. Turk J Gastroenterol. 2007; 18:172–176.
10. Stermer E, Levy N, Tamir A. Seasonal fluctuations in acute gastrointestinal bleeding. J Clin Gastroenterol. 1995; 20:277–279.

11. Jamal MM, Samarasena JB, Hashemzadeh M, Vega KJ. Declining hospitalization rate of esophageal variceal bleeding in the United States. Clin Gastroenterol Hepatol. 2008; 6:689–695. quiz 605.

12. Quan H, Sundararajan V, Halfon P, et al. Coding algorithms for defining comorbidities in ICD-9-CM and ICD-10 administrative data. Med Care. 2005; 43:1130–1139.

13. Southern DA, Quan H, Ghali WA. Comparison of the Elixhauser and Charlson/Deyo methods of comorbidity measurement in administrative data. Med Care. 2004; 42:355–360.

14. Yen FS, Wu JC, Wang LM, Kuo BI, Hu SC, Lee SD. Seasonal variation in the incidence of peptic ulcer and esophageal variceal bleeding in Taiwan. Zhonghua Yi Xue Za Zhi (Taipei). 1996; 57:22–27.
15. Boulay F, Berthier F, Dahan MDC, Tran A. Seasonal variations in variceal bleeding mortality and hospitalization in France. Am J Gastroenterol. 2001; 96:1881–1887.

16. Adler J, Ingram D, House T. Perforated peptic ulcer--a seasonal disease? Aust N Z J Surg. 1984; 54:59–61.
17. Mejía Cordero F, Mondragón Aguilar E, Montes Teves P, Monge Salgado E. [Seasonal variation in upper gastrointestinal bleeding associated with portal hypertension]. Rev Gastroenterol Peru. 2006; 26:278–282.
18. Budzyński P, Pogoda W, Pogodziński M. [Seasonal variation and influence of atmospheric pressure diurnal fluctuations on occurrence of acute complications in patients with stomach and duodenal ulcer]. Przegl Lek. 2000; 57:611–613.
19. Langman MI. The seasonal incidence of bleeding from the upper gastrointestinal tract. Gut. 1964; 5:142–144.

20. Kanotra R, Ahmed M, Patel N, et al. Seasonal variations and trends in hospitalization for peptic ulcer disease in the United States: a 12-year analysis of the nationwide inpatient sample. Cureus. 2016; 8:e854.

21. Carbonell N, Pauwels A, Serfaty L, Fourdan O, Lévy VG, Poupon R. Improved survival after variceal bleeding in patients with cirrhosis over the past two decades. Hepatology. 2004; 40:652–659.

22. Stokkeland K, Brandt L, Ekbom A, Hultcrantz R. Improved prognosis for patients hospitalized with esophageal varices in Sweden 1969-2002. Hepatology. 2006; 43:500–505.

23. De Lédinghen V, Heresbach D, Fourdan O, et al. Anti-inflammatory drugs and variceal bleeding: a case-control study. Gut. 1999; 44:270–273.

Fig. 2.
Graphical representation of per-day hospitalizations for esophageal variceal hemorrhage for each month.

Table 1.
Monthly Incidence and In-Hospital Mortality Associated with Esophageal Variceal Hemorrhage
Table 2.
Adjusted Odds Ratios for In-Hospital Mortality
Table 3.
In-Hospital Mortality (%) for Each Month according to Geographical Region
Table 4.
Mean Hospital Costs and Length of Stay for Each Month


 PDF
PDF Citation
 Print
Print


 XML Download