Journal List > Clin Endosc > v.54(1) > 1150931

Köker, Ünver, Malya, Uysal, Keskin, and Şentürk: Cyst Fluid Carcinoembryonic Antigen Level Difference between Mucinous Cystic Neoplasms and Intraductal Papillary Mucinous Neoplasms

Abstract

Background/Aims

The role of cyst fluid carcinoembryonic antigen (CEA) level in differentiating mucinous pancreatic cystic lesions (PCLs) is controversial. We investigated the role of cyst fluid CEA in differentiating low-risk (LR)-intraductal papillary mucinous neoplasms (IPMNs) from high-risk (HR)-IPMNs and LR-mucinous cystic neoplasms (MCNs).

Methods

This was a retrospective study of 466 patients with PCLs who underwent endoscopic ultrasound-guided fine-needleaspiration over a 7-year period. On histology, low-grade dysplasia and intermediate-grade dysplasia were considered LR, whereas high-grade dysplasia and invasive carcinoma were considered HR.

Results

Data on cyst fluid CEA levels were available for 50/102 mucinous PCLs with definitive diagnoses. The median CEA (range) levels were significantly higher in HR cysts than in LR cysts (2,624 [0.5–266,510] ng/mL vs. 100 [16.8–53,445]ng/mL, p=0.0012). The area under the receiver operating characteristic curve (AUROC) was 0.930 (95% confidence interval [CI], 0.5–0.8; p<0.001) for differentiating LR-IPMNs from LR-MCNs. The AUROC was 0.921 (95% CI, 0.823–1.000; p<0.001) for differentiating LR-IPMNs from HR-IPMNs. Both had a CEA cutoff level of >100ng/mL, with a negative predictive value (NPV) of 100%.

Conclusions

Cyst fluid CEA levels significantly vary between LR-IPMNs, LR-MCNs, and HR-IPMNs. A CEA cutoff level of >100ng/mL had a 100% NPV in differentiating LR-IPMNs from LR-MCNs and HR-IPMNs.

INTRODUCTION

Pancreatic cystic lesions (PCLs) are incidentally detected at a rate of 8%, and they are primarily (60%) mucinous [1]. Mucinous PCLs include intraductal papillary mucinous neoplasms (IPMNs), mucinous cystic neoplasms (MCNs), intraductal oncocytic papillary neoplasms, cystic changes in ordinary ductal adenocarcinomas, and other invasive carcinomas, such as cystic pancreatic ductal adenocarcinoma (PDAC) [2]. Given the malignant potential of MCNs (10%–39%) and IPMNs (36%–100%), routine monitoring is mandatory [3]. However, there is no single criterion or follow-up model for mucinous PCLs [4]. We aimed to analyze the role of cyst fluid carcinoembryonic antigen (CEA) level in differentiating MCNs from IPMNs as well as low-risk (LR)- versus high-risk (HR)-IPMNs.

MATERIALS AND METHODS

The study population consisted of 466 patients with PCLs referred to our unit, who underwent endoscopic ultrasound-guided fine-needle aspiration (EUS-FNA) of cyst fluid between 2011 and 2018. Demographic data, medical history, and cross-sectional imaging results were retrieved from the electronic medical records. All procedures were part of standard patient care. This retrospective study was approved by the local ethics committee.

Endoscopic ultrasound methods

After providing informed consent, all patients underwent EUS examination (A121091, H121645, H121435, H121637; Pentax Medical Co., Montvale, NJ, USA, K1U047K062; Fujifilm Co., Tokyo, Japan). EUS-FNA was performed with either a 22- or 19-gauge FNA needle (Cook Medical, Bloomington, IN, USA, or Boston Scientific, Marlborough, MA, USA). Prophylactic, single-dose, intravenous antibiotics were administered before cyst puncture. All patients from whom sufficient fluid was aspirated for cytologic analysis and CEA measurement were included.

Diagnostic criteria for pancreatic cystic lesions

Endoscopic ultrasound imaging

A preliminary diagnosis was made after reviewing the demographic and clinical data together with the cyst morphology evaluated with EUS.

Cytology

Cystic fluid was analyzed for mucin and cell morphology. All cytologic analyses were performed or reviewed by an expert pancreatic cytopathologist, and categorized as diagnostic or nondiagnostic. Diagnostic samples had a mucinous epithelium, whereas nondiagnostic samples contained either a nonmucinous epithelium or no epithelial cells. A mucinous epithelium was graded according to epithelial atypia as LR, lowgrade dysplasia (LGD) or intermediate-grade dysplasia (IGD), or HR, high-grade dysplasia (HGD) or invasive carcinoma [5].

Histology

Histologic diagnoses were made using surgical specimens. The resection cohort included cases with histologically confirmed MCNs and IPMNs. All histologic analyses were performed or reviewed by the study pathologist. Ovarian-type stroma was required for a diagnosis of MCN. The resected cystic lesions were categorized according to the World Health Organization classification system [6]. MCNs and IPMNs were classified as LR (LGD or IGD in resection material) or HR (HGD or invasive carcinoma in resection material).

Analysis of cyst fluid carcinoembryonic antigen

Cyst fluid CEA levels were measured using a carbonylmetallo-immunoassay kit (ARCHITECT i2000SR; Abbott Core Laboratory, Abbott Park, IL, USA). A minimum of 0.3mL was required for each analysis.

Data collection

All data were retrospectively collected and recorded in a database. The study group consisted of patients with a final diagnosis based on cytology or specimen histology with a specific diagnosis. Separate receiver operating characteristic (ROC) curves were plotted for cyst fluid CEA levels to differentiate LR-IPMNs from LR-MCNs and HR-IPMNs. The area under the ROC curve (AUROC) was calculated. Sensitivity, specificity, positive predictive value (PPV), and negative predictive value (NPV) were calculated for cyst fluid CEA cutoff levels to maximize the ratio of correct diagnoses of mucinous-subtype PCLs.

Statistical analysis

All statistical analyses were performed using SPSS Statistics software version 25 (IBM Co., Armonk, NY, USA). The Kolmogorov–Smirnov and Shapiro–Wilk tests showed a nonnormal data distribution. Descriptive statistics are presented using medians and ranges for nonnormally distributed and ordinal variables. A comparison of cyst fluid CEA was performed among the four cyst types, LR-MCNs, LR-IPMNs, HR-IPMNs, and cystic PDACs, using the nonparametric Kruskal–Wallis test. When the results of the Kruskal–Wallis test were statistically significant, the four groups were compared in pairs in a total of six comparisons using the Mann–Whitney U test. We used Bonferroni’s adjustment in two groups. The first group included three subgroups (MCNs, IPMNs, and cystic PDACs), and the second group included four subgroups (MCNs, LRIPMNs, HR-IPMNs, and cystic PDACs). Owing to multiple pairwise comparisons, p-values of <0.017 and <0.008, respectively, were required for significance. Data of cyst fluid CEA levels were used to plot two ROC curves to differentiate LRIPMNs from LR-MCNs and HR-IPMNs, and the AUROC was calculated. The AUROC was defined as low (0.5 to <0.7), moderate (0.7 to <0.9), or high (≥0.9). MedCalc Statistical Software version 19.2.5 (MedCalc Software Ltd., Ostend, Belgium; https://www.medcalc.org; 2020) was used to determine the cyst fluid CEA cutoff levels for the accurate diagnostic differentiation of LR-IPMNs from LR-MCNs and HR-IPMNs. A p-value of <0.05 was considered significant.

RESULTS

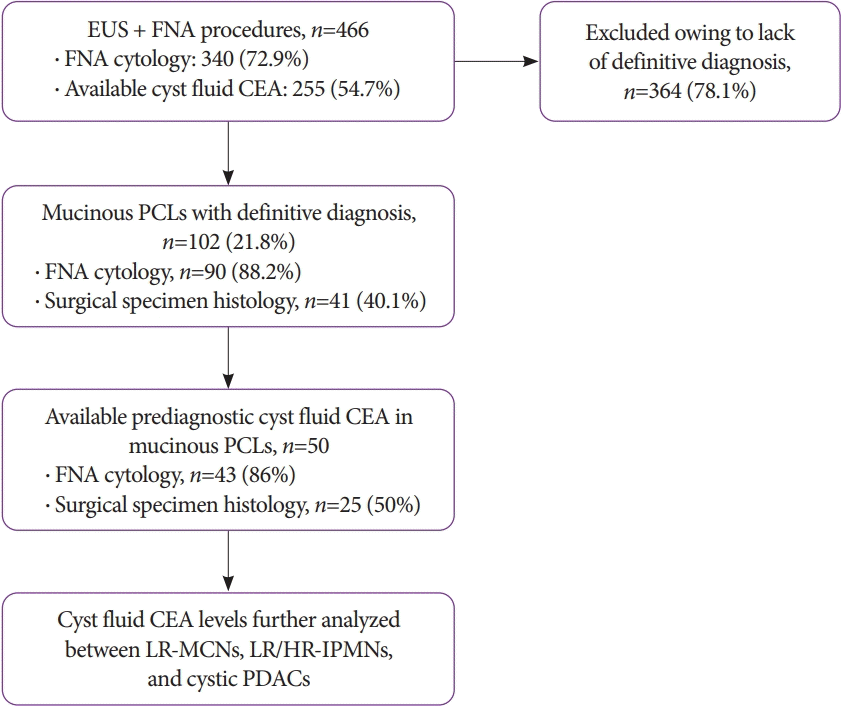
A total of 466 patients with PCLs were evaluated with EUS-FNA over 7 years. Among these, cyst fluid cytology was examined in 340 (72.9%) patients and cyst fluid CEA measurement was available in 255 (54.7%) patients. Diagnosis was based on definitive cytology and/or surgical specimens in 102 mucinous PCLs. Among those 102, 50 had available cyst fluid CEA results (Fig. 1). Table 1 shows the demographic data of the patients.

Cyst fluid carcinoembryonic antigen analysis

Table 2 summarizes the comparative analysis of cyst fluid CEA levels among the different mucinous cyst types. All MCNs (eight LGDs and one IGD) with preoperative cyst fluid CEA results were selected from the surgical specimen series, whereas the remaining cases were diagnosed using cytology or resection material.
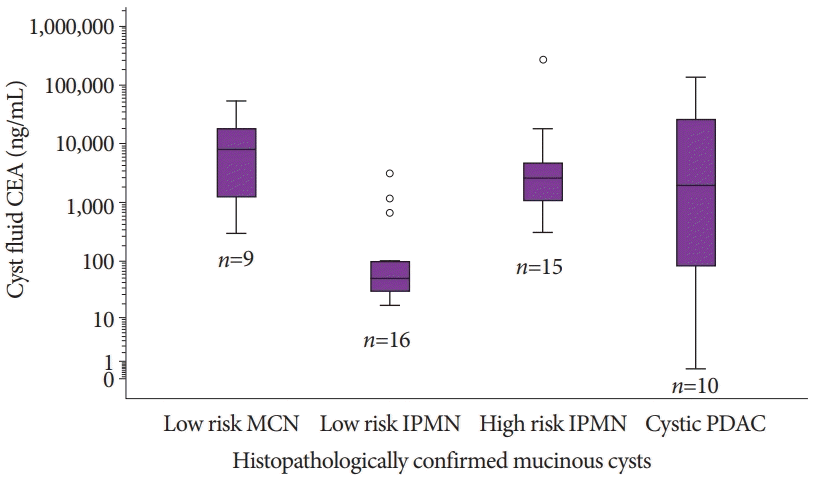
The cyst fluid CEA levels in LR-MCNs (p<0.001) and HR-IPMNs (p<0.001) were significantly higher than those in LR-IPMNs. The cyst fluid CEA level of cystic-PDACs was also higher than that of LR-IPMNs (p=0.02). However, the significance disappeared after Bonferroni’s correction. Fig. 2. shows the distribution of cyst fluid CEA levels among the prespecified cyst types.
The decision to resect a lesion was based on the PCL guidelines in effect from 2011 to 2016 [7,8]. However, cases between 2016 and 2018 were more conservatively managed because of accumulating evidence. Therefore, no LR-IPMNs were resected during the last 2 years of the study. Additionally, resection of most HR-IPMNs (6/8) occurred between 2015 and 2018.
Among the 16 patients with a final diagnosis of LR-IPMN (Table 2), 8 underwent surgery and had a histopathologic diagnosis. In two of the eight patients, the preoperative cyst fluid CEA level was >100ng/mL (664.4 and 3,132.2 ng/mL, respectively), whereas in the remaining six patients, the cyst fluid CEA level was below the cutoff value of ≤100ng/mL (32.7, 33.1, 40.3, 59.5, 77.8, and 100ng/mL) (Table 2). However, the other eight patients in the LR-IPMN group were diagnosed on the basis of cytology and supporting evidence, such as cyst size, mural nodule absence, main pancreatic duct dilatation, cyst fluid CEA level, and cross-sectional imaging findings. Seven patients had cyst fluid CEA levels below the cutoff value (16.8, 19.8, 22.2, 27.5, 43.1, 79, and 100ng/mL). Five patients had at least 1 year of follow-up without evidence of malignant transformation. The other two patients were aged 78 and 80 years, free of symptoms, and diagnosed in the last year of the study. They were clinically followed up without cross-sectional imaging and had no change in their clinical condition. The only patient in the LR-IPMN group with an elevated prediagnostic cyst fluid CEA level (1,167ng/mL) has been followed up for 4 years with no change in cross-sectional imaging findings. However, all HR-IPMNs with surgical specimen histopathology had elevated preoperative cyst fluid CEA levels (818.3, 1,000, 1,159.2, 3311, and 17,797ng/mL).
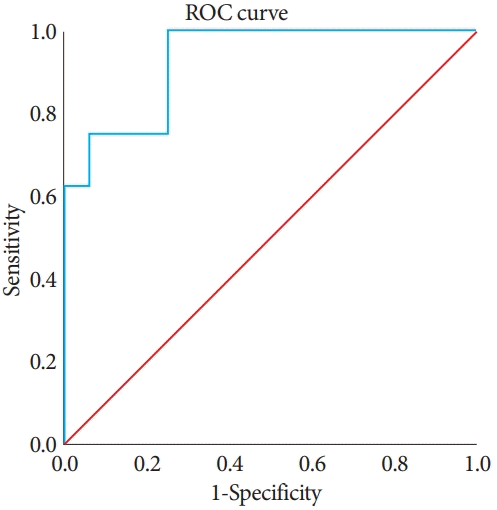
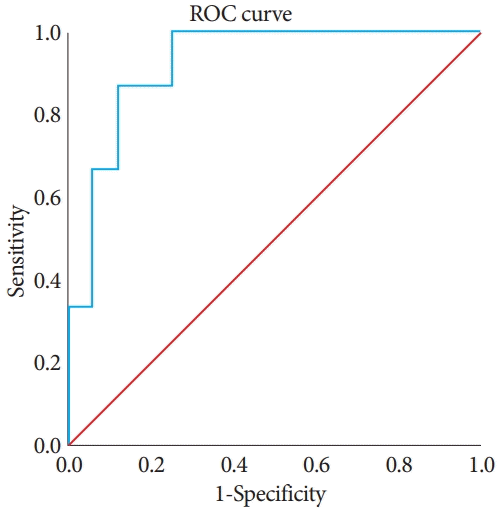
We determined the optimal cutoff level of cyst fluid CEA for differentiating LR-IPMNs from LR-MCNs and HR-IPMNs by using the ROC curve. The AUROC values were 0.93 (95% confidence interval [CI], 0.5–0.8; p<0.001) and 0.92 (95% CI, 0.82–1.0; p<0.001) for differentiating LR-IPMNs from LR-MCNs (Fig. 3) and HR-IPMNs (Fig. 4), respectively. The optimal cutoff level for differentiating LR-IPMNs from LRMCNs and HR-IPMNs was found to be >100ng/mL for both ROC curves. The sensitivity of the cyst fluid CEA cutoff level in differentiating LR-IPMNs from LR-MCNs and HR-IPMNs was 100% and 100%, with a specificity of 75% and 75%, PPV of 66.7% and 78.9%, and NPV of 100% and 100%, respectively.

DISCUSSION

In this retrospective analysis of cyst fluid CEA level to differentiate among the mucinous subtypes of PCLs, we examined cyst fluid CEA levels in cytologically or pathologically diagnosed LR-MCNs, LR/HR-IPMNs, and cystic PDACs. Among the histologically diagnosed mucinous cysts, HR cysts had significantly higher cyst fluid CEA levels than LR cysts (p=0.012). The elevated cyst fluid CEA levels in LR cysts originated from MCNs (Table 2). In subcohort analyses of the 50 mucinous PCLs, cyst fluid CEA levels were significantly higher in LR-MCNs (p<0.001) and HR-IPMNs (p<0.001) than in LR-IPMNs. However, there was no significant difference in cyst fluid CEA levels between LR-MCNs and HR-IPMNs (p>0.05). Further, in the subgroup analyses of the 22 patients with surgical specimens, LR-MCNs (p=0.003) and HR-IPMNs p=0.013) had higher cyst fluid CEA levels than LR-IPMNs, whereas LR-MCNs and HR-IPMNs did not have significantly different cyst fluid CEA levels (p=0.317) (Table 2).
Cross-sectional imaging, EUS with or without FNA, needle-based confocal laser endomicroscopy, and EUS-guided microforceps biopsy are the most frequently used methods for the diagnosis and surveillance of PCLs [9-12]. Japanese, European, and American guidelines for the management of pancreatic cysts do not include cyst fluid CEA level as a parameter for differentiating benign from malignant cysts [13-15]. Table 3 summarizes previous studies that investigated the role of cyst fluid CEA in predicting mucinous cysts and dysplasia. However, a considerable degree of heterogeneity exists among the studies with respect to mucinous cyst groups, such as including MCN and IPMN data, with various dysplasia grades, in the same cohort [16-24]. The 2018 European PCL guidelines stated that differentiating MCNs from IPMNs according to cyst fluid CEA level or cytology was not possible [13], although this statement was not supported with evidence.
Kawai et al. [25], Maire et al. [26], and Oppong et al. [27] observed significantly different cyst fluid CEA levels between LR- and HR-IPMNs. However, Correa-Gallego et al. [28] reported inconsistent results about the ability of cyst fluid CEA levels to distinguish between LR and HR mucinous cysts in a large series of resected IPMNs. In another study by Kucera et al. [29], a significant correlation was reported between cyst fluid CEA level and progressive dysplasia; however, they reported that once invasive carcinoma developed, the cyst fluid CEA levels markedly declined. In addition, a meta-analysis with significant heterogeneity concluded that cyst fluid CEA level was a weak indicator of malignancy [22]. Our data do not support this observation. In this study, HR-IPMNs had significantly higher cyst fluid CEA levels than LR-IPMNs (p<0.001) (Fig. 2, Table 2). A considerable overlap in the range of cyst fluid CEA levels among LR and HR cysts has also been reported [30]. These findings prompted us to determine two cutoff levels for cyst fluid CEA for differentiating LR-IPMNs from HR-IPMNs and LR-MCNs.
The diagnostic ability of a cyst fluid CEA cutoff level to differentiate LR-IPMNs from LR-MCNs and HR-IPMNs had a sensitivity of 100% and 100%, specificity of 75% and 75%, PPV of 66.7% and 78.9%, and NPV of 100% and 100%, respectively. A large variation in the sensitivity and specificity of cyst fluid CEA levels with various cutoff values was observed in earlier studies (Table 3). In the present study, cyst fluid CEA level >100 ng/mL was determined to be the cutoff value for all patients with histopathologically confirmed HR-IPMN. We determined the sensitivity of this cutoff value to be 100%. None of the previous studies that determined a cutoff value reported a sensitivity of 100%. However, we believe that this high sensitivity was due to the separation of HR-IPMNs from cystic PDACs. As shown in Table 2, cyst fluid CEA levels in cystic PDACs ranged from 0.5 to 134,299 ng/mL.
In previous studies, Maire et al. [26] and Hayakawa et al. [31] also found a high NPV (97% and 100%, respectively) for cyst fluid CEA cutoff levels of 200 and 97 ng/mL, respectively. These values were useful in differentiating benign from malignant lesions, as well as in predicting future malignant transformation. Our data support their findings and conclusions. We also calculated a cutoff value (>100 ng/mL) through ROC curve analysis, which has a 100% NPV for differentiating benign from malignant lesions. This finding validates the results of Maire et al. and Hayakawa et al. [26,31] Studies investigating the relationship between preoperative pancreatic juice CEA levels and postoperative dysplasia grade of IPMNs found a significant correlation between high pancreatic juice CEA levels and HR-IPMNs [25,31,32]. However, the main disadvantage of pancreatic juice studies is the risk of pancreatitis.
According to our data, cyst fluid CEA levels were significantly higher in LR-MCNs than in LR-IPMNs. Nagashio et al. [23] defined cutoff levels for differentiating between MCNs and IPMNs for cyst fluid CEA and CA 125 (67.3 ng/mL and 10.0 U/mL, respectively) through ROC curve analysis in 18 IPMNs and 21 MCNs. However, they did not include the histopathologic type of the cysts in their cutoff analysis. In this study, we determined a cutoff level, >100 ng/mL, that could differentiate LR-IPMNs from LR-MCNs with a high AUROC (0.93; 95% CI, 0.5–0.8) by considering the degree of dysplasia of the cysts.
The present study had several limitations. First, this was a single-center, retrospective, observational study that included a relatively small number of patients. Second, IPMNs were not further classified according to subtype but rather by the degree of dysplasia. As data on the histologic subtypes of the IPMNs were not available, the correlation between IPMN subtype, cyst fluid CEA level, and the risk of malignant transformation could not be determined. Third, as we did not have histopathologically verified HR-MCNs with prior cyst fluid CEA results, we were unable to compare the data for resected LRMCNs with those for HR-MCNs.
In conclusion, cyst fluid CEA measurement may be used as a complementary test not only for differentiating mucinous from nonmucinous PCLs, but also for differentiating LR-IPMNs from LR-MCNs and HR-IPMNs. A cyst fluid CEA cutoff level of >100 ng/mL had a 100% NPV for differentiating LR-IPMNs from LR-MCNs and HR-IPMNs.

Notes

Conflicts of Interest: The authors have no potential conflicts of interest.

Funding

None.

Authors’ contribution

Conceptualization: Ibrahim Hakkı Köker

Data curation: IHK, Nurcan Ünver, Fatma Ümit Malya, Elmas Biberci Keskin

Formal analysis: Ömer Uysal

Investigation: IHK, NÜ, FÜM

Methodology: ÖU

Project administration: Hakan Şentürk

Resources: HŞ

Software: ÖU

Supervision: NÜ, FÜM, HŞ

Validation: NÜ,FÜM, HŞ

Visualization: FÜM, EBK, HŞ

Writing-original draft: IHK

Writing-review&editing: IHK, HŞ

ACKNOWLEDGMENTS

We thank our procedure nurses Deniz Akıncı, Ayşe Tezel and Aysel Salman for their dedication.

REFERENCES

1. Zerboni G, Signoretti M, Crippa S, Falconi M, Arcidiacono PG, Capurso G. Systematic review and meta-analysis: prevalence of incidentally detected pancreatic cystic lesions in asymptomatic individuals. Pancreatology. 2019; 19:2–9.
crossref
2. Basturk O, Coban I, Adsay NV. Pancreatic cysts: pathologic classification, differential diagnosis, and clinical implications. Arch Pathol Lab Med. 2009; 133:423–438.
crossref
3. van Huijgevoort NCM, Del Chiaro M, Wolfgang CL, van Hooft JE, Besselink MG. Diagnosis and management of pancreatic cystic neoplasms: current evidence and guidelines. Nat Rev Gastroenterol Hepatol. 2019; 16:676–689.
4. Sentürk H. Management of cystic diseases of the pancreas. Turk J Gastroenterol. 2014; 25:1–18.
crossref
5. Basturk O, Hong SM, Wood LD, et al. A revised classification system and recommendations from the Baltimore consensus meeting for neoplastic precursor lesions in the pancreas. Am J Surg Pathol. 2015; 39:1730–1741.
crossref
6. Adsay NV, Fukushima N, Furukawa T, et al. Intraductal neoplasms of the pancreas. In : Bosman FT, Carneiro F, Hruban RH, Theise ND, editors. WHO classification of tumours of the digestive system. 4th ed. Lyon: International Agency for Research on Cancer;2010. p. 304–313.
7. Tanaka M, Chari S, Adsay V, et al. International consensus guidelines for management of intraductal papillary mucinous neoplasms and mucinous cystic neoplasms of the pancreas. Pancreatology. 2006; 6:17–32.
crossref
8. Tanaka M, Fernández-del Castillo C, Adsay V, et al. International consensus guidelines 2012 for the management of IPMN and MCN of the pancreas. Pancreatology. 2012; 12:183–197.
crossref
9. Senturk H, Köker IH, Keskin EB, Ünver N, Ince AT, Basaranoglu M. Needle based confocal laser endomicroscopy examination of pancreatic cysts: single center real life results. Gastroenterology. 2018; 154(6 Suppl 1):S–528.
10. Basar O, Yuksel O, Yang DJ, et al. Feasibility and safety of microforceps biopsy in the diagnosis of pancreatic cysts. Gastrointest Endosc. 2018; 88:79–86.
crossref
11. Mittal C, Obuch JC, Hammad H, et al. Technical feasibility, diagnostic yield, and safety of microforceps biopsies during EUS evaluation of pancreatic cystic lesions (with video). Gastrointest Endosc. 2018; 87:1263–1269.
crossref
12. Oh SH, Lee JK, Lee KT, Lee KH, Woo YS, Noh DH. The combination of cyst fluid carcinoembryonic antigen, cytology and viscosity increases the diagnostic accuracy of mucinous pancreatic cysts. Gut Liver. 2017; 11:283–289.
crossref
13. Tanaka M, Fernández-Del Castillo C, Kamisawa T, et al. Revisions of international consensus Fukuoka guidelines for the management of IPMN of the pancreas. Pancreatology. 2017; 17:738–753.
crossref
14. European Study Group on Cystic Tumours of the Pancreas. European evidence-based guidelines on pancreatic cystic neoplasms. Gut. 2018; 67:789–804.
15. Elta GH, Enestvedt BK, Sauer BG, Lennon AM. ACG clinical guideline: diagnosis and management of pancreatic cysts. Am J Gastroenterol. 2018; 113:464–479.
crossref
16. Brugge WR, Lewandrowski K, Lee-Lewandrowski E, et al. Diagnosis of pancreatic cystic neoplasms: a report of the cooperative pancreatic cyst study. Gastroenterology. 2004; 126:1330–1336.
crossref
17. van der Waaij LA, van Dullemen HM, Porte RJ. Cyst fluid analysis in the differential diagnosis of pancreatic cystic lesions: a pooled analysis. Gastrointest Endosc. 2005; 62:383–389.
crossref
18. Nagula S, Kennedy T, Schattner MA, et al. Evaluation of cyst fluid CEA analysis in the diagnosis of mucinous cysts of the pancreas. J Gastrointest Surg. 2010; 14:1997–2003.
crossref
19. Park WG, Mascarenhas R, Palaez-Luna M, et al. Diagnostic performance of cyst fluid carcinoembryonic antigen and amylase in histologically confirmed pancreatic cysts. Pancreas. 2011; 40:42–45.
crossref
20. Cizginer S, Turner BG, Bilge AR, Karaca C, Pitman MB, Brugge WR. Cyst fluid carcinoembryonic antigen is an accurate diagnostic marker of pancreatic mucinous cysts. Pancreas. 2011; 40:1024–1028.
crossref
21. Al-Rashdan A, Schmidt CM, Al-Haddad M, et al. Fluid analysis prior to surgical resection of suspected mucinous pancreatic cysts. A single centre experience. J Gastrointest Oncol. 2011; 2:208–214.
22. Ngamruengphong S, Bartel MJ, Raimondo M. Cyst carcinoembryonic antigen in differentiating pancreatic cysts: a meta-analysis. Dig Liver Dis. 2013; 45:920–926.
crossref
23. Nagashio Y, Hijioka S, Mizuno N, et al. Combination of cyst fluid CEA and CA 125 is an accurate diagnostic tool for differentiating mucinous cystic neoplasms from intraductal papillary mucinous neoplasms. Pancreatology. 2014; 14:503–509.
crossref
24. Gaddam S, Ge PS, Keach JW, et al. Suboptimal accuracy of carcinoembryonic antigen in differentiation of mucinous and nonmucinous pancreatic cysts: results of a large multicenter study. Gastrointest Endosc. 2015; 82:1060–1069.
crossref
25. Kawai M, Uchiyama K, Tani M, et al. Clinicopathological features of malignant intraductal papillary mucinous tumors of the pancreas: the differential diagnosis from benign entities. Arch Surg. 2004; 139:188–192.
26. Maire F, Voitot H, Aubert A, et al. Intraductal papillary mucinous neoplasms of the pancreas: performance of pancreatic fluid analysis for positive diagnosis and the prediction of malignancy. Am J Gastroenterol. 2008; 103:2871–2877.
crossref
27. Oppong KW, Dawwas MF, Charnley RM, et al. EUS and EUS-FNA diagnosis of suspected pancreatic cystic neoplasms: is the sum of the parts greater than the CEA? Pancreatology. 2015; 15:531–537.
crossref
28. Correa-Gallego C, Warshaw AL, Fernandez-del Castillo C. Fluid CEA in IPMNs: a useful test or the flip of a coin? Am J Gastroenterol. 2009; 104:796–797.
crossref
29. Kucera S, Centeno BA, Springett G, et al. Cyst fluid carcinoembryonic antigen level is not predictive of invasive cancer in patients with intraductal papillary mucinous neoplasm of the pancreas. JOP. 2012; 13:409–413.
30. Scourtas A, Dudley JC, Brugge WR, Kadayifci A, Mino-Kenudson M, Pitman MB. Preoperative characteristics and cytological features of 136 histologically confirmed pancreatic mucinous cystic neoplasms. Cancer Cytopathol. 2017; 125:169–177.
crossref
31. Hayakawa H, Fukasawa M, Sato T, et al. Carcinoembryonic antigen level in the pancreatic juice is effective in malignancy diagnosis and prediction of future malignant transformation of intraductal papillary mucinous neoplasm of the pancreas. J Gastroenterol. 2019; 54:1029–1037.
crossref
32. Hirono S, Kawai M, Okada KI, et al. Factors associated with invasive intraductal papillary mucinous carcinoma of the pancreas. JAMA Surg. 2017; 152:e165054.
crossref

Fig. 1.
Flowchart of the patients recruited to the study. CEA, carcinoembryonic antigen; EUS, endoscopic ultrasound; FNA, fine-needle aspiration; HR, high risk; IPMN, intraductal papillary mucinous neoplasm; LR, low risk; MCN, mucinous cystic neoplasm; PCL, pancreatic cystic lesion; PDAC, pancreatic ductal adenocarcinoma.
ce-2020-083f1.tif
Fig. 2.
The -axis represents a logarithmic scale (ng/mL) for carcinoembryonic antigen (CEA). Median values are presented as the center lines within every box. The width of each box represents the interquartile range. The whiskers show the minimum and maximum values. Outliers are shown above the boxes. IPMN, intraductal papillary mucinous neoplasm; MCN, mucinous cystic neoplasm; PDAC, pancreatic ductal adenocarcinoma.
ce-2020-083f2.tif
Fig. 3.
Receiver operating characteristic (ROC) curve analysis to differentiate low-risk mucinous cystic neoplasms from low-risk intraductal papillary mucinous neoplasms. A cyst fluid carcinoembryonic antigen cutoff level of >100 ng/mL resulted in an area under the ROC of 0.93 (95% confidence interval, 0.5–0.8).
ce-2020-083f3.tif
Fig. 4.
Receiver operating characteristic (ROC) curve analysis to differentiate high-risk from low-risk intraductal papillary mucinous neoplasms. A cyst fluid carcinoembryonic antigen cutoff level of >100 ng/mL resulted in an area under the ROC of 0.92 (95% confidence interval, 0.82–1.0).
ce-2020-083f4.tif
Table 1.
Baseline Characteristics of All Mucinous Pancreatic Cystic Lesions Diagnosed Using Cytopathology
Mucinous PCLs (n=102)
Cytopathologic diagnosis (total) 102
Gender, femalea) 52 (51.5)
Age, mean±SD (yr) 61.9±13.3
Cyst size, mm, median (min–max) 30 (10–90)
Cyst typea) IPMN: 35 (34.3)
Cystic PDAC: 27 (26.5)
IPMN PDAC: 24 (23.5)
MCN: 16 (15.7)
Cyst locationa)
 Head/uncinate 51 (50)
 Corpus 34 (33.3)
 Tail 15 (14.7)
 Several 2 (0.2)
Patients evaluated using EUS-FNAa) 90 (88.2)
Patients who underwent surgical resectiona) 41 (40.1)

EUS-FNA, endoscopic ultrasound-guided fine-needle aspiration; IPMN, intraductal papillary mucinous neoplasm; MCN, mucinous cystic neoplasm; PCL, pancreatic cystic lesion; PDAC, pancreatic ductal adenocarcinoma; SD, standard deviation.

a) Values are represented as n (%).

Table 2.
Cyst Fluid Carcinoembryonic Antigen Levels in Mucinous Pancreatic Cystic Lesions, Mucinous Pancreatic Cystic Lesion Subcohorts, and Resected Pancreatic Cystic Lesions
Cyst fluid CEA (ng/mL)
n Median range (min–max) p-value
Histologic classification (n=50)
 LR cysts 25 100 16.8–53,445 0.012
 HR cysts 25 2,624 0.5–266,510
Mucinous PCL subcohorts (n=50)
 LR-MCNs 9 7,954.7 299.6–53,445
  Cytology, n=0
  Surgical specimen, n=9
 LR-IPMNs 16 51.3 16.8–3,132.2
  Cytology, n=8
  Surgical specimen, n=8 <0.001a)
 HR-IPMNs 15 2,624 310.3–266,510 <0.001b)/<0.001c)/0.020d)/>0.05e)
  Cytology, n=10
  Surgical specimen, n=5
 Cystic PDAC 10 5,024.4 0.5–134,299
  Cytology, n=7
  Surgical specimen, n=3
Resected LR-MCNs and (LR/HR) IPMNs (n=22)
 LR-MCNs 9 7,954.7 299.6–53,445 0.004a)
 LR-IPMNs 8 68.6 32.7–3,132.2 0.003f), 0.013g), 0.317h)
 HR-IPMNs 5 1,159.2 818.3–17,797

CEA, carcinoembryonic antigen; HR, high risk; IPMN, intraductal papillary mucinous neoplasm; LR, low risk; MCN, mucinous cystic neoplasm; PCL, pancreatic cystic lesion; PDAC, pancreatic ductal adenocarcinoma.

a) Kruskal–Wallis test. Mann–Whitney test:

b) LR-MCN vs. LR-IPMN,

c) LR-IPMN vs. HR-IPMN,

d) LR-IPMN vs. cystic PDAC (not significant after Bonferroni’s correction).

e) Not significant for LR-MCNs vs. cystic PDACs, LR-MCNs vs. HR-IPMNs, and HR-IPMNs vs. cystic PDACs.

f) Surgical specimen LR-MCN vs. LR-IPMN.

g) Surgical specimen LR-IPMN vs. HR-IPMN (significant after Bonferroni’s correction).

h) Surgical specimen LR-MCNs vs. HR-IPMNs.

Table 3.
Previous Studies Investigating the Role of Cyst Fluid Carcinoembryonic Antigen in Predicting Mucinous Cysts and Dysplasia Grade
Study Study design n Surgical pathology FNA/SS/PJ CEA cutoff, ng/mL Sensitivity, specificity, PPV, NPV Conclusion about CEA
Kawai et al. (2004) [25] Case series 27 HR-IPMNs PJ 110 78.0, 91.0, N/A, N/A Differentiate benign from malignant cysts
Brugge et al. (2004) [16] Multicenter case series 68 52 (24 HR) MCNs and 16 (2 HR) IPMNs FNA 192 73.0, 84.0, N/A, N/A Differentiate mucinous from nonmucinous cysts
van der Waaij et al. (2005) [17] Pooled analysis 450 MCA, MCAC, PC, SCA FNA >800 48.0, 98.0, 94.0, 75.0 May help in differentiating benign from premalignant or malignant PCLs
Maire et al. (2008) [26] Case series 41 IPMNs FNA >200 90.0, 71.0, 50.0, 96.0 Differentiate benign from malignant cysts
Correa-Gallego et al. (2009) [28] Case series 72 IPMNs: 55 LR, 17 HR cysts FNA N/A N/A Cannot differentiate benign from malignant cysts
Nagula et al. (2010) [18] Case series 97 MCN (12 LR, 2 HR), IPMN (42 LR, 10 HR), SCA, NET, others FNA >192 73.0, 65.0, 76.0, 53.0 Useful in identification of mucinous cysts
Park et al. (2011) [19] Case series 126 Various cysts (104 resection, 22 biopsy or cytology); MCN, IPMN, mucin cancers, including PDAC, SCA, PC, PNET, and others FNA ≥200 60.0, 93.0, N/A, N/A CEA is not diagnostic for differentiating benign from malignant mucinous cysts
Cizginer et al. (2011) [20] Case series 198 MCNs and IPMNs with heterogeneous histologic grade; 166 (resection), 26 (biopsy), and 4 malignant (cytology) FNA 109.9 80.9, 97.7, N/A, N/A Does not distinguish benign from malignant cysts
Al-Rashdan et al. (2011) [21] Case series 25 9 MCNs, 11 (1 ICA, 5 HGD) BD-IPMNs, 5 (1 ICA) MDIPMNs FNA N/A N/A Of limited value in the differential diagnosis of mucinous pancreas cysts
Kucera et al. (2012) [29] Case series 47 IPMN FNA >200 52.4, 42.3, 42.3, 52.4 CEA is a poor predictor of malignant IPMN
Ngamrueng- phong et al. (2013) [22] Meta-analysis 504 MCN, IPMN, PC, SCN, MCA, MCAC FNA 109.9–6,000 N/A Poor ability to distinguish benign from malignant cysts
Nagashio et al. (2014) [23] Case series 68 IPMN (18), MCN (21), SCN (15), PC (10), EC (2), LC (1), SPN (1) FNA/SS >67.3 89.2, 77.8, N/A, N/A Helpful in differentiating mucinous from nonmucinous lesions but not malignant from benign
Gaddam et al. (2015) [24] Multicenter case series 226 150 mucinous (43 with PDAC) / 76 nonmucinous (29 SCN) FNA 105 70.0, 63.0, N/A, N/A Suboptimal in differentiating mucinous from nonmucinous PCLs
Oppong et al. (2015) [27] Case series 119 79 mucinous, 40 nonmucinous cysts FNA >7 94, 75, N/A, N/A Distinguishes mucinous from nonmucinous and HR from LR cysts
Scourtas et al. (2017) [30] Case series 54 MCN FNA N/A N/A No conclusion about CEA but higher cyst fluid CEA levels detected in HR cysts
Oh et al. (2017) [12] Case series 48 16 MCNs, 13 IPMNs, 19 nonmucinous cysts FNA 48.6 72.4, 94.7, N/A, N/A Combination of cyst fluid CEA, cytology, and viscosity increased the overall diagnostic accuracy of mucinous cysts
Hirono et al. (2017) [32] Case series 140 51 MD, 89 mixed IPMNs PJ 150 for mixed, 300 for MD 73.3, 69.5, 55.0, 83.7 May predict ICA in MD and mixed IPMNs
79.0, 87.5, 79.0, 87.5
Hayakawa et al. (2019) [31] Case series 63 IPMN PJ 97 45.0,100.0, 65.0, 100.0 Useful in diagnosis of HR-IPMNs and in predicting future malignant transformation

BD, branch duct; CEA, carcinoembryonic antigen; EC, epidermoid cyst; FNA, fine-needle aspiration; HGD, high-grade dysplasia; HR, high risk; ICA, invasive carcinoma; IPMN, intraductal papillary mucinous neoplasm; LC, lymphoepithelial cyst; LR, low risk; MCA, mucinous cystadenoma; MCAC, mucinous cystadenocarcinoma; MCN, mucinous cystic neoplasm; MD, main duct; N/A, not available; NET, neuroendocrine tumor; NPV, negative predictive value; PC, pseudocyst; PCL, pancreatic cystic lesion; PDAC, pancreatic ductal adenocarcinoma; PJ, pancreatic juice; PNET, pancreatic neuroendocrine tumor; PPV, positive predictive value; SCA, serous cyst adenoma; SCN, serous cystic neoplasia; SPN, solid pseudopapillary neoplasm; SS, surgical specimen.

TOOLS
Similar articles