INTRODUCTION
MATERIALS AND METHODS
Participants
Swallowing function assessment
Pulmonary function assessment
Statistical analysis
RESULTS
General characteristics and clinical features
Table 1.
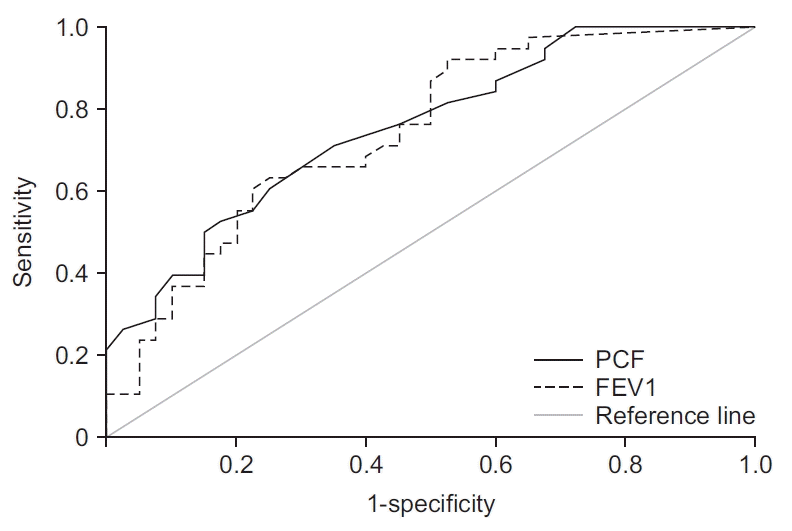
Correlation between pulmonary and swallowing function parameters in CSCI
Table 2.
| Pulmonary function parameters |
PAS |
PRG |
||
|---|---|---|---|---|
| Correlation coefficients | p-value | Correlation coefficients | p-value | |
| TV | -0.243 | 0.032* | -0.275 | 0.015* |
| FVC | -0.441 | 0.000* | -0.432 | 0.000* |
| FEV1 | -0.470 | 0.000* | -0.543 | 0.000* |
| MIP | -0.394 | 0.000* | -0.430 | 0.000* |
| MEP | -0.363 | 0.001* | -0.294 | 0.009* |
| PCF | -0.488 | 0.000* | -0.484 | 0.000* |
Comparison between the PA and non-PA groups
Table 3.
| Variable | Penetration-aspiration (n=40) | Non-penetration- aspiration (n=38) | p-value |
Multivariate analysis |
|
|---|---|---|---|---|---|
| β coefficient | p-value | ||||
| Age (yr) | 64.03±11.08 | 52.89±17.36 | 0.001* | 0.279 | 0.002* |
| Sex | 0.083 | - | |||
| Male | 38 (95.0) | 31 (81.6) | |||
| Female | 2 (5.0) | 7 (18.4) | |||
| Tracheostomy | 0.001* | 0.085 | 0.392 | ||
| Positive | 26 (65.0) | 11 (28.95) | |||
| Negative | 14 (35.0) | 27 (71.05) | |||
| Surgery | 0.005* | 0.349 | 0.000* | ||
| Anterior approach | 22 (55.0) | 9 (23.68) | |||
| Others | 18 (45.0) | 29 (86.32) | |||
| Neurological level of injury | 0.01* | 0.242 | 0.012* | ||
| Upper (C1–C4) | 32 (80.0) | 20 (52.63) | |||
| Lower (C5–C8) | 8 (20.0) | 18 (47.37) | |||
| ASIA impairment scale | 0.375 | - | |||
| A | 21 (52.5) | 16 (42.11) | |||
| B, C, or D | 19 (47.5) | 22 (57.89) | |||
| TV (L) | 0.43±0.16 | 0.47±0.16 | 0.248 | - | |
| FVC (%pred) | 40.63±22.85 | 48.96±24.06 | 0.004* | 0.181 | 0.294 |
| FEV1 (%pred) | 39.42±28.59 | 47.52±29.01 | 0.000* | -0.187 | 0.308 |
| MIP (cmH2O) | 25.73±19.88 | 48.68±29.56 | 0.000* | 0.020 | 0.901 |
| MEP (cmH2O) | 20.28±17.82 | 41.39±31.71 | 0.001* | -0.061 | 0.682 |
| PCF (L/min) | 107.25±87.06 | 215.79±123.39 | 0.000* | -0.398 | 0.017* |
Values are presented as mean±standard deviation or number (%).
ASIA, American Spinal Injury Association; %pred, percentage of predicted normal; TV, tidal volume; FVC, forced vital capacity; FEV1, forced expiratory volume in one second; MIP, maximal inspiratory pressure; MEP, maximal expiratory pressure; PCF, peak cough flow.
Comparison between the pharyngeal and non-pharyngeal residue groups
Table 4.
| Variable | Pharyngeal residue group (n=37) | Non-pharyngeal reside group (n=41) | p-value |
Multivariate analysis |
|
|---|---|---|---|---|---|
| β coefficient | p-value | ||||
| Age (yr) | 64.24±13.16 | 53.51±15.71 | 0.002* | 0.279 | 0.002* |
| Sex | 0.487 | - | |||
| Male | 34 (94.89) | 35 (85.37) | |||
| Female | 3 (8.11) | 6 (14.63) | |||
| Tracheostomy | 0.001* | 0.144 | 0.154 | ||
| Positive | 25 (67.57) | 12 (29.27) | |||
| Negative | 12 (32.43) | 29 (70.73) | |||
| Surgery | 0.001* | 0.403 | 0.000* | ||
| Anterior approach | 22 (59.46) | 9 (21.95) | |||
| Others | 15 (40.54) | 32 (78.05) | |||
| AIS level of injury | 0.01* | 0.233 | 0.016* | ||
| Upper (C1–C4) | 30 (81.08) | 22 (53.66) | |||
| Lower (C5–C8) | 7 (18.92) | 19 (46.34) | |||
| ASIA impairment scale | 0.173 | - | |||
| A | 21 (56.76) | 16 (39.02) | |||
| B, C, or D | 16 (43.24) | 25 (60.98) | |||
| TV (L) | 0.42±0.17 | 0.48±0.15 | 0.070 | - | |
| FVC (%pred) | 37.66±24.07 | 49.55±23.82 | 0.000* | -0.090 | 0.604 |
| FEV1 (%pred) | 36.28±27.05 | 48.03±28.85 | 0.000* | -0.206 | 0.026* |
| MIP (cmH2O) | 25.51±21.97 | 47.20±28.06 | 0.000* | -0.105 | 0.518 |
| MEP (cmH2O) | 22.70±22.99 | 37.66±29.55 | 0.016* | 0.136 | 0.364 |
| PCF (L/min) | 110.00±102.25 | 205.37±115.67 | 0.000* | -0.110 | 0.503 |
Values are presented as mean±standard deviation or number (%).
ASIA, American Spinal Injury Association; %pred, percentage of predicted normal; TV, tidal volume; FVC, forced vital capacity; FEV1, forced expiratory volume in one second; MIP, maximal inspiratory pressure; MEP, maximal expiratory pressure; PCF, peak cough flow.


 PDF
PDF Citation
 Print
Print


 XML Download