INTRODUCTION
MATERIALS AND METHODS
Subjects and data collection
Ultrasonographic measurements
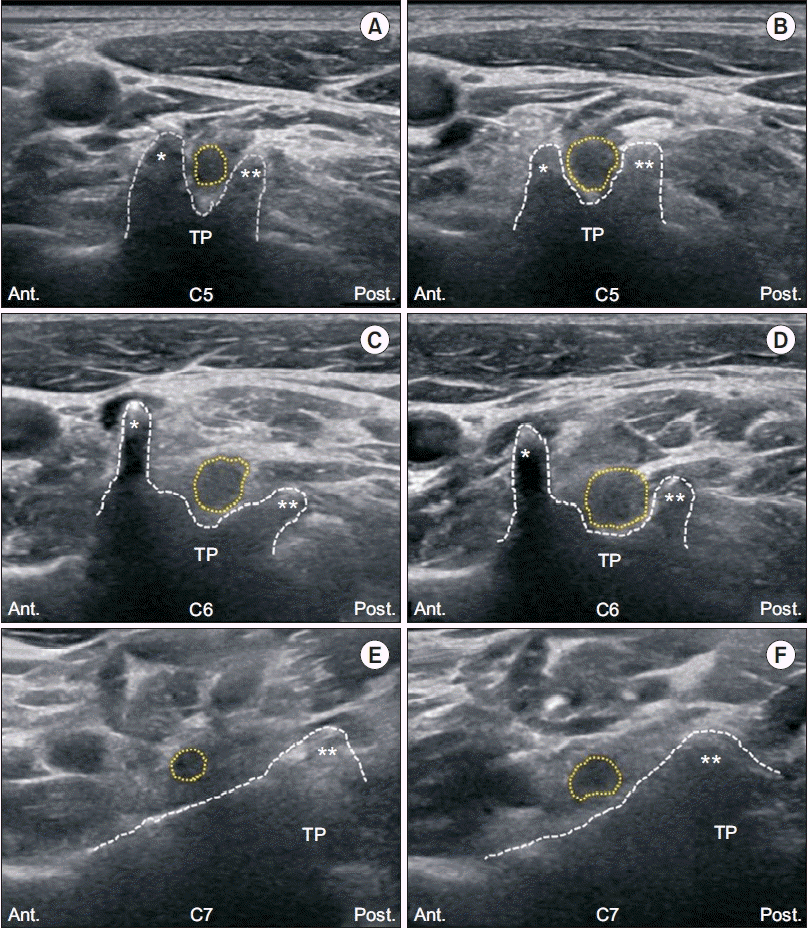
 | Fig. 1.Transverse ultrasonographic images of the cervical nerve root. (A, C, E) Unaffected side of the C5, C6, and C7 nerve roots, respectively. (B, D, F) Affected side of the C5, C6, and C7 nerve roots, respectively. Ant., anterior; Post., posterior; TP, transverse process; *, anterior tubercle; **, posterior tubercle; dotted circle, nerve root; dotted line, shape of the tubercles of the cervical spine. |
Statistical analysis
Table 1.
Table 2.
| CSA (mm²) |
CR-A |
CR-B |
p-value (affected vs. unaffected) |
|||
|---|---|---|---|---|---|---|
| Affected side | Unaffected side | Affected side | Unaffected side | CR-A | CR-B | |
| C5 NR | 11.21 (9.98–12.63) | 7.87 (6.85–9.11) | 10.96 (9.45–11.55)a) | 8.11 (7.63–8.67)a) | 0.016* | 0.036* |
| C6 NR | 13.32 (12.27–14.68) | 10.05 (9.64–10.77) | 12.81 (11.94–13.88) | 10.62 (9.61–11.95) | 0.022* | 0.031* |
| C7 NR | 14.80 (13.57–15.74) | 11.83 (10.31–13.04) | 13.54 (12.43–4.77) | 12.49 (11.67–13.64) | 0.027* | 0.043* |
Table 3.
| ΔCSA (mm²) |
S-S difference |
S-S ratio |
p-value |
|||
|---|---|---|---|---|---|---|
| CR-A | CR-B | CR-A | CR-B | S-S difference | S-S ratio | |
| C5 NR | 3.33 (2.95–3.67) | 2.85 (1.82–2.88)a) | 1.42 (1.24–1.62) | 1.33 (1.24–1.35)a) | 0.021* | 0.038* |
| C6 NR | 2.61 (2.24–2.97) | 2.36 (1.95–2.68) | 1.30 (1.13–1.49) | 1.11 (1.05–1.17) | 0.045* | 0.035* |
| C7 NR | 3.05 (2.60–3.24) | 1.45 (1.03–1.84) | 1.26 (1.15–1.38) | 1.12 (1.05–1.23) | 0.012* | 0.044* |
Values are presented are median (interquartile range).
CSA, cross-sectional area; CR-A, cervical radiculopathy group A; CR-B, cervical radiculopathy group B; S-S difference, difference in CSAs between the affected and unaffected sides; S-S ratio, ratio of the CSAs between the unaffected and affected sides; NR, nerve root.


 PDF
PDF Citation
 Print
Print


 XML Download