INTRODUCTION
MATERIALS AND METHODS
Participants
Videofluoroscopic swallowing study
Kinematic analysis
Statistical analysis
RESULTS
Patient characteristics
Table 1.
Table 2.
| Not improved (n=14) | Improved (n=21) | Well-maintained (n=34) | p-value | |
|---|---|---|---|---|
| Ages (yr) | 65.0±8.3 | 64.1±15.4 | 69.6±12.4 | 0.24a) |
| Sex | 0.03b) | |||
| Male | 12 (86) | 15 (71) | 16 (47) | |
| Female | 2 (14) | 6 (29) | 18 (53) | |
| Type of stroke | 0.23c) | |||
| Ischemic | 10 (71) | 13 (62) | 28 (82) | |
| Hemorrhagic | 4 (29) | 8 (38) | 6 (18) | |
| Location of lesion | 0.06c) | |||
| Supratentorial | 6 (43) | 17 (81) | 25 (74) | |
| Infratentorial | 8 (57) | 4 (19) | 9 (26) | |
| Side of lesion in the brain | 0.04c) | |||
| Right side | 7 (50) | 9 (43) | 21 (62) | |
| Left side | 4 (29) | 8 (38) | 13 (38) | |
| Bilateral | 3 (21) | 4 (19) | 0 (0) | |
| Post-stroke day at the initial VFSS | 29.0±15.1 | 28.1±16.5 | 28.4±12.9 | 0.41d) |
| Post-stroke day at the follow-up VFSS | 67.2±53.5 | 126.1±111.1 | 117.7±97.8 | 0.11d) |
| Interval between the 2 studies (day) | 38.2±49.8 | 98.0±106.3 | 89.3±96.1 | 0.55d) |
Comparisons of kinematic variables
Table 3.
| Not improved | Improved | Well-maintained | p-value | |
|---|---|---|---|---|
| Initial study | ||||
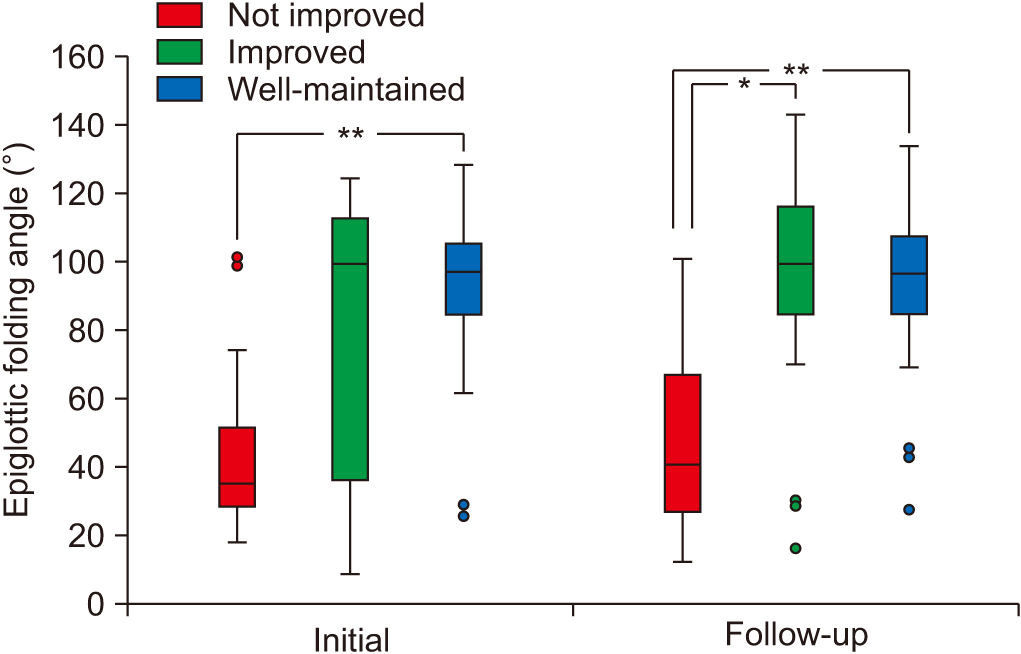
| VDS | 42.89±13.70 | 40.45±15.45 | 24.37±11.63** | <0.001a) |
| EA (°) | 45.03±27.07 | 76.10±41.41 | 94.28±19.04* | 0.001a) |
| MaxHH (mm) | 10.99±3.44 | 10.01±3.29 | 9.32±6.30 | 0.58b) |
| MaxHV (mm) | 15.04±4.93 | 13.53±6.05 | 11.56±4.31 | 0.08a) |
| MaxVH (mm) | 5.75±1.52 | 5.20±2.46 | 5.95±2.86 | 0.42a) |
| MaxVV (mm) | 22.88±5.26 | 20.85±6.82 | 21.58±6.09 | 0.64b) |
| Follow-up study | ||||
| VDS | 51.36±12.09 | 29.81±10.94* | 21.62±13.18** | <0.001a) |
| EA (°) | 46.97±26.38 | 90.25±37.20* | 95.83±19.77* | <0.001a) |
| MaxHH (mm) | 9.98±2.43 | 10.58±3.54 | 8.73±6.13 | 0.37b) |
| MaxHV (mm) | 14.76±6.97 | 14.14±4.54 | 11.42±5.21 | 0.07a) |
| MaxVH (mm) | 5.11±2.25 | 7.03±3.37 | 5.83±2.49 | 0.21a) |
| MaxVV (mm) | 21.57±7.12 | 21.57±5.25 | 20.89±6.73 | 0.91b) |
Values are mean±standard deviation.
VDS, Videofluoroscopic Dysphagia Scale; EA, epiglottic folding angle; MaxHH, maximal horizontal movement of hyoid bone; MaxHV, maximal vertical movement of hyoid bone; MaxVH, maximal horizontal movement of vocal cord; MaxVV, maximal vertical movement of vocal cord.
Change of epiglottic folding angle
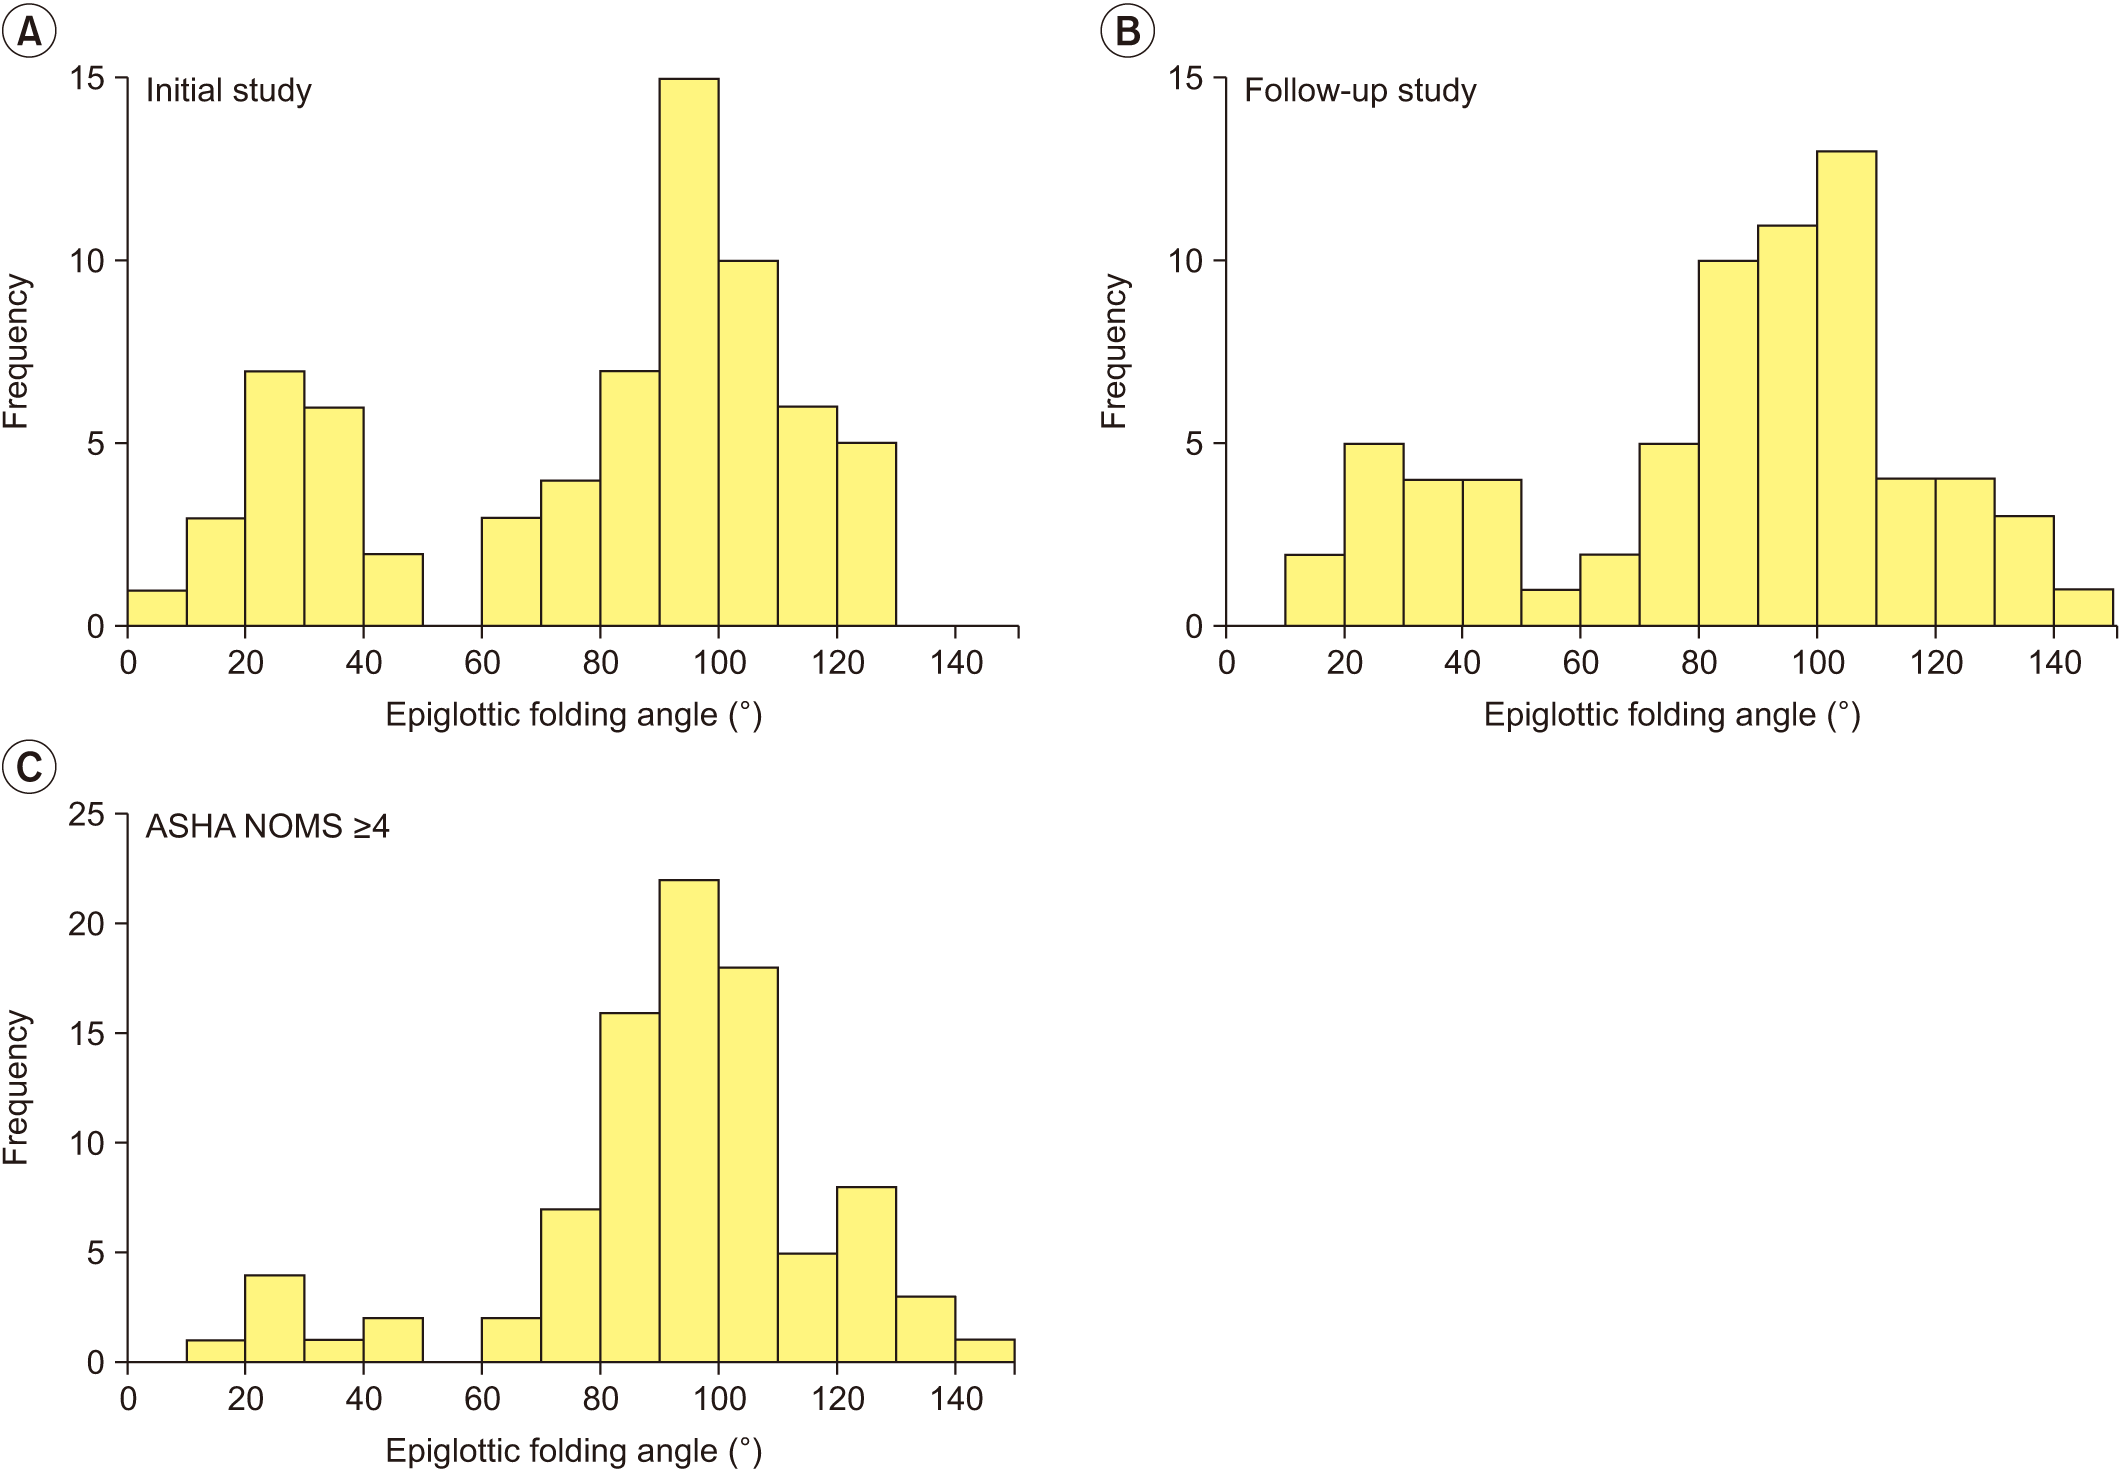
 | Fig. 2.Distribution of epiglottic folding angle at (A) initial study and (B) follow-up study. Both histograms show a definite dichotomous pattern of distribution. (C) Data from follow-up study of “improved” group and both studies of “well-maintained” group are gathered to show the distribution of epiglottic folding angle among patients suitable for oral feeding. |
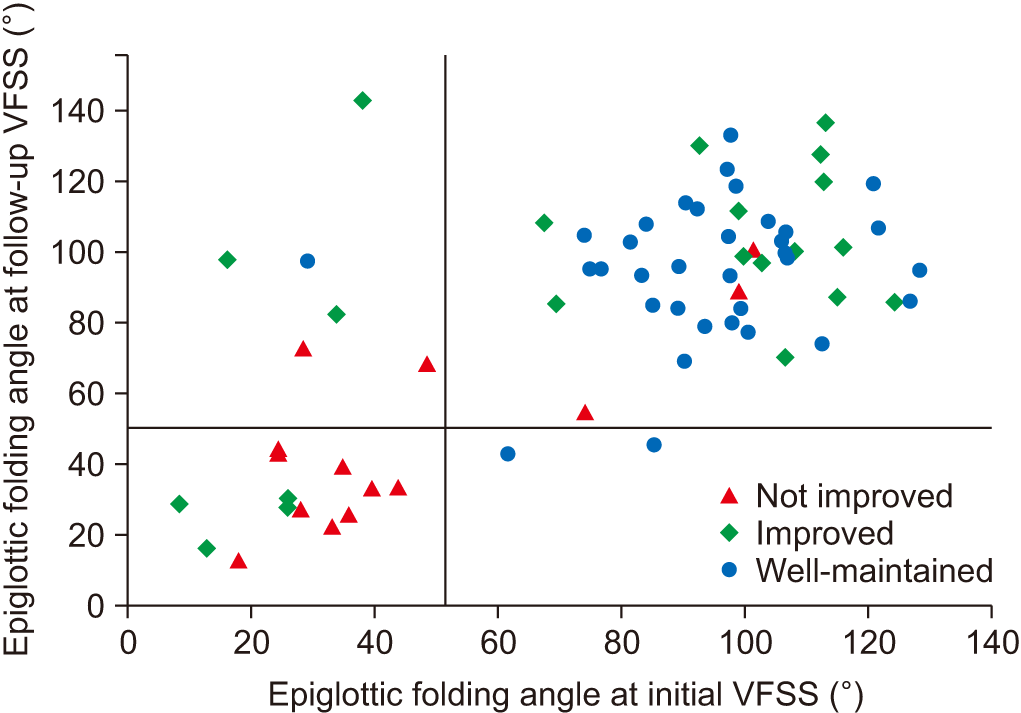
 | Fig. 3.A scatter plot of the epiglottic folding angle at initial and follow-up studies. Vertical and horizontal auxiliary lines are at 51.41°. Nine out of 14 patients in “not improved” group have low angles of epiglottic folding, while 31 out of 34 patients of “well-maintained” group have high angles of epiglottic folding in both studies. |
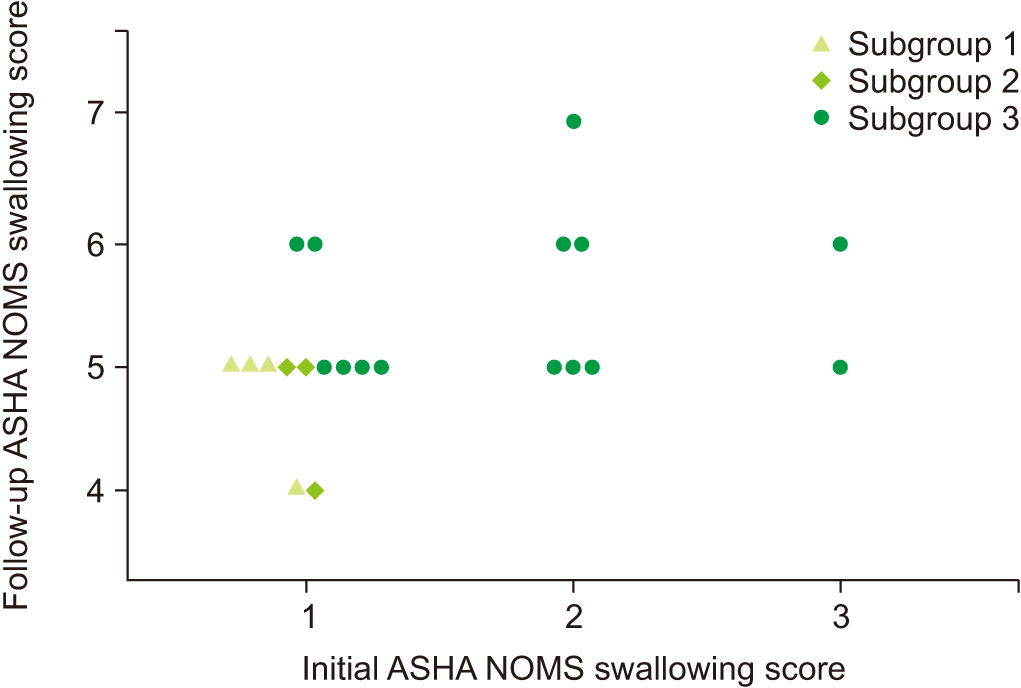
 | Fig. 4.Change of diet in “improved” group patients between the initial and follow-up studies. Based on the change of epiglottic folding angle, the patients are grouped into 3 subgroups: subgroup 1, epiglottic folding angles of the 2 studies are lower than 51.41°; subgroup 2, epiglottic folding angle is lower than 51.41° in the initial study, but improved to higher range in follow-up study; subgroup 3, epiglottic folding angle is higher than 51.41° at the initial study. It shows that the higher epiglottic folding angle is associated with less limitation on a diet. ASHA NOMS, American Speech-Language-Hearing Association National Outcome Measurement System. |


 PDF
PDF Citation
 Print
Print


 XML Download