INTRODUCTION
MATERIALS AND METHODS
Subjects
CBCR program
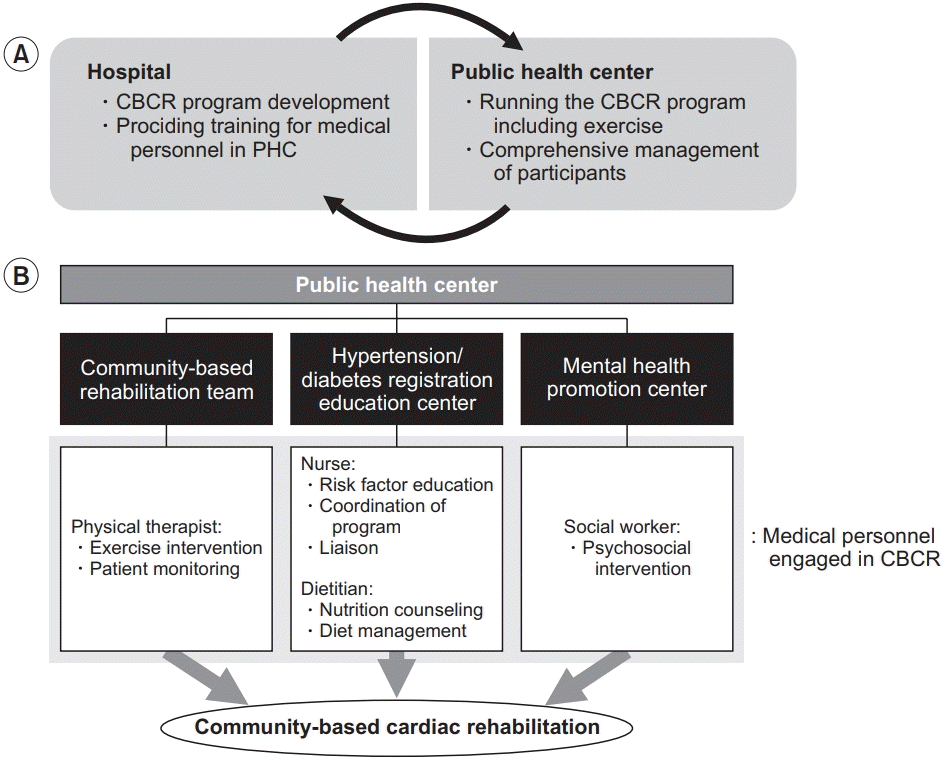
 | Fig. 1.(A) Relationship between the hospital and public health center as well as their roles in community-based cardiac rehabilitation (CBCR). (B) Medical personnel of the public health center (PHC) in Hongcheon-gun. |
 | Fig. 2.The public health center in Hongcheon-gun. (A) Meeting room for education program. (B) Exercise room (area, approximately 50 m2) and equipment (4 stationary bikes, 10 gym balls, and 20 elastic bands) for the exercise program. (C) Adjacent park where the 6-minute walk distance test was conducted. |
Table 1.
Outcome measurements
Statistical analysis
RESULTS
Characteristics of subjects
Table 2.
| All (n=21) |
Old female adult groups (n=17) |
|||
|---|---|---|---|---|
| Young-old, 65–74 yr (n=8) | Old-old, ≥75 yr (n=9) | p-value | ||
| Age (yr) | 75.0±7.8 (52–88) | 70.8±2.4 (66–74) | 79.6±3.1 (75–86) | - |
| Sex, female | 18 (85.7) | - | - | - |
| Height (cm) | 154.26±6.04 (141.6–166.9) | 154.73±5.02 (146.4–160.6) | 151.13±5.43 (141.6–157.8) | 0.236f) |
| Body mass (k) | 59.55±11.29 (37.5–80.1) | 66.51±11.00 (45.5–80.1) | 52.16±9.41 (37.5–64.6) | 0.006f) |
| BMI (kg/m2) | 24.88±3.74 (18.7–31.1) | 27.69±3.64 (19.3–31.1) | 22.69±3.07 (18.7–27.3) | 0.006f) |
| Waist circumference (cm) | 86.7±11.0 (68–109) | 92.88±11.09 (70–109) | 80.44±9.18 (68–94) | 0.018f) |
| Resting SBP (mmHg) | 130.5±12.6 (105–150) | 129.3±9.0 (117–140) | 126.0±14.3 (105–145) | 0.773f) |
| Resting DBP (mmHg) | 73.2±11.2 (49–92) | 78.8±6.9 (70–89) | 68.1±12.9 (49–92) | 0.038f) |
| Resting HR (bpm) | 75.0±6.8 (67–90) | 74.8±6.8 (67–85) | 77.1±7.9 (68–90) | 0.630f) |
| Myocardial infarction | 1 (6.3) | 1 (12.5) | 0 (0) | 0.274g) |
| Diabetes mellitus | 10 (47.6) | 3 (37.5) | 5 (55.6) | 0.457h) |
| Risk factors | ||||
| Agea) | 20 (95.2) | 8 (100) | 9 (100) | |
| Obesityb) | 12 (57.1) | 7 (87.5) | 4 (44.4) | |
| Hypertension | 16 (76.2) | 5 (62.5) | 7 (77.8) | |
| Dyslipidemiac) | 11 (52.4) | 3 (37.5) | 6 (66.7) | |
| Prediabetesd) | 4 (19) | 2 (25) | 1 (11.1) | |
| High HDL-Ce) | 4 (19) | 1 (12.5) | 3 (33.3) | |
| Number of risk factors | 2.81±0.93 (1–5) | 3.00±0.93 (2–5) | 2.69±1.00 (1–4) | 0.606f) |
Values are presented as mean±standard deviation (range) or number (%).
BMI, body mass index; SBP, systolic blood pressure; DBP, diastolic blood pressure; HR, heart rate; HDL-C, high-density lipoprotein cholesterol.
Outcomes of CBCR
Table 3.
| T0 | T1 | T2 | Fa) | p-value |
p-value of post hocb) |
|||
|---|---|---|---|---|---|---|---|---|
| T0–T1 | T0–T2 | T1–T2 | ||||||
| BMI (kg/m2) | 24.88±3.74 | 24.58±3.72 | 24.56±3.75 | 7.800 | 0.001 | 0.006 | 0.003 | 0.974 |
| SBP (mmHg) | 130.5±12.6 | 128.9±10.3 | 128.4±7.6 | 0.271 | 0.764 | - | - | - |
| Fasting blood sugar (mg/dL) | 127.7±26.7 | 115±21.3 | 106.8±13.0 | 13.400 | <0.001c) | 0.009 | <0.001 | 0.120 |
| HbA1c (%) | 7.15±1.39 | 7.00±1.04 | 6.73±1.24 | 2.150 | 0.130 | - | - | - |
| Total cholesterol (mg/dL) | 161.8±41.5 | 178.9±50.3 | 168.0±53.3 | 4.350 | 0.020 | 0.016 | 0.547 | 0.164 |
| LDL-C (mg/dL) | 85.8±37.0 | 88.7±41.5 | 85.4±39.3 | 0.173 | 0.842 | - | - | - |
| HDL-C (mg/dL) | 51.7±17.4 | 55.7±13.6 | 53.1±15.0 | 1.920 | 0.160 | - | - | - |
| Triglyceride (mg/dL) | 119.4±83.1 | 157.8±82.2 | 125.1±59.0 | 2.660 | 0.082 | - | - | - |
| EQ-5D-3L index | 0.868±0.084 | 0.862±0.074 | 0.881±0.079 | 0.930 | 0.403 | - | - | - |
| IPAQ (MET-minute per week) | 1,596.8±1,044.5 | 2,568.9±1,572.5 | 2,366.1±1,489.5 | 3.150 | 0.054 | - | - | - |
| KASI score | 42.4±12.36 | 48.23±11.98 | 49.01±11.04 | 3.120 | 0.055 | - | - | - |
| 6MWD (m) | 461.25±39.43 | 498.41±45.44 | 520.44±53.34 | 25.100 | <0.001 | <0.001 | <0.001 | 0.033 |
| Estimated VO2max (mL/kg/min) | 15.56±0.91 | 16.41±1.05 | 16.92±1.23 | 25.100 | <0.001 | <0.001 | <0.001 | 0.033 |
Values are presented as mean±standard deviation.
BMI, body mass index; SBP, systolic blood pressure; HbA1c, hemoglobin A1c; LDL-C, low-density lipoprotein cholesterol; HDL-C, high-density lipoprotein cholesterol; EQ-5D-3L, the European Quality of Life-5 Dimension-3-Level version; IPAQ, the International Physical Activity Questionnaire; KASI, the Korean Activity Scale/Index; 6MWD, 6-minute walk distance.
Young-old (65–74 years) versus old-old (≥75 years) women
 | Fig. 4.Changes in (A) body mass index (BMI), (B) fasting blood sugar (FBS), and (C) 6-minute walk distance (6MWD) between young-old and old-old women. |
Table 4.
| T0 | T2 | p-valuea) | ΔT2–T0 | p-valueb) | |
|---|---|---|---|---|---|
| BMI (kg/m2) | 0.815 | ||||
| Young | 27.7±1.29 | 27.5±1.31 | 0.195 | -0.24±0.14 | |
| Old | 22.7±1.02 | 22.6±1.00 | 0.369 | -0.14±0.17 | |
| Fasting blood sugar (mg/dL) | 0.962 | ||||
| Young | 134.9±11.89 | 114.4±6.05 | 0.039 | -20.50±9.22 | |
| Old | 123.4±6.87 | 104.3±2.35 | 0.015 | -19.11±6.24 | |
| 6MWD (m) | 0.277 | ||||
| Young | 461.4±14.46 | 536.4±19.01 | 0.008 | 75.03±13.69 | |
| Old | 461.2±14.91 | 519.9±16.48 | 0.008 | 58.77±11.86 |


 PDF
PDF Citation
 Print
Print


 XML Download