Abstract
Objective
To demonstrate the effects of chin-down maneuver on swallowing by using high-resolution manometry (HRM).
Methods
HRM data of 20 healthy subjects and 64 dysphagic patients were analyzed. Participants swallowed 5 mL of thin and honey-like liquids in neutral and chin-down positions. HRM was used to evaluate maximal velopharyngeal pressure/area, maximal tongue base pressure/area, maximal pharyngeal constrictor pressure, pre-/post-swallow upper esophageal sphincter (UES) peak pressure, minimal UES pressure, UES activity time, and nadir duration.
Results
Compared to the neutral position, the chin-down maneuver significantly increased tongue base pressure in both normal and dysphagic groups as well as for both honey-like and thin viscosities, although the honey-like liquid did not reach statistical significance in the dysphagic group. Regarding pharyngeal constrictors and pre-swallow peak UES pressure, the healthy group showed a significant decrease in thin liquid swallowing and decreasing tendency in honeylike liquid swallowing. UES nadir duration was significantly decreased for honey-like liquid swallowing in the dysphagic group and for both thin and honey-like liquids in the healthy group. UES nadir duration of honey-like and thin flow swallowing in the dysphagia group was 0.26 seconds after the chin-down maneuver, which was severely limited.
Conclusion
This study showed a different kinetic effect of the chin-down maneuver between the healthy and dysphagic groups, as well as between thin and honey-like viscosities. The chin-down maneuver increased tongue base pressure and decreased UES nadir duration, which the latter was severely limited in dysphagic patients. Therefore, appropriate application of the chin-down maneuver in clinical practice is required.
The chin-down maneuver has been applied widely to reduce the risk of laryngeal penetration or aspiration [1,2]. Early videofluoroscopic swallowing study (VFSS) showed that widening of the vallecular space allows for greater capacity of holding pre-swallow spillage and pre-swallow aspiration. Moreover, the maneuver induces narrowing of the distance between the base of the tongue and the posterior pharyngeal wall, improving airway protection and increasing pressure on the bolus for descent [3].
Although the chin-down maneuver has had clinical popularity, the protective mechanism has not been clearly defined to date, and the clinical effect has not always been dramatic. A recent study reported that only half of the patients with neurologically involved dysphagia were able to reduce aspiration via the chin-down maneuver [4,5]. Another study suggested that using the maneuver with thin liquids was not effective in preventing aspiration compared with using thick liquids alone [6].
Nowadays, high-resolution manometry (HRM) is commonly used for the evaluation of oropharyngeal dysphagia [7,8]. A few HRM studies reported negative (reduction) effects on pharyngeal maximal pressure during the chindown maneuver, suggesting that the chin-down maneuver would make swallowing worse for patients with weak pharyngeal constrictor muscles [2,9]. However, the results are hard to generalize because the studies were performed only with thin liquid on healthy subjects [2,10,11]. In addition, little is known about the influence of the chin-down maneuver with various pharyngeal structures and various viscosity diets. It is common for patients with dysphagia to be on viscosity-controlled diets, such as honey- or nectar-like diets. Thus, it is essential to clarify the effects of the chin-down maneuver on viscosity for better applicability in clinical practice.
The first objective of this study was to demonstrate the effects of the chin-down maneuver on the generation of pharyngeal pressure in both healthy subjects and dysphagic patients. The second objective was to determine the effects of viscosity on the generation of pharyngeal pressure during the chin-down maneuver. HRM was used for the analysis.
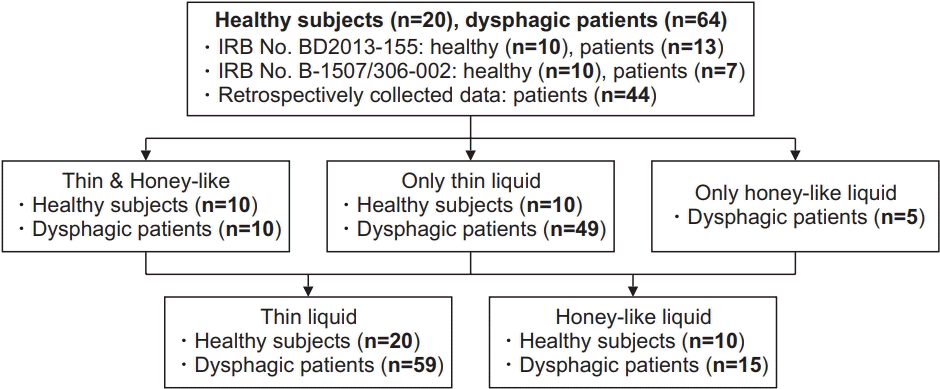
A total of 20 healthy subjects and 64 dysphagic patients were retrospectively reviewed and analyzed in this study. The study included data from 20 healthy subjects and 20 dysphagic patients (IRB No. B-1507/306-002, BD2013-155), which were prospectively collected. In addition, retrospective data on 44 dysphagic patients were collected.
All healthy subjects had no neurological deficits and swallowing difficulties. For the dysphagic group, patients who reported any kind of dysphagia symptoms and were able to follow the instructions appropriately to perform the chin-down maneuver were included, and those who were uncooperative for any reason (e.g., severe cognitive impairment, psychiatric disorder), with unstable vital signs, or unable to perform the chin-down maneuver for any reason were excluded.
The healthy group consisted of 12 men and 8 women, with an average age of 40.45±15.08 years. The dysphagic group consisted of 37 men and 27 women, with an average age of 65.05±12.14 years. Detailed characteristics are presented in Table 1. This study was approved by the Institutional Review Board at Seoul National University Bundang Hospital (IRB No. B-1809-493-103).
Twenty healthy subjects and 59 dysphagic patients swallowed 5 mL of thin liquid (viscosity range, 1–50 cP) [12] while in neutral position, followed by 5 mL of thin liquid while in chin-down position. Among them, 10 healthy subjects and 15 dysphagic patients swallowed 5 mL of honey-like liquid (viscosity range, 351–1,750 cP) [12] while in neutral position and performing chin-down maneuver, consecutively (Fig. 1). Instruction for the chin-down maneuver was “move your chin-down, comfortably”, which was adapted from the instruction used by the literatures [1,13]. All swallows were performed twice, and the average values were used for the analysis.
Before HRM assessment, a topical anesthetic spray (10% lidocaine) was applied through the nasal cavity. To allow the manometric catheter to pass easily through the pharynx, it was lubricated using 2% lidocaine jelly. With the catheter positioned at the pharynx, participants took rest for 5–10 minutes for adaptation before swallowing [14].
Pressure and timing events were recorded with a 32-circumferential pressure sensor HRM catheter (INSIGHT HRIM; Sandhill Scientific Inc., Highlands Ranch, CO, USA). Each sensor was positioned along the entire pharynx, post the nasal passage and had its own channel in a spatiotemporal plot generated by a software. Pressure and timing data were extracted using BioVIEW Analysis software (Version 5.6.3.0; Sandhill Scientific Inc.).
The channels of interest were velopharynx (VP), tongue base (TB), epiglottis, pharyngeal constrictors, and preand post-swallow upper esophageal sphincter (UES). These channels were defined manometrically in accordance with previous reports [7,14-16]. Variables included maximal pressure and area integral in regions of VP and TB. The maximal pressure was measured in the pharyngeal constrictors [8,14]. In UES, pre-swallow maximal pressure, post-swallow maximal pressure, minimal pressure, activity time (the interval between pre-swallow peak and post-swallow peak), and nadir duration (duration of relaxation after pre-swallow UES constriction) were also measured. Because some channels were not distinctly defined, the pressure values were selected for the highest and lowest values among the probable consecutive channels [8,14]. Recent articles provide a more detailed methodology of HRM [14,17].
All statistical analyses were carried out using SPSS Statistics version 22.0 for Windows (IBM, Armonk, NY, USA). Paired t-test was used to evaluate the effect of chin-down maneuver compared with neutral position on swallowing of thin liquid. For the evaluation of honey-like liquid, Wilcoxon signed-rank test was used, because the assumptions of parametric statistical analysis were not satisfied when comparing the changes after chin-down maneuver between the dysphagic group and the healthy group. Moreover, Student t-test was used to evaluate thin liquid, and Mann-Whitney U test was used to evaluate honey-like liquid, since the assumptions of parametric statistical analysis were not satisfied. Values of p≤0.05 were considered statistically significant for all comparisons.
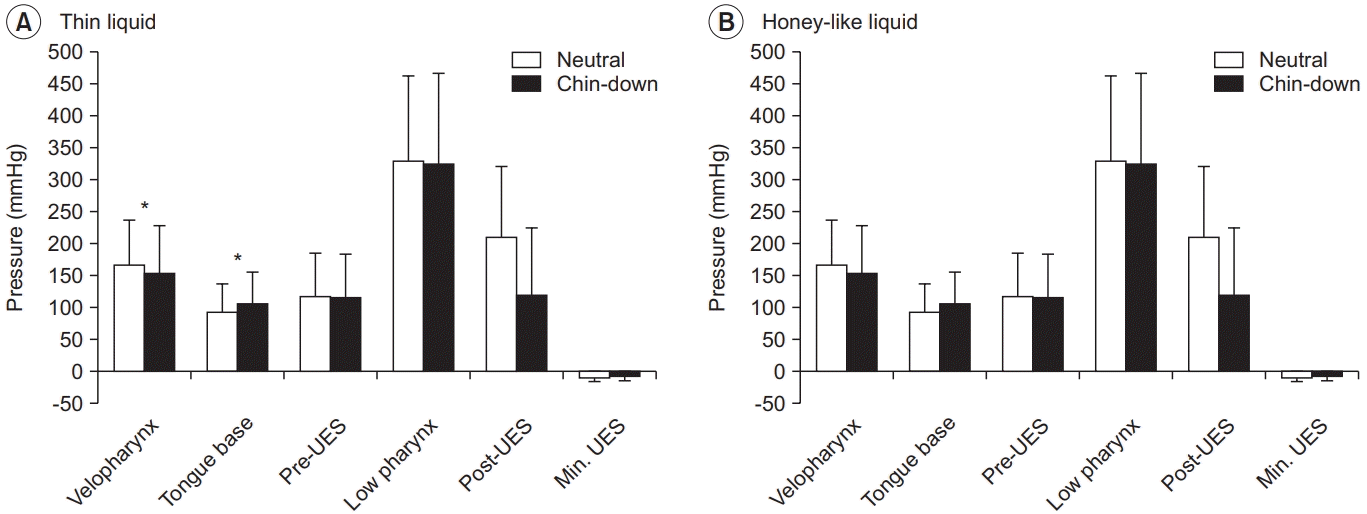
Compared with thin liquid swallowing in neutral position in dysphagic patients (n=59), swallowing in chindown position was associated with significantly increased maximal pressure and area of TB contraction by 14.6%, from 92.6 to 106.1 mmHg (p<0.001), and 22.9% (p<0.01), respectively. Swallowing in chin-down position was also significantly associated with a 7% reduction in the mean maximal VP pressure in thin liquid swallowing (p<0.05) (Table 2, Fig. 2).
Swallowing honey-like liquid in chin-down position in dysphagic patients (n=15) increased the mean maximal pressure and the area of TB contraction by 16.6%, from 114.5 to 133.5 mmHg (p=0.078), and by 17.1% (p=0.088), respectively. UES nadir duration was decreased by 0.04 seconds (p<0.05) while swallowing honey-like liquid in chin-down position (Table 2, Fig. 2).
When swallowing thin liquid in healthy subjects, the chin-down maneuver compared with the neutral position increased the mean maximal pressure and area of TB contraction significantly by 10.3%, from 144.4 to 159.3 mmHg (p<0.05), and by 15.7% (p<0.05), respectively. The pre-swallow peak UES pressure and maximal pharyngeal constrictors peak pressure decreased by 36.6%, from 223.0 to 141.3 mmHg (p<0.05), and by 13%, from 372.9 to 322.9 mmHg (p<0.05), respectively. UES nadir duration also decreased from 0.35 to 0.30 seconds (p<0.05) in the chin-down position. When swallowing honey-like liquid in healthy subjects, as in the case of thin liquid, the area of TB contraction increased by 14.5% (p<0.05), and minimal UES pressure increased from -6.0 to -2.4 mmHg (p<0.05) (Table 3).
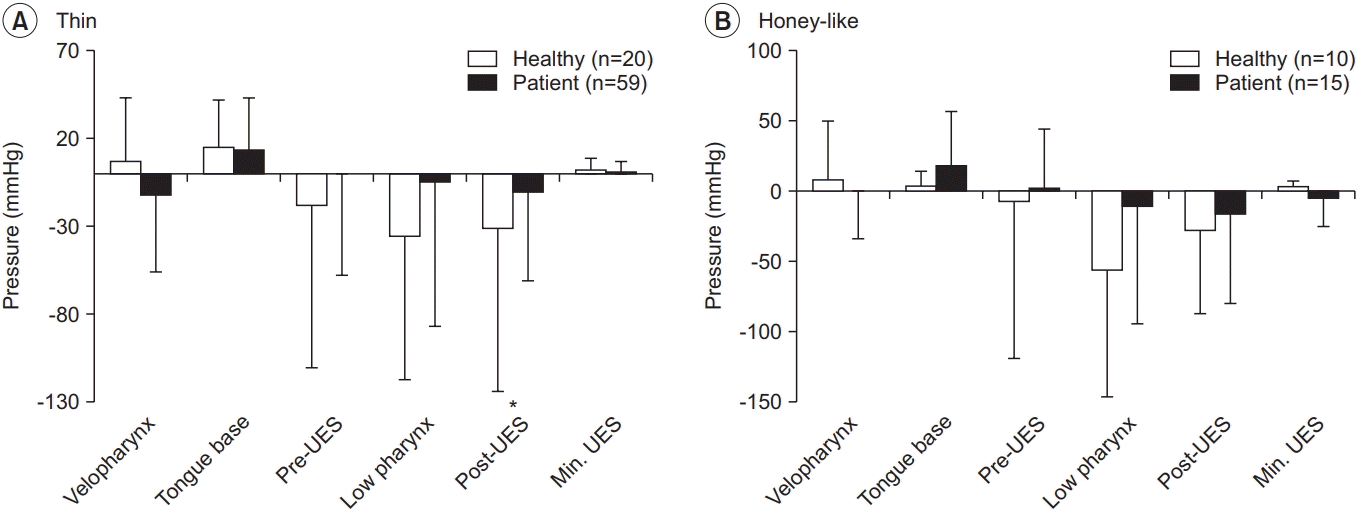
When comparing the changes of swallowing of thin liquid in chin-down position between the healthy and dysphagia groups, the former showed a significant decrease in the post-swallow peak UES pressure (healthy vs. patients, -31.1 mmHg vs. -10.7 mmHg; p<0.01) and UES activity time (healthy vs. patients, -0.02 seconds vs. 0.00 seconds; p<0.05). There was no significant difference of honey-like liquid swallowing between the two groups (Table 4, Fig. 3).
Manometry has commonly been used for esophagus physiology [18], and a few manometry studies evaluating the chin-down effect focused on the pharyngeal structure [2,10,11]. In addition, manometric catheters containing three to five unidirectional sensors have traditionally been used to measure pharyngeal pressures. Asymmetric structure of the pharynx and its intricate skeletal muscle contractions hindered accurate assessment [19,20]. Traditional manometry studies evaluating the chin-down maneuver showed various results, such as reduction [2,11] and no changes of pharyngeal pressure [10]. Some suggested that patients with pharyngeal weakness should be treated with caution when in the chin-down position [2,10,11]. However, the effects of the chin-down maneuver are not conclusive and require more detailed research with diets of varying thicknesses. Moreover, most of the previous studies were performed in healthy subjects [2,10,11], and to the best of our knowledge, only a few studies were performed incorporating only a small number of dysphagic patients (7 or 8 patients) [21,22]; moreover, no study was performed to compare the pharyngeal pressure generation between healthy subjects and dysphagic patients.
HRM seems to be the most objective measure of the pressure and time parameters regarding the swallowing process. The present study showed interesting findings on the pharyngeal structure (TB pressure, pharyngeal constrictors, and UES) according to the included groups and viscosity.
In the present study, the chin-down maneuver increased both the TB pressure and area in both groups as well as in both viscosities, although only honey-like liquid did not reach statistical significance in the dysphagic group. These findings are similar to previous studies that used thin liquid [11,23,24]. It has already been established that an increase in TB pressure leads to an increase in the pressure on the boluses for descent [3]. A previous study explained that the tongue has to lift the bolus for it to be transported to the pharynx, because the bolus is located below the TB when the head is lowered and inclined anteriorly [23]. Although a previous study showed that there is no relationship between the TB pressure and vallecular stasis, it included only 37 patients [25]. Therefore, a prospective study with greater sample size is required to verify the correlation with VFSS findings.
In the present study, only the healthy group showed a significant decrease in thin liquid swallowing and a decrease in honey-like liquid swallowing, with respect to the pharyngeal constrictors and pre-swallow peak UES pressure. The lack of significant finding with respect to honey-like liquid swallowing might be attributable to the small sample size. The possible reason for significance in the healthy group might be the sufficient generation of pressure and normal control system. It is established that the healthy population can control the swallowing process according to the viscosity of the liquid, which was proven with a kinematic and pressure analysis [7,26]. In addition, it has been suggested that the healthy group can generate sufficient pharyngeal pressure and, therefore, exhibit decreased contraction of both the pharyngeal constrictors and pre-UES, allowing smooth swallowing; however, the dysphagia group did not show any change in these parameters. In other words, the chin-down maneuver might not influence the contraction of pharyngeal constrictors, pre-UES contraction, and accumulation of pharyngeal residue in dysphagic patients.
With respect to the UES relaxation, UES nadir duration was significantly decreased in the dysphagia group’s honey-like liquid swallowing and the healthy group’s thin and honey-like liquid swallowing. Moreover, UES nadir duration of honey-like and thin flow swallowing in the dysphagia group was 0.26 seconds after the chin-down maneuver, which were severely limited (Table 2). However, UES nadir durations in the healthy group ranged from 0.30 to 0.32 seconds (Table 3). These findings imply that the chin-down maneuver limited prolonged UES relaxation in both groups and that the UES nadir duration is severely limited in the dysphagia group. These findings can be explained by the previous study performed with VFSS and HRM in patients receiving occiput and cervical (OC) fusion [27]. In this report, patients developed dysphagia after receiving OC fusion in flexed posture, which is similar to the chin-down maneuver. In addition, dysphagia was recovered after the correction of OC angle. The contraction of the suprahyoid muscles contributes to the upward and forward movements of the larynx and hyoid bone, resulting in the opening of UES [28]. Thus, the traction of the suprahyoid muscle group is known to facilitate the opening of UES. In the chin-down maneuver, suprahyoid muscles are shortened, leading to a marked reduction in hyoid excursion in the horizontal direction [13]; therefore, the contractions of these muscles are restricted due to the length tension relationship. As a consequence, the pharyngeal constrictors’ contraction and UES relaxation are also impaired [27]. As with our data, previous manometric studies, which were conducted on healthy subjects, also showed that the chin-down maneuver decreased the pre-UES pressure [11,22].
The positive pressure arising from velopharynx, as well as the TB region, is an important factor that contributes to the safe movement of the bolus to the esophagus during UES opening [29]. Our results indicate significantly decreased velopharyngeal pressure and area in the dysphagic group when swallowing thin liquid with the chindown maneuver. However, there was minimal difference of only 7%. Thus, although the pressure reduction of velopharynx is unlikely to adversely affect the movement of the bolus, there is a risk of increasing nasal regurgitation and pharyngeal residue in conditions with severe muscle weakness, such as myopathy. Although studies that included normal subjects, including the one by Hoffman et al. [29], found that there was no significant difference in the TB pressure when implementing effortful swallow, it significantly increased the velopharyngeal pressure. Therefore, if the chin-down maneuver is performed with an effortful swallow, VP pressure and TB pressure may be increased together. It can be expected that the expulsion of the bolus to the esophagus can effectively be improved and that the velopharyngeal pressure can be maintained to reduce nasal regurgitation and pharyngeal residue by performing the chin-down maneuver with effortful swallow. In a future study, it may be necessary to evaluate, using HRM and VFSS, whether the actual pressure and area increase when they are performed together and whether there is improvement in dysphagia.
This study has some limitations. Most of the significant results in this study were related to thin liquid. The number of subjects included in the honey-like liquid analysis was too small to reveal any statistical significance. Moreover, it is difficult to present any clinical applicability because it was not implemented with VFSS. In addition, the dysphagic group included various causes (Table 1); hence, the applicability of our results to all dysphagic patients may be limited. Since the type and severity of oropharyngeal dysfunction may vary depending on the cause of dysphagia, duration of the morbidity, and location of the damaged lesions, a more detailed classification will be necessary in future studies. The age difference between healthy subjects and dysphagic patients is also limitation. However, the comparisons of manometry parameters after the chin-down maneuver between the two groups were made not using the absolute values, but the changes of HRM parameters. Finally, because of the retrospective nature of the study, there was a lack of demographic data including current diet, modified Barthel index, and functional ambulation category in the patient group. In a future study, it will be necessary to consider the functional status of a patient in the manometry parameter analysis.
In conclusion, this study showed a kinetic effect of the chin-down maneuver using HRM and compared the differences between the healthy and the dysphagic group, as well as between the thin and honey-like liquids. Compared with the neutral position, the chin-down position increased the TB contraction but decreased the maximal contraction of pharyngeal constrictors and pre-UES contraction. On UES relaxation, UES nadir duration was significantly decreased in the swallowing of honey-like liquid in the dysphagic group and in the swallowing of thin and honey-like liquid in the healthy group. Moreover, UES nadir duration was severely limited in the dysphagic group. Given the various impacts of chin-down maneuver, appropriate application of the chin-down maneuver in clinical practice is required.
ACKNOWLEDGMENTS
The authors gratefully appreciate the Medical Research Collaborating Center of Seoul National University Bundang Hospital for their work in the area of statistics in this study. This research was supported by Basic Science Research Program through the National Research Foundation of Korea (NRF) funded by the Ministry of Science, ICT and Future Planning (No. NRF-2016R1D1A1B03935130).
Notes
Conceptualization: Ryu JS. Methodology: Ryu JS, Jang JY. Data acquisition: Jang EG. Formal analysis: Lee SM, Lee BH, Kim JW. Funding acquisition: Ryu JS. Project administration: Ryu JS. Visualization: Lee SM. Writing – original draft: Lee SM, Writing – review, and editing: Jang JY, Ryu JS. Approval of final manuscript: all authors.
REFERENCES
1. Logemann JA. Evaluation and treatment of swallowing disorders. 2nd ed. Austin, TX: Pro-Ed;1998.
2. Bulow M, Olsson R, Ekberg O. Videomanometric analysis of supraglottic swallow, effortful swallow, and chin tuck in healthy volunteers. Dysphagia. 1999; 14:67–72.
3. Welch MV, Logemann JA, Rademaker AW, Kahrilas PJ. Changes in pharyngeal dimensions effected by chin tuck. Arch Phys Med Rehabil. 1993; 74:178–81.
4. Terre R, Mearin F. Effectiveness of chin-down posture to prevent tracheal aspiration in dysphagia secondary to acquired brain injury: a videofluoroscopy study. Neurogastroenterol Motil. 2012; 24:414–9.
5. Solazzo A, Monaco L, Del Vecchio L, Tamburrini S, Iacobellis F, Berritto D, et al. Investigation of compensatory postures with videofluoromanometry in dysphagia patients. World J Gastroenterol. 2012; 18:2973–8.
6. Logemann JA, Gensler G, Robbins J, Lindblad AS, Brandt D, Hind JA, et al. A randomized study of three interventions for aspiration of thin liquids in patients with dementia or Parkinson’s disease. J Speech Lang Hear Res. 2008; 51:173–83.
7. Park D, Shin CM, Ryu JS. Effect of different viscosities on pharyngeal pressure during swallowing: a study using high-resolution manometry. Arch Phys Med Rehabil. 2017; 98:487–94.
8. Ryu JS, Park D, Oh Y, Lee ST, Kang JY. The effects of bolus volume and texture on pharyngeal pressure events using high-resolution manometry and its comparison with videofluoroscopic swallowing study. J Neurogastroenterol Motil. 2016; 22:231–9.
9. Castell JA, Castell DO. Manometric analysis of the pharyngo-esophageal segment. Indian J Gastroenterol. 1994; 13:58–63.
10. Castell JA, Castell DO, Schultz AR, Georgeson S. Effect of head position on the dynamics of the upper esophageal sphincter and pharynx. Dysphagia. 1993; 8:1–6.
11. Balou M, McCullough GH, Aduli F, Brown D, Stack BC Jr, Snoddy P, et al. Manometric measures of head rotation and chin tuck in healthy participants. Dysphagia. 2014; 29:25–32.
12. American Dietetic Association. National dysphagia diet: standardization for optimal care. Chicago, IL: American Dietetic Association;2002.
13. Leigh JH, Oh BM, Seo HG, Lee GJ, Min Y, Kim K, et al. Influence of the chin-down and chin-tuck maneuver on the swallowing kinematics of healthy adults. Dysphagia. 2015; 30:89–98.
14. Ryu JS, Park DH, Kang JY. Application and interpretation of high-resolution manometry for pharyngeal dysphagia. J Neurogastroenterol Motil. 2015; 21:283–7.
15. Kim CK, Ryu JS, Song SH, Koo JH, Lee KD, Park HS, et al. Effects of head rotation and head tilt on pharyngeal pressure events using high resolution manometry. Ann Rehabil Med. 2015; 39:425–31.
16. Park D, Oh Y, Ryu JS. Findings of abnormal videofluoroscopic swallowing study identified by high-resolution manometry parameters. Arch Phys Med Rehabil. 2016; 97:421–8.
17. Jungheim M, Miller S, Ptok M. Methodologische Aspekte zur Hochauflosungsmanometrie des Pharynx und des oberen Osophagussphinkters [Methodological aspects of high resolution manometry of the pharynx and upper esophageal sphincter]. Laryngorhinootologie. 2013; 92:158–64.
18. Fox MR, Bredenoord AJ. Oesophageal high-resolution manometry: moving from research into clinical practice. Gut. 2008; 57:405–23.
19. Takasaki K, Umeki H, Enatsu K, Tanaka F, Sakihama N, Kumagami H, et al. Investigation of pharyngeal swallowing function using high-resolution manometry. Laryngoscope. 2008; 118:1729–32.
20. Geng Z, Hoffman MR, Jones CA, McCulloch TM, Jiang JJ. Three-dimensional analysis of pharyngeal high-resolution manometry data. Laryngoscope. 2013; 123:1746–53.
21. Bulow M, Olsson R, Ekberg O. Videomanometric analysis of supraglottic swallow, effortful swallow, and chin tuck in patients with pharyngeal dysfunction. Dysphagia. 2001; 16:190–5.
22. McCulloch TM, Hoffman MR, Ciucci MR. High-resolution manometry of pharyngeal swallow pressure events associated with head turn and chin tuck. Ann Otol Rhinol Laryngol. 2010; 119:369–76.
23. Hori K, Tamine K, Barbezat C, Maeda Y, Yamori M, Muller F, et al. Influence of chin-down posture on tongue pressure during dry swallow and bolus swallows in healthy subjects. Dysphagia. 2011; 26:238–45.
24. Ayuse T, Ayuse T, Ishitobi S, Kurata S, Sakamoto E, Okayasu I, et al. Effect of reclining and chin-tuck position on the coordination between respiration and swallowing. J Oral Rehabil. 2006; 33:402–8.
25. Knigge MA, Thibeault S. Relationship between tongue base region pressures and vallecular clearance. Dysphagia. 2016; 31:391–7.
26. Lee SI, Yoo JY, Kim M, Ryu JS. Changes of timing variables in swallowing of boluses with different viscosities in patients with dysphagia. Arch Phys Med Rehabil. 2013; 94:120–6.
Table 1.
Table 2.
Thin (n=59) |
Honey-like (n=15) |
|||||
---|---|---|---|---|---|---|
Neutral | Chin-down | p-valuea) | Neutral | Chin-down | p-valueb) | |
Max. pressure of VP (mmHg) | 166.3±70.1 | 154.0±73.5 | 0.036 | 150.0±96.0 | 149.5±92.6 | 0.733 |
Area of VP contraction (mmHg/s) | 39.7±23.6 | 38.9±26.2 | 0.708 | 43.6±45.3 | 47.0±42.8 | 0.363 |
Max. pressure of TB contraction (mmHg) | 92.6±44.0 | 106.1±49.7 | 0.001 | 114.5±41.9 | 133.5±62.5 | 0.078 |
Area of TB contraction (mmHg/s) | 38.0±23.2 | 46.7±34.5 | 0.009 | 43.9±22.4 | 51.4±29.5 | 0.088 |
Max. low pharyngeal peak pressure (mmHg) | 329.3±131.6 | 324.3±141.7 | 0.636 | 365.8±103.7 | 355.6±109.6 | 0.999 |
Pre-swallow peak UES pressure (mmHg) | 116.7±68.1 | 116.1±67.2 | 0.934 | 120.1±55.7 | 122.3±74.0 | 0.865 |
Post-swallow peak UES pressure (mmHg) | 209.8±110.6 | 119.2±105.3 | 0.110 | 266.8±99.6 | 250.8±90.7 | 0.334 |
Min. UES pressure (mmHg) | -9.2±6.7 | -8.0±7.2 | 0.117 | -0.1±20.8 | -4.6±5.0 | 0.842 |
UES activity time (s) | 0.72±0.21 | 0.72±0.19 | 0.915 | 0.82±0.23 | 0.74±0.19 | 0.070 |
UES nadir duration (s) | 0.26±0.13 | 0.26±0.12 | 0.669 | 0.30±0.14 | 0.26±0.14 | 0.016 |
Table 3.
Thin (n=20) |
Honey-like (n=10) |
|||||
---|---|---|---|---|---|---|
Neutral | Chin-down | p-valuea) | Neutral | Chin-down | p-valueb) | |
Max. pressure of VP (mmHg) | 208.9±94.4 | 213.0±91.8 | 0.600 | 221.9±87.3 | 230.5±70.6 | 0.878 |
Area of VP contraction (mmHg/s) | 55.3±35.0 | 58.9±34.5 | 0.409 | 48.1±31.5 | 49.2±23.6 | 0.799 |
Max. pressure of TB contraction (mmHg) | 144.4±28.6 | 159.3±32.8 | 0.023 | 143.5±29.9 | 147.5±23.6 | 0.721 |
Area of TB contraction (mmHg/s) | 54.7±18.6 | 63.3±22.0 | 0.046 | 48.8±9.7 | 55.9±13.1 | 0.041 |
Max. low pharyngeal peak pressure (mmHg) | 372.9±164.1 | 322.9±130.5 | 0.006 | 458.3±170.0 | 402.6±109.6 | 0.139 |
Pre-swallow peak UES pressure (mmHg) | 223.0±151.8 | 141.3±73.0 | 0.019 | 209.3±53.5 | 202.8±88.5 | 0.575 |
Post-swallow peak UES pressure (mmHg) | 388.2±137.2 | 358.1±108.1 | 0.127 | 386.4±107.6 | 358.3±82.4 | 0.333 |
Min. UES pressure (mmHg) | -8.1±5.4 | -5.7±6.8 | 0.102 | -6.0±9.2 | -2.4±7.0 | 0.017 |
UES activity time (s) | 0.63±0.16 | 0.61±0.14 | 0.258 | 0.70±0.13 | 0.67±0.14 | 0.369 |
UES nadir duration (s) | 0.35±0.11 | 0.30±0.09 | 0.024 | 0.38±0.10 | 0.32±0.11 | 0.033 |
Table 4.
Thin |
Honey-like |
|||||
---|---|---|---|---|---|---|
Healthy (n=20) | Dysphagic (n=59) | p-valuea) | Healthy (n=10) | Dysphagic (n=15) | p-valueb) | |
Max. pressure of VP (mmHg) | 7.0±36.2 | -12.3±44.0 | 0.687 | 8.6±41.3 | -0.4±33.0 | 0.567 |
Area of VP contraction (mmHg/s) | 4.6±19.5 | -0.8±16.3 | 0.227 | 1.1±12.0 | 3.4±14.6 | 0.849 |
Max. pressure of TB contraction (mmHg) | 15.3±26.7 | 13.5±29.9 | 0.840 | 4.0±10.8 | 19.0±38.2 | 0.567 |
Area of TB contraction (mmHg/s) | 9.3±18.0 | 8.6±24.3 | 0.769 | 7.1±8.9 | 7.5±15.1 | 1.000 |
Max. low pharyngeal peak pressure (mmHg) | -35.6±82.1 | -5.1±81.8 | 0.807 | -55.6±90.3 | -10.2±83.7 | 0.216 |
Pre-swallow peak UES pressure (mmHg) | -18.3±92.7 | -0.6±57.6 | 0.094 | -6.5±112.1 | 2.2±42.3 | 0.367 |
Post-swallow peak UES pressure (mmHg) | -31.1±93.2 | -10.7±50.4 | 0.010 | -28.1±59.0 | -16.0±63.1 | 0.807 |
Min. UES pressure (mmHg) | 2.0±6.8 | 1.2±5.7 | 0.429 | 3.6±4.1 | -4.5±19.9 | 0.115 |
UES activity time (s) | -0.02±0.08 | 0.00±0.18 | 0.032 | -0.04±0.12 | -0.07±0.14 | 0.461 |
UES nadir duration (s) | -0.06±0.09 | -0.01±0.10 | 0.243 | -0.07±0.08 | -0.04±0.05 | 0.461 |