Journal List > Ann Rehabil Med > v.43(2) > 1150730

Oh, Park, Han, Shim, and Choi: Duration of Treatment Effect of Extracorporeal Shock Wave on Spasticity and Subgroup-Analysis According to Number of Shocks and Application Site: A Meta-Analysis

Abstract

Objective

To investigate duration of the treatment effect of extracorporeal shockwave therapy (ESWT) on spasticity levels measured with Modified Ashworth Scale (MAS) regardless of the patient group (stroke, multiple sclerosis, and cerebral palsy) and evaluate its spasticity-reducing effect depending on the number of shocks and site of application.

Methods

PubMed, EMBASE, the Cochrane Library, and Scopus were searched from database inception to February 2018. Randomized controlled trials and cross-over trials were included. All participants had spasticity regardless of cause. ESWT was the main intervention and MAS score was the primary outcome. Among 122 screened articles, 9 trials met the inclusion criteria.

Results

The estimate of effect size showed statistically significant MAS grade reduction immediately after treatment (standardized mean difference [SMD]=-0.57; 95% confidence interval [CI], -1.00 to -0.13; p=0.012), 1 week after (SMD=-1.81; 95% CI, -3.07 to -0.55; p=0.005), 4 weeks after (SMD=-2.35; 95% CI, -3.66 to -1.05; p<0.001), and 12 weeks after (SMD=-1.07; 95% CI, -2.04 to -0.10; p=0.03). Meta-regression and subgroup analysis were performed for the ‘immediately after ESWT application’ group. The prediction equation obtained from metaregression was -1.0824+0.0002* (number of shocks), which was not statistically significant. Difference in MAS grade reduction depending on site of application was not statistically significant either in subgroup analysis (knee and ankle joints vs. elbow, wrist, and finger joints).

Conclusion

ESWT effectively reduced spasticity levels measured with MAS regardless of patient group. Its effect maintained for 12 weeks. The number of shocks or site of application had no significant influence on the therapeutic effect of ESWT in reducing spasticity. Ongoing trials with ESWT are needed to address optimal parameters of shock wave to reduce spasticity regarding intensity, frequency, and numbers.

INTRODUCTION

Spasticity is a motor disorder that is characterized by a velocity-dependent increase in tonic stretch reflexes (muscle tone) with exaggerated tendon jerks. It results from hyperexcitability of the stretch reflex as one component of the upper motor neuron syndrome [1]. The upper motor neuron (UMN) syndrome is due to parapyramidal fiber [2] dysfunction with some contribution from pyramidal fibers. Various conditions can cause UMN syndrome or spasticity.
Spasticity has been measured clinically and neurophysiologically to explain how the integrity of various segmental, plurisegmental pathways and rheological properties of muscles could be altered in the spastic state. Neurophysiological measurements provide quantitative indicators of alterations in various pathways—e.g., tibial F max/M max ratio [3,4], H-reflex latency [5], H-reflex recovery curve [6]. Clinical measurements could be used to evaluate the resistance to passive movement of the limb: Modified Ashworth Scale (MAS), Tardieu scale [7], and composite spasticity score [8]. However, major limitations concerning these neurophysiological and clinical measurements are the paucity of literature reporting its use and difficulties in incorporating these measurements into a meta-analysis model. In this metaanalysis, we used the MAS which remained the primary clinical measure of spasticity and proved to have good inter-rater reliability. The MAS is a 6-grade scale, ranging from 0 (normal muscle tone) to 4 (limb rigid in flexion or extension) [9].
Extracorporeal shockwave therapy (ESWT) was first applied in the treatment of kidney stones in 1980 [10]. Since then, it has shown therapeutic effect for pain relief in musculoskeletal disorders [11]. Its therapeutic effect in reducing spasticity has also been proven in stroke patients [12,13], children with cerebral palsy [14,15], and patients with multiple sclerosis [16]. Recent meta-analyses have demonstrated that its therapeutic effect can be maintained for up to 4 weeks [17,18]. However, there is no consensus about how long its treatment effects will last, how many times ESWT should be administered, or how treatment effects may differ depending on application sites.
Thus, the objective of this study was to investigate the duration of treatment effect of ESWT in reducing spasticity levels measured with MAS regardless of patient group (stroke, multiple sclerosis, and cerebral palsy) and valuate its spasticity-reducing effect depending on the number of shocks and the site of application.

MATERIALS AND METHODS

Literature search

Two reviewers performed a systematic search up to February 2018 according to the Preferred Reporting Items for Systematic Reviews and Meta-analyses (PRISMA) guidelines [19]. The study design was restricted to randomized controlled trials (RCTs) and cross-over trials. Other conditions were not restricted. To include all relevant studies, we used databases of PubMed, EMBASE, the Cochrane Library, and Scopus. The search strategy was based on MeSH or Emtree. Search terms were as follows: (‘spasticity’/exp OR spasticity OR ((‘muscle’/exp OR muscle) AND (‘spasticity’/exp OR spasticity)) OR ‘rigidity’/exp OR rigidity OR ((‘muscle’/exp OR muscle) AND (‘rigidity’/exp OR rigidity)) OR ‘muscle tone’/exp OR ‘muscle tone’ OR (increased AND (‘muscle’/exp OR muscle) AND (‘tone’/exp OR tone)) OR ‘muscle hypertonia’/exp OR ‘muscle hypertonia’ OR ‘hypertonia’/exp OR hypertonia) AND (‘shock’/exp OR shock) AND (‘wave’/exp OR wave) AND (‘therapy’/exp OR therapy).

Study selection

After duplicate articles were excluded using EndNote X8 (EndNote, Philadelphia, PA, USA), two reviewers independently selected articles. We included cross-over trials that had neither carry-over nor period effects. Crossover trials had some advantages in that each participant acted as her or his control and fewer participants were needed to obtain the same power [20]. Any discrepancy was resolved by discussion. If discrepancies could not be resolved, a third author joined the discussion. The selection criteria were as follows: (1) study designs were RCTs and cross-over trials; (2) All participants had spasticity regardless of cause (stroke, multiple sclerosis, and cerebral palsy); (3) ESWT was the intervention and the outcome measure was the MAS; (4) MAS was evaluated at least twice (baseline and post-treatment) and expressed as a mean and standard deviation (SD). Only full report articles were included. Abstracts, books, letters, and posters were excluded.

Data extraction

Two reviewers independently extracted data from the included studies and made an extraction data table. The third person reviewed this table to make sure there was no error. The table had the following data extracted from included studies: author name, publication year, participants (lesion, numbers [treated/control], and duration of illness [treated/control]), intervention (ESWT energy, mode, application focus, treated muscle, and total counts), comparison (tested muscles and MAS at baseline), and outcomes (follow-up time points and MAS at follow-up time points).

Assessment of methodological quality

To assess methodological quality of included studies, analysis was performed with ‘risk-of-bias tool’ recommended by the Cochrane Handbook for Systematic Reviews of Intervention. It is a two-part tool addressing six specific domains (sequence generation, allocation concealment, blinding, incomplete outcome data, selective outcome reporting, and other sources of bias). Each domain includes one or more specific entries. The second part of the tool involves assigning a judgment relating to the risk of bias for that entry [21]. Two reviewers conducted quality assessment independently. Disagreement was resolved by discussion.

Statistical analysis

All statistical analyses were performed using Comprehensive Meta-Analysis version 3.0 (Biostat Inc., Englewood, NJ, USA). Individual outcome measures are expressed as mean±SD. Standardized mean difference (SMD) and 95% confidence intervals (CIs) were calculated as effect sizes. Forest plot was generated depending on the follow-up period. Funnel plot was generated to evaluate publication bias. Additional trim-and-fill method was used to interpret the funnel plot objectively.
Heterogeneity refers to any kind of variability among studies due to clinical diversity or methodological diversity or both. An I2 test was performed to measure heterogeneity of intervention effects. The I2 test describes the percentage of variability in effects that are due to heterogeneity rather than to sampling error. A rough guide of I2 thresholds of interpretation is as follows [22]: 0%–40%, negligible heterogeneity; 30%–60%, moderate heterogeneity; 50%–90%, substantial heterogeneity; and 75%–100%, considerable heterogeneity. To address heterogeneity, a random-effects meta-analysis was performed to incorporate heterogeneity into a model and a sensitivity analysis was performed as a means of investigating heterogeneous results. Residual heterogeneity (heterogeneity not explained by subgrouping) was allowed by using the meta-regression technique [22].
Sensitivity analysis was also conducted to investigate the influence of each study on the overall outcome. Sample sizes, relative weights, residuals, and p-value are presented. Mean effect size after excluding studies one by one was then calculated. From sensitivity analysis, statistically significant outlier was excluded. Statistical analyses were performed using 95% CIs. The level of statistical significance was set at p<0.05.

RESULTS

Eligible studies and characteristics
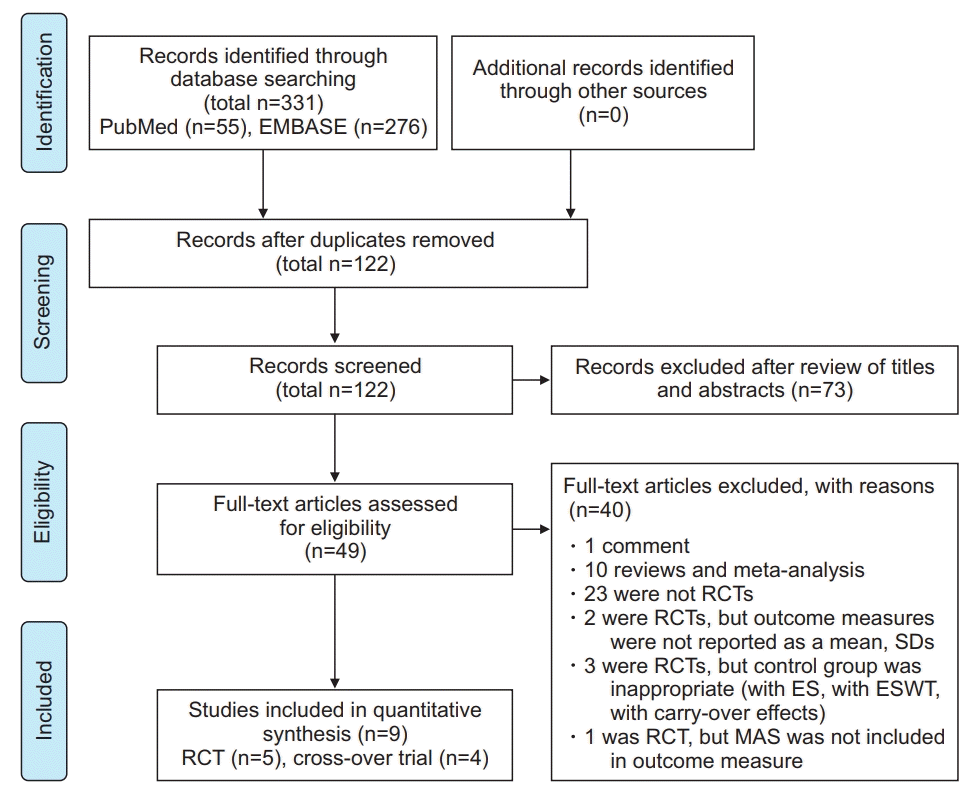
A flow chart displaying the study selection process is shown in Fig. 1. A total of 331 articles were identified from databases according to predetermined strategies without language restriction. After removing duplicates, 120 articles remained. After title and abstract review, 73 articles were excluded. After full-text review, 9 articles were finally included in the meta-analysis, including 5 RCTs [13,16,23-25] and 4 cross-over trials [12,14,15,26]. Detailed characteristics of included articles are described in Tables 1 and 2.

Risk-of-bias assessment

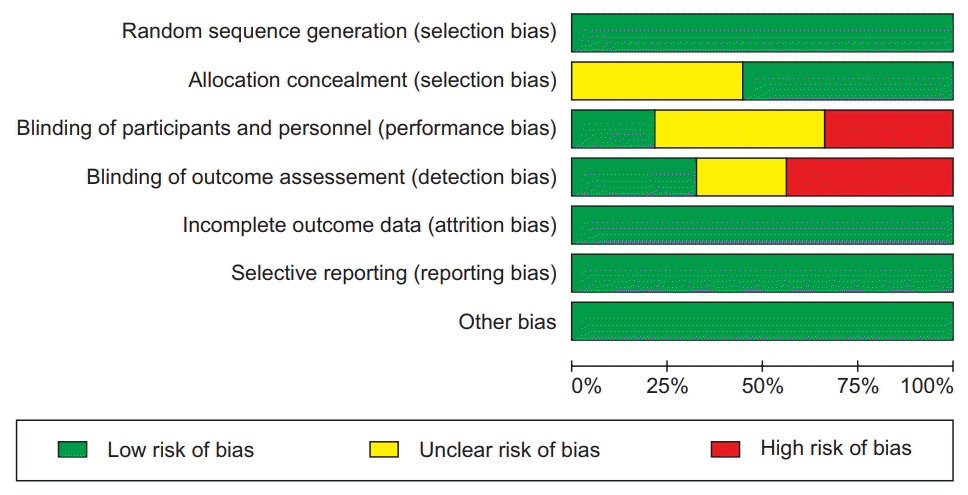
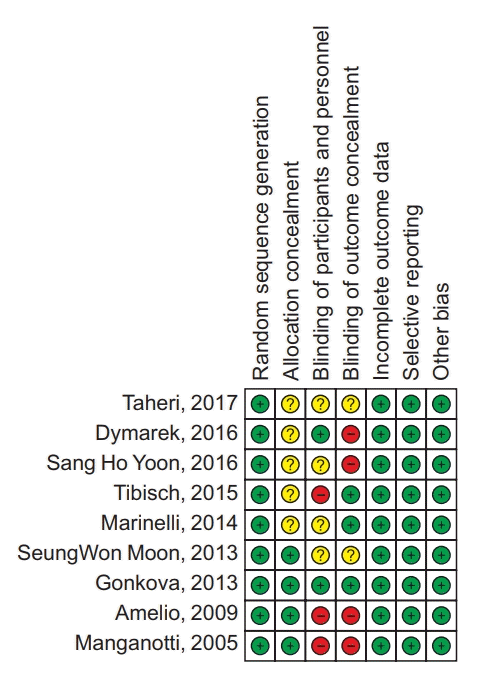
To ensure transparency in how judgments of risk of bias were made, we followed the table which provided criteria for making judgments about the risk of bias from each of the six domains in the tool. A judgment of ‘Yes’ indicated a low risk of bias, ‘No’ indicated a high risk of bias, and “Unclear” indicated unclear or unknown risk of bias. A ‘Risk of bias graph’ figure illustrated the proportion of studies with each judgement (‘Yes’, ‘No’, or ‘Unclear’) for each entry in the tool. A ‘risk of bias summary’ figure presented all judgements in a cross-tabulation of study by entry. Detailed information about six domains is shown in Figs. 2 and 3 [22]. We did not use scales or checklists. The use of scales or checklists was discouraged because many items in instruments were not directly related to internal validity [21].

Publication bias

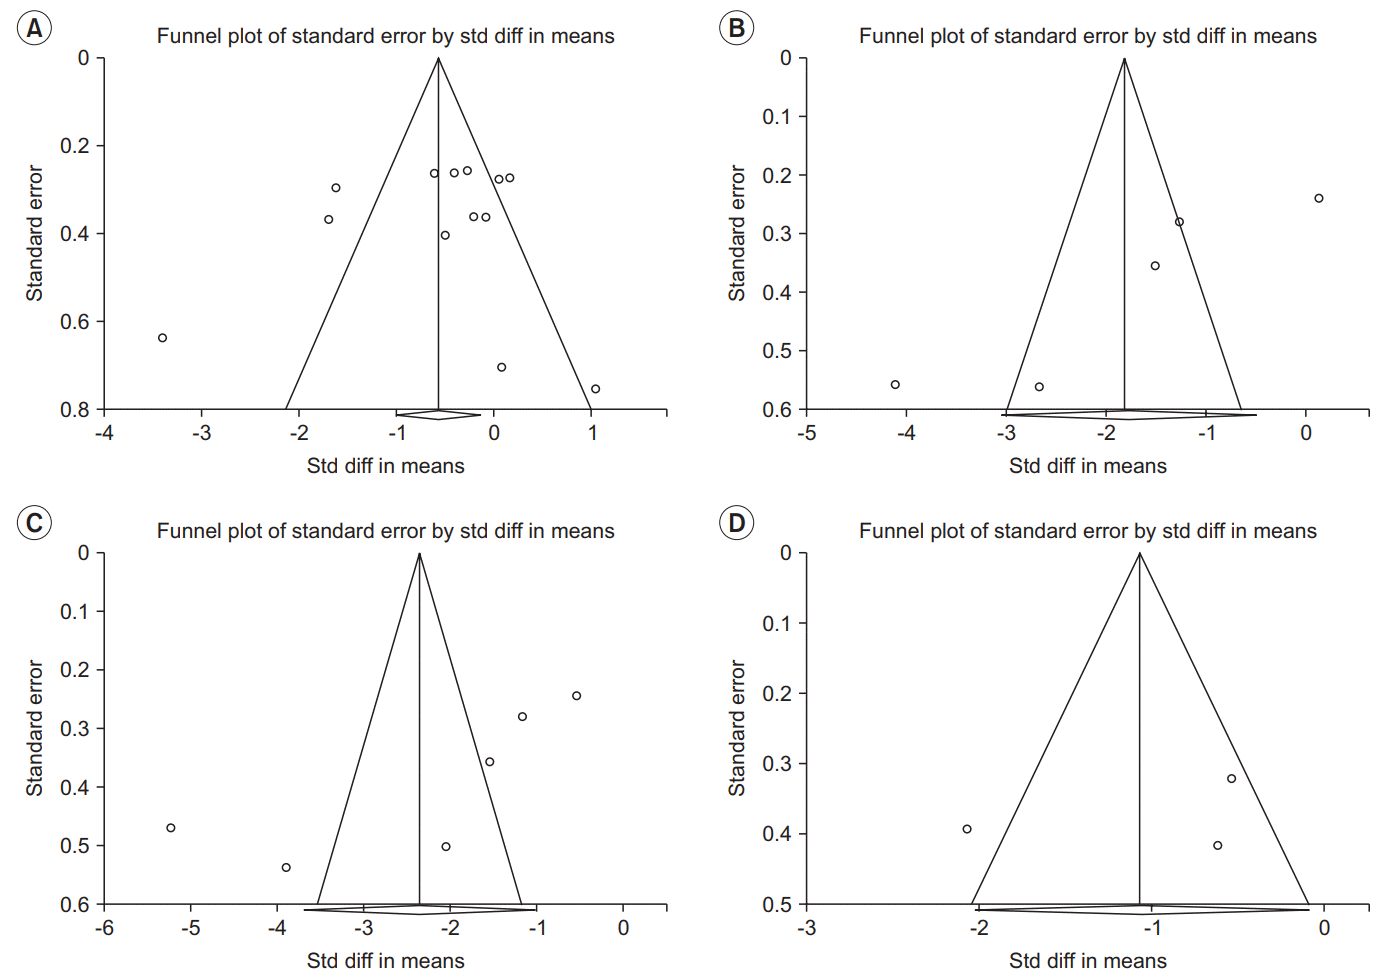
Sensitivity analysis was performed for every result to exclude a small-study effect (a tendency for intervention effects estimated in smaller studies to differ from those estimated in larger studies). Studies showing statistically significant residuals were regarded as having a small study effect and excluded. All adjusted effect estimates from the trim-and-fill method were the same as the observed effect estimates. Because there was little difference between results obtained and the trim-and-fill adjusted estimates, it could be concluded that publication bias was unlikely to change conclusions of this metaanalysis [27] (Fig. 4).

Treatment effects depending on periods

Immediately after ESWT application
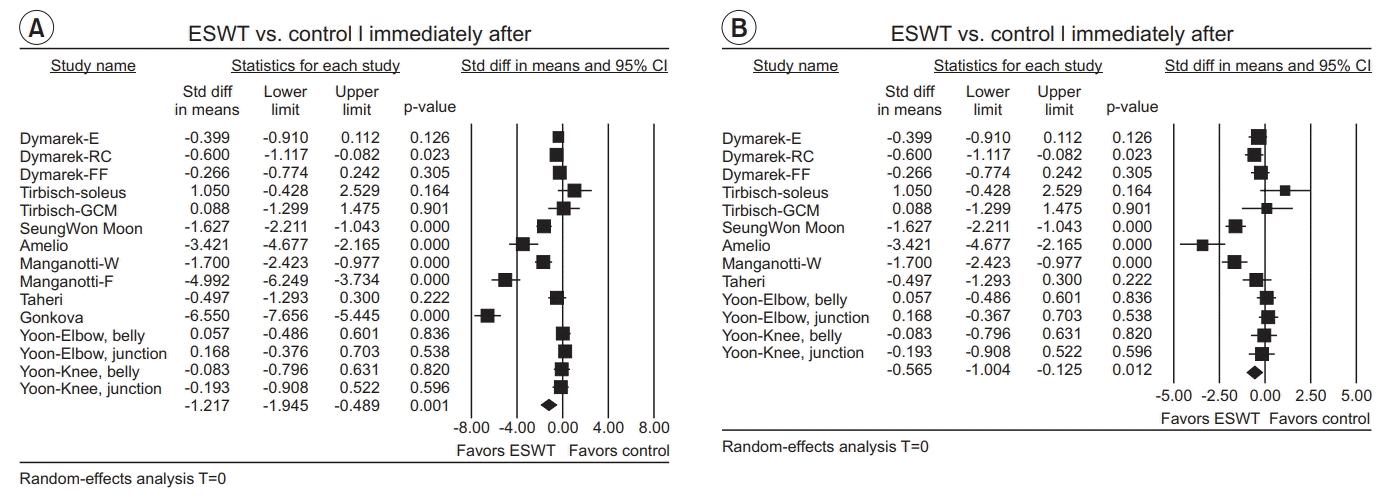
Fifteen groups from eight studies were evaluated to show the effect of ESWT on MAS grade immediately after application. The estimate of effect size showed statistically significant MAS grade reduction after ESWT (SMD=-1.22; 95% CI, -1.95 to -0.49; p=0.001; I2=93.66) (Fig. 5A).
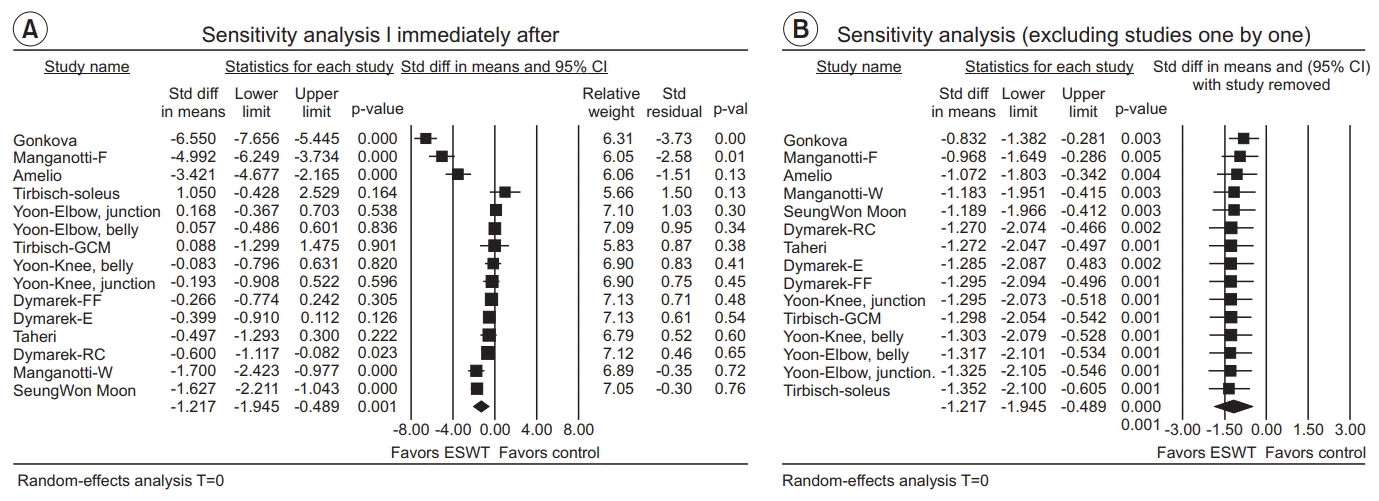
Sensitivity analyses revealed that Gonkova’s and Manganotti-F’s studies had statistically significant greater effects (Fig. 6A). After excluding each study one by one, Gonkova’s and Manganotti-F’s studies showed the greatest difference from the original results (Fig. 6B). Thus, it was reasonable to exclude Gonkova’s and Manganotti-F’s studies as outliers. As a result, the pooled estimate of the effect size was -0.57 (SMD=-0.57; 95% CI, -1.00 to -0.13; p=0.012; I2=81.18) (Fig. 5B)

One week after ESWT application

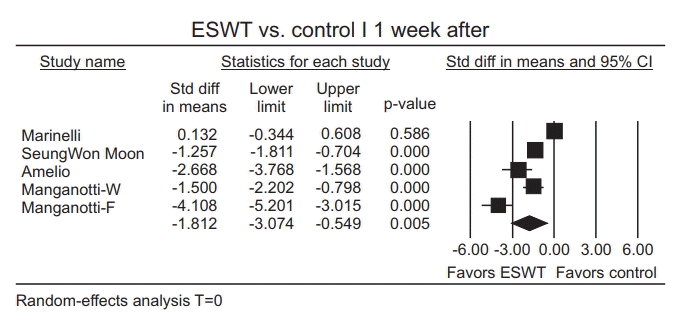
Six groups from five studies were evaluated to show an effect of ESWT on MAS grade one week after the application. Because no study had a statistically significant residual in sensitivity analysis (Fig. 7A) and effect sizes were similar after excluding each study one by one (Fig. 7B), all studies were included. The pooled estimate of effect size showed statistically significant MAS grade reduction (SMD=-1.81; 95% CI, -3.07 to -0.55; p=0.005; I2=93.77) (Fig. 8).

Four weeks after ESWT application

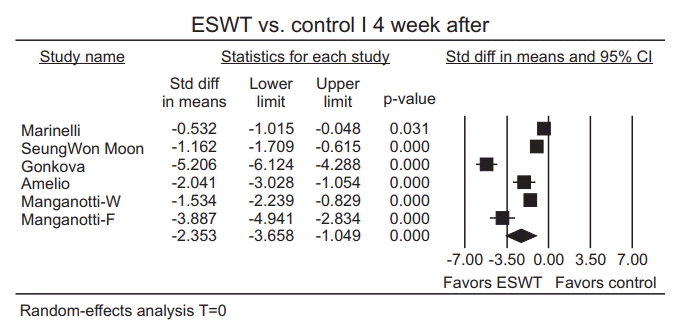
Six groups from five studies were evaluated to show an effect of ESWT on MAS grade 4 weeks after the application. Because no study had a statistically significant residual in sensitivity analysis (Fig. 9A) and effect sizes were similar after excluding each study one by one (Fig. 9B), all studies were included. The pooled estimate of effect size showed statistically significant MAS grade reduction (SMD=-2.35; 95% CI, -3.66 to -1.05; p<0.001; I2=94.96) (Fig. 10).

Twelve weeks after ESWT application

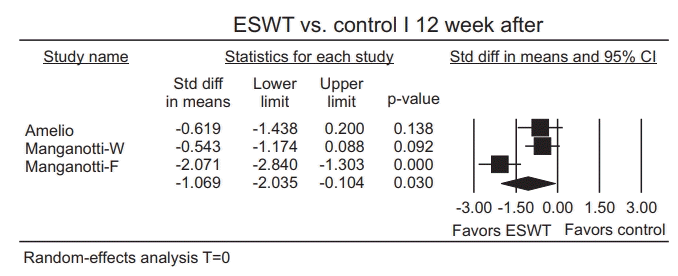
Three groups from two studies were evaluated to show an effect of ESWT on MAS grade 12 weeks after the application. Because no study had a statistically significant residual in sensitivity analysis (Fig. 11A) and effect sizes were similar after excluding each study one by one (Fig. 11B), all studies were included. The pooled estimate of an effect size showed statistically significant MAS grade reduction (SMD=-1.07; 95% CI, -2.04 to -0.10; p=0.03; I2=80.60) (Fig. 12).

Meta-regression (treatment effects depending on the number of shocks)

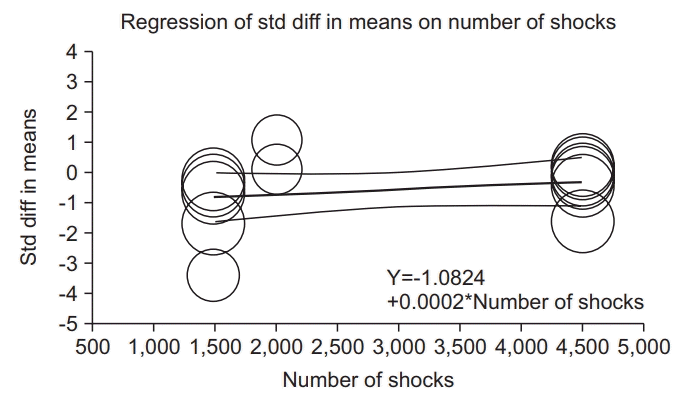
The regression coefficient obtained from a metaregression analysis can describe how the intervention effect changes with a unit increase in the explanatory variable. Because of a small number of subgroups, metaregression applied only for outcomes immediately after ESWT application [22]. The prediction equation was -1.0824+0.0002* (number of shocks), which was not statistically significant (test of the model, p=0.28). R2 analog was 0.00, meaning that a proportion of true variance in effects explained by total numbers was 0%. Effect sizes from the group immediately after ESWT application did not relate to the total number of shocks (Fig. 13).

Subgroup analysis (treatment effects depending on application site)

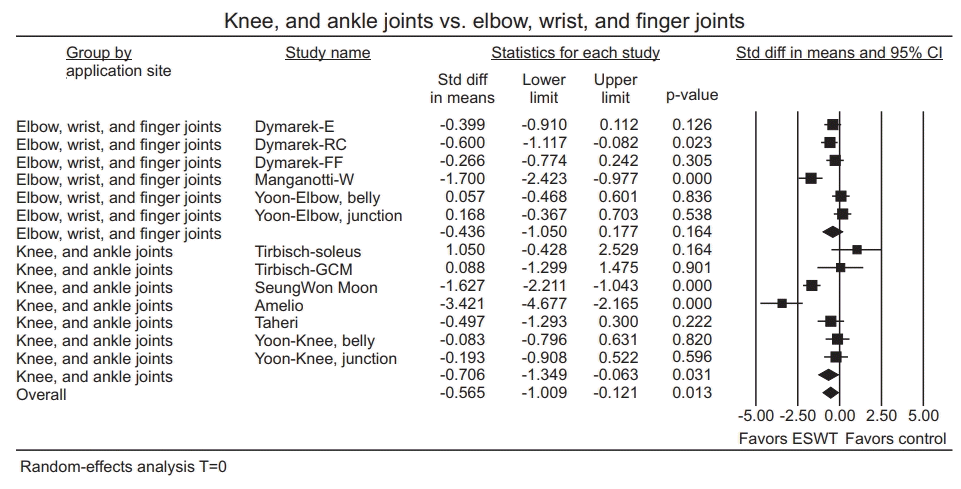
Depending on ESWT application site, we divided ‘immediately after ESWT application’ studies into two groups: ‘knee and ankle joint’ and ‘wrist, elbow and finger joints’. The knee and ankle joint group had an effect (SMD=-0.71; 95% CI, -1.35 to -0.06; p=0.031). The elbow, wrist, and finger joints group also had an effect (SMD=-0.44; 95% CI, -1.05 to 0.18; p=0.16) (Fig. 14). Difference in SMD between the two groups was not statistically significant (total between Q value=0.35, degree of freedom=1, p=0.55).

DISCUSSION

This study demonstrates that ESWT could effectively reduce spasticity levels measured with MAS regardless of patient group. Its effect could be maintained for 12 weeks. It has been proven that the effect of ESWT can be maintained for four weeks for patients with stroke or cerebral palsy in other meta-analyses [17,18]. Except for Manganotti’s [12] and Amelio’s [15] studies, all followup periods of previous meta-analyses [14,26,28-30] were within 6 weeks. To confirm duration of treatment effects of ESWT, future research follow-up period should be designed to be 12 weeks or more.
There was no relationship between the number of shocks and the therapeutic effect to reduce spasticity levels measured with MAS immediately after ESWT application. In studies included in this paper, ESWT was performed 1,500 to 18,000 times with an intensity of 0.03 mJ/mm2 or within a range that did not cause pain. Attention should be drawn to this result and interpretation because of considerable heterogeneity and small number of participants included in this study. Previous studies have reported a dose-response relationship between ESWT intensity and its effects regarding pain reduction [31] and healing promotion [32-34]. However, research on the relationship between the number of shocks and its therapeutic effects in reducing spasticity is lacking. Thus, further studies are required to ascertain the relationship.
The chief issue unresolved by this study is the potential mechanism of ESWT underlying the relationship between the number of shocks and its effects. Spasticity is a multidimensional problem. It is an untenable assumption to believe that MAS is an exclusive measure of spasticity (as defined by Lance [1]). Many studies have focused on increased spinal excitability as the primary cause of spasticity [35] and reported that amplitude of the F-wave, F-M ratio, latency of H-reflex, and H-M ratio can be used as tools for measuring spasticity electrophysiologically [36-38]. In a study of Sohn et al. [30], 10 healthy subjects and 10 hemiplegic stroke patients with plantar flexor spasticity received one session of EWST on the medial head of gastrocnemius. Although MAS of the plantar flexor improved significantly after the treatment, other variables (F-wave latency, H-reflex latency, and H-M ratio) were not changed. In studies included in this metaanalysis, examinations of the F-wave amplitude, H-reflex [24], H-max/M-max ratio, post-activation depression [16] were conducted. However, they had no significant changes after ESWT. These findings would support the idea that ESWT can reduce spasticity by directly affecting rheological properties and fibrosis of spastic muscles rather than affecting spinal excitability [12,28,30,39].
Another result obtained in this study was that there was no significant difference in MAS values between lower and upper extremities’ joints groups immediately after ESWT application. The knee and ankle joints group included soleus, gastrocnemius, and semitendinosus muscles while the elbow, wrist, and finger joints group included flexor carpi radialis, flexor carpi ulnaris, biceps brachii, interosseous of hands, and forearm muscles. This infers that ESWT has similar efficacy on any muscle with spasticity.
Because various patients and many treatment modes (ESWT energy, number of shocks, treated muscle) were included in this study, these study-level covariates could induce heterogeneity. In other meta-analyses, fixedeffects model was applied based on I2 value (=0), assuming that stroke patients were the common population. However, the purpose of this study was to determine the overall effectiveness of ESWT regardless of the type or duration of illness. Thus, heterogeneous groups were included in this study. All I2 values were greater than 80. We applied the random-effects model to incorporate heterogeneity into a model.
The present study had several limitations. First, publication bias could be a threat to the validity of findings from a meta-analysis. In this study, funnel plots showed asymmetrical appearance with a gap. The trim-and-fill method was used to adjust the results. However, funnel plot asymmetry may be caused by some factors other than publication bias. It is impossible to discern publication bias from any other possible cause of asymmetry [22]. Second, considering the inclusion of cross-over trials in meta-analysis, the question of whether it is a suitable method for the condition should be addressed. Because all cross-over trials included in this study had sufficient washout periods to reduce carry-over (a type of periodby-intervention interaction), these were judged to be appropriate for meta-analysis [20]. Third, because many articles did not describe specific information on ESWT energy, mode, or combined therapy, we could not draw more conclusions through additional subgroup analysis and meta-regression.
In conclusion, ESWT effectively reduced spasticity levels measured with MAS regardless of patient group. Its effect maintained for 12 weeks. The number of shocks or the site of application had no significant influence on the therapeutic effect of ESWT in reducing spasticity. Thus, ESWT as a non-invasive, non-painful method could improve quality of life and facilitate rehabilitation by reducing spasticity. Further trials with ESWT are needed to address optimal parameters of the shock wave to reduce spasticity regarding its intensity, frequency, and numbers.

Notes

No potential conflict of interest relevant to this article was reported.

Conceptualization: Oh JH, Park HD. Methodology: Oh JH, Han SH. Formal analysis: Oh JH. Funding acquisition: none. Project administration: Shim GY, Choi KY. Visualization: Oh JH. Writing - original draft: Oh JH. Writing - review and editing: Oh JH, Park HD. Approval of final manuscript: all authors.

REFERENCES

1. Lance JW. Symposium synopsis. In : Feldman RG, Young RR, Koella WP, editors. Spasticity: disordered motor control. Chicago: Year Book Medical Publishers;1980. p. 485–4.
2. Sheean G. The pathophysiology of spasticity. Eur J Neurol. 2002; 9 Suppl 1:3–9.
crossref
3. Tsai KH, Yeh CY, Chang HY, Chen JJ. Effects of a single session of prolonged muscle stretch on spastic muscle of stroke patients. Proc Natl Sci Counc Repub China B. 2001; 25:76–81.
4. Matsumoto S, Kawahira K, Etoh S, Ikeda S, Tanaka N. Short-term effects of thermotherapy for spasticity on tibial nerve F-waves in post-stroke patients. Int J Biometeorol. 2006; 50:243–50.
crossref
5. Levin MF, Hui-Chan C. Are H and stretch reflexes in hemiparesis reproducible and correlated with spasticity? J Neurol. 1993; 240:63–71.
crossref
6. Panizza M, Balbi P, Russo G, Nilsson J. H-reflex recovery curve and reciprocal inhibition of H-reflex of the upper limbs in patients with spasticity secondary to stroke. Am J Phys Med Rehabil. 1995; 74:357–63.
crossref
7. Morris S. Ashworth and Tardieu Scales: their clinical relevance for measuring spasticity in adult and paediatric neurological populations. Phys Ther Rev. 2002; 7:53–62.
crossref
8. Yan T, Hui-Chan CW, Li LS. Functional electrical stimulation improves motor recovery of the lower extremity and walking ability of subjects with first acute stroke: a randomized placebo-controlled trial. Stroke. 2005; 36:80–5.
9. Bohannon RW, Smith MB. Interrater reliability of a modified Ashworth scale of muscle spasticity. Phys Ther. 1987; 67:206–7.
crossref
10. Chaussy C, Brendel W, Schmiedt E. Extracorporeally induced destruction of kidney stones by shock waves. Lancet. 1980; 2:1265–8.
crossref
11. Wang CJ. Extracorporeal shockwave therapy in musculoskeletal disorders. J Orthop Surg Res. 2012; 7:11.
crossref
12. Manganotti P, Amelio E. Long-term effect of shock wave therapy on upper limb hypertonia in patients affected by stroke. Stroke. 2005; 36:1967–71.
crossref
13. Dymarek R, Taradaj J, Rosinczuk J. The effect of radial extracorporeal shock wave stimulation on upper limb spasticity in chronic stroke patients: a single-blind, randomized, placebo-controlled study. Ultrasound Med Biol. 2016; 42:1862–75.
crossref
14. Gonkova MI, Ilieva EM, Ferriero G, Chavdarov I. Effect of radial shock wave therapy on muscle spasticity in children with cerebral palsy. Int J Rehabil Res. 2013; 36:284–90.
crossref
15. Amelio E, Manganotti P. Effect of shock wave stimulation on hypertonic plantar flexor muscles in patients with cerebral palsy: a placebo-controlled study. J Rehabil Med. 2010; 42:339–43.
crossref
16. Marinelli L, Mori L, Solaro C, Uccelli A, Pelosin E, Curra A, et al. Effect of radial shock wave therapy on pain and muscle hypertonia: a double-blind study in patients with multiple sclerosis. Mult Scler. 2015; 21:622–9.
crossref
17. Lee JY, Kim SN, Lee IS, Jung H, Lee KS, Koh SE. Effects of extracorporeal shock wave therapy on spasticity in patients after brain injury: a meta-analysis. J Phys Ther Sci. 2014; 26:1641–7.
18. Guo P, Gao F, Zhao T, Sun W, Wang B, Li Z. Positive effects of extracorporeal shock wave therapy on spasticity in poststroke patients: a meta-analysis. J Stroke Cerebrovasc Dis. 2017; 26:2470–2476.
crossref
19. Moher D, Liberati A, Tetzlaff J, Altman DG; PRISMA Group. Preferred reporting items for systematic reviews and meta-analyses: the PRISMA statement. J Clin Epidemiol. 2009; 62:1006–12.
crossref
20. Higgins J, Deeks JJ, Altman DG. Special topics in statistics. In : Higgins J, Green S, editors. Cochrane handbook for systematic reviews of interventions. Chichester: John Wiley & Sons;2008. p. 481–530.
21. Higgins J, Altman DG. Assessing risk of bias in included studies. In : Higgins J, Green S, editors. Cochrane handbook for systematic reviews of interventions. Chichester: John Wiley & Sons;2008. p. 184–242.
22. Deeks JJ, Higgins J, Altman DG. Analysing data and undertaking meta-analyses. In : Higgins J, Green S, editors. Cochrane handbook for systematic reviews of interventions. Chichester: John Wiley & Sons;2008. p. 243–96.
23. Taheri P, Vahdatpour B, Mellat M, Ashtari F, Akbari M. Effect of extracorporeal shock wave therapy on lower limb spasticity in stroke patients. Arch Iran Med. 2017; 20:338–43.
24. Yoon SH, Shin MK, Choi EJ, Kang HJ. Effective site for the application of extracorporeal shock-wave therapy on spasticity in chronic stroke: muscle belly or myotendinous junction. Ann Rehabil Med. 2017; 41:547–55.
crossref
25. Tirbisch L. Effects of radial shock wave therapy on sural triceps spasticity in hemiplegic patients in subacute phase: a controlled randomized trial. Kinésithérapie. 2015; 15:62–9.
26. Moon SW, Kim JH, Jung MJ, Son S, Lee JH, Shin H, et al. The effect of extracorporeal shock wave therapy on lower limb spasticity in subacute stroke patients. Ann Rehabil Med. 2013; 37:461–70.
crossref
27. Peters JL, Sutton AJ, Jones DR, Abrams KR, Rushton L. Performance of the trim and fill method in the presence of publication bias and between-study heterogeneity. Stat Med. 2007; 26:4544–62.
crossref
28. Santamato A, Micello MF, Panza F, Fortunato F, Logroscino G, Picelli A, et al. Extracorporeal shock wave therapy for the treatment of poststroke plantar-flexor muscles spasticity: a prospective open-label study. Top Stroke Rehabil. 2014; 21 Suppl 1:S17–24.
crossref
29. Kim YW, Shin JC, Yoon JG, Kim YK, Lee SC. Usefulness of radial extracorporeal shock wave therapy for the spasticity of the subscapularis in patients with stroke: a pilot study. Chin Med J (Engl). 2013; 126:4638–43.
30. Sohn MK, Cho KH, Kim YJ, Hwang SL. Spasticity and electrophysiologic changes after extracorporeal shock wave therapy on gastrocnemius. Ann Rehabil Med. 2011; 35:599–604.
crossref
31. Kim JH, Kim JY, Choi CM, Lee JK, Kee HS, Jung KI, Yoon SR. The dose-related effects of extracorporeal shock wave therapy for knee osteoarthritis. Ann Rehabil Med. 2015; 39:616–23.
crossref
32. Zhang X, Yan X, Wang C, Tang T, Chai Y. The doseeffect relationship in extracorporeal shock wave therapy: the optimal parameter for extracorporeal shock wave therapy. J Surg Res. 2014; 186:484–92.
crossref
33. Wang CJ, Yang KD, Wang FS, Hsu CC, Chen HH. Shock wave treatment shows dose-dependent enhancement of bone mass and bone strength after fracture of the femur. Bone. 2004; 34:225–30.
crossref
34. Rompe JD, Kirkpatrick CJ, Kullmer K, Schwitalle M, Krischek O. Dose-related effects of shock waves on rabbit tendo Achillis: a sonographic and histological study. J Bone Joint Surg Br. 1998; 80:546–52.
35. Sehgal N, McGuire JR. Beyond Ashworth: electrophysiologic quantification of spasticity. Phys Med Rehabil Clin N Am. 1998; 9:949–79.
crossref
36. Eisen A, Odusote K. Amplitude of the F wave: a potential means of documenting spasticity. Neurology. 1979; 29(9 Pt 1):1306–9.
crossref
37. Hultborn H, Nielsen JB. H‐reflexes and F‐responses are not equally sensitive to changes in motoneuronal excitability. Muscle Nerve. 1995; 18:1471–4.
crossref
38. Bakheit AM, Maynard VA, Curnow J, Hudson N, Kodapala S. The relation between Ashworth scale scores and the excitability of the alpha motor neurones in patients with post-stroke muscle spasticity. J Neurol Neurosurg Psychiatry. 2003; 74:646–8.
crossref
39. Dymarek R, Ptaszkowski K, Słupska L, Halski T, Taradaj J, Rosinczuk J. Effects of extracorporeal shock wave on upper and lower limb spasticity in poststroke patients: a narrative review. Top Stroke Rehabil. 2016; 23:293–303.
crossref

Fig. 1.
Preferred Reporting Items for Systemic Reviews and MetaAnalysis (PRISMA) flow chart. RCT, randomized controlled trial; ES, electrical stimulation; ESWT, extracorporeal shockwave therapy; MAS, Modified Ashworth Scale.
arm-2019-43-2-163f1.tif
Fig. 2.
Risk of bias graph illustrating the proportion of studies with each judgement (‘Yes’, ‘No’, or ‘Unclear’) for each entry in the tool.
arm-2019-43-2-163f2.tif
Fig. 3.
Risk of bias summary. It presented all judgements in a cross-tabulation of study by entry of + (Yes), – (No), and ? (Unclear).
arm-2019-43-2-163f3.tif
Fig. 4.
Funnel plot to evaluate publication bias at (A) immediately after ESWT application, (B) 1 week after ESWT application, (C) 4 weeks after ESWT application, and (D) 12 weeks after ESWT application. Std diff, standard difference. ESWT, extracorporeal shockwave therapy.
arm-2019-43-2-163f4.tif
Fig. 5.
Forest plot of effect sizes at (A) immediately after ESWT application, (B) after excluding outliers (Manganotti-F and Gonkova). ESWT, extracorporeal shockwave therapy; Std diff, standard difference; CI, confidence interval; E, elbow joint; RC, radio-carpal joint; FF, finger joints; GCM, gastrocnemius; W, wrist flexors; F, finger flexors.
arm-2019-43-2-163f5.tif
Fig. 6.
(A) Sensitivity analysis with effect sizes, sample size, weight, and residual (immediately after ESWT application). (B) Sensitivity analysis with effect sizes after excluding studies one by one (immediately after ESWT application). ESWT, extracorporeal shockwave therapy; Std diff, standard difference; CI, confidence interval; E, elbow joint; RC, radio-carpal joint; FF, finger joints; GCM, gastrocnemius; W, wrist flexors; F, finger flexors.
arm-2019-43-2-163f6.tif
Fig. 7.
(A) Sensitivity analysis with effect sizes, sample size, weight, and residual (1 week after ESWT application). (B) Sensitivity analysis with effect sizes after excluding studies one by one (1 week after ESWT application). ESWT, extracorporeal shockwave therapy; Std diff, standard difference; CI, confidence interval; W, wrist flexors; F, finger flexors.
arm-2019-43-2-163f7.tif
Fig. 8.
Forest plot of the effect sizes 1 week after extracorporeal shockwave therapy (ESWT). Std diff, standard difference; CI, confidence interval; W, wrist flexors; F, finger flexors.
arm-2019-43-2-163f8.tif
Fig. 9.
(A) Sensitivity analysis with effect sizes, sample size, weight, and residual (4 weeks after the ESWT application). (B) Sensitivity analysis with effect sizes after excluding studies one by one (4 weeks after the ESWT application). ESWT, extracorporeal shockwave therapy; Std diff, standard difference; CI, confidence interval; W, wrist flexors; F, finger flexors.
arm-2019-43-2-163f9.tif
Fig. 10.
Forest plot of effect sizes 4 weeks after extracorporeal shockwave therapy (ESWT). Std diff, standard difference; CI, confidence interval; W, wrist flexors; F, finger flexors.
arm-2019-43-2-163f10.tif
Fig. 11.
(A) Sensitivity analysis with effect sizes, sample size, weight, and residual (12 weeks after ESWT application). (B) Sensitivity analysis with effect sizes after excluding studies one by one (12 weeks after ESWT application). ESWT, extracorporeal shockwave therapy; Std diff, standard difference; CI, confidence interval; W, wrist flexors; F, finger flexors.
arm-2019-43-2-163f11.tif
Fig. 12.
Forest plot of the effect sizes 12 weeks after extracorporeal shockwave therapy (ESWT). Std diff, standard difference; CI, confidence interval; W, wrist flexors; F, finger flexors.
arm-2019-43-2-163f12.tif
Fig. 13.
Scatterplot of meta-regression under the randomeffects model (immediately after ESWT application). ESWT, extracorporeal shockwave therapy.
arm-2019-43-2-163f13.tif
Fig. 14.
Forest plots of knee and ankle-joints group and elbow, wrist, and finger joints group depending on the application site (immediately after ESWT application). ESWT, extracorporeal shockwave therapy; E, elbow joint; RC, radio-carpal joint; FF, finger joints; GCM, gastrocnemius.
arm-2019-43-2-163f14.tif
Table 1.
Detailed characteristics of individual studies (randomized controlled trials)
Study (year) Participants
Intervention
Comparison
Outcome
Lesion No. of patients (treated/control) Duration of illness (mo)
ESWT energy (mJ/mm2) Mode Application focus Treated muscle Total counts (shots) Tested muscle MAS (baseline)
MAS
Follow-up time points (after the end of sessions)
Treated Control Treated Control Treated Control
Taheri et al. [23] (2017) Stroke 14/14 33±21.4 25.8±9.9 0.1 NA Myotendinous junction GCM 4500 GCM 2.6±0.5 2.5±0.5 1.8±0.5 (immediately after) 2.1±0.7 (immediately after) Immediately after, 9 weeks after
Yoon et al. [24] (2017) Stroke 54/26 (elbow flexor) 100.3±98.3a) 63.5±94.1c) 0.068–0.093 NA Muscle belly, myotendinous junction BB, semitendinosus 4500 BB 2.8±0.7a) 2.6±0.6c) 2.6±0.8a) 2.6±0.6c) Immediately after
66.8±51.9b) 2.9±0.5b) 2.7±0.6b)
26/28 (knew flexor) 99.1±85.1d) 38.7±30.2f) Semitendinosus 2.9±1.0d) 2.4±0.7f) 2.4±0.8d) 2.4±0.7f) Immediately after
51.1±36.0e) 2.9±0.6e) 2.3±0.6e)
Dymarek et al. [13] (2016) Stroke 30/30 51.30±25.46 51.53±26.13 0.03 Radial Muscle belly FCR, FCU 1500 Elbow 1.5±0.5 1.6±0.7 1.3±0.7 (immediately after) 1.6±0.8 (immediately after) Immediately after, 1 hr after, 24 hr after
RC 1.7±0.7 1.8±0.9 1.3±0.5 (immediately after) 1.7±0.8 (immediately after)
FF 2.1±0.9 1.7±0.7 1.5±0.8 (immediately after) 1.7±0.7 (immediately after)
Marinelli et al. [16] (2015) Multiple sclerosis 34/34 NA NA Radial Muscle belly, myotendinous junction GCM, soleus, achilles tendon 8000 Ankle extensor 2.7±0.8 2.6±1.0 2.6±0.9 2.5±1.1 (4 weeks after) 1 week after, 4 weeks after
Tirbisch [25] (2015) Stroke 4/4 0.75–6 0.03 NA Myotendinous junction GCM, soleus 18000 GCM 3.0±0.8 1.8±0.9 1.4±0.5 1.5±1.7 Immediately after
Soleus 2.9±1.0 1.5±1.2 1.5±1.3 1.1±1.4 Immediately after

Values are presented as mean±standard deviation.

ESWT, extracorporeal shockwave therapy; MAS, Modified Ashworth Scale; NA, not applicable; GCM, gastrocnemius; PT, physiotherapy; BB, biceps brachii; FCR, flexor carpi radialis; FCU, flexor carpi ulnaris; RC, radio-carpal joint; FF, finger flexor joint.

a) Belly group,

b) junction group,

c) control group for elbow flexor,

d) belly group,

e) junction group, and

f) control group for knee flexor.

Table 2.
Detailed characteristics of individual studies (cross-over trials)
Study (year) Participants
Intervention
Comparison
Outcome
Lesion No. of patients Duration of illness ESWT energy (mJ/mm2) ESWT mode Application focus Treated muscle Total counts (shots) Tested muscle MAS (baseline) MAS Follow-up time points
Moon et al. [26] (2013) Stroke 30 80.5±46.5 days 0.089 NA Myotendinous junction GCM 4500 GCM 2.5±0.7 1.8±0.6 (4 weeks after) Immediately after, 1 week after, 4 weeks after
Gonkova et al. [14] (2013) Cerebral palsy 25 4.84±3.11 years NA Radial Muscle belly GCM, soleus 1500 Ankle extensor 2.7±0.1 2.2±0.1 (4 weeks after) Immediately after, 2 weeks after, 4 weeks after
Amelio and Manganotti [15] (2010) Cerebral palsy 12 8.0±2.31 years 0.03 NA Muscle belly GCM, soleus 1500 Ankle extensor 3.3±0.5 2.8±0.6 (12 weeks after) Immediately after, 1 week after, 4 weeks after, 12 weeks after
Manganotti and Amelio [12] (2005) Stroke 20 Stroke ≥9 months 0.03 NA Muscle belly, myotendinous junction Hypertonic forearm muscles, interosseus of hands 4700 Wrist flex- 3.4±0.7 3.0±0.5 (12 weeks after) Immediately after, 1 week after, 4 weeks after, 12 weeks after
Finger flexors 3.2±0.6 1.8±0.7 (12 weeks after)

Values are presented as mean±standard deviation.

ESWT, extracorporeal shockwave therapy; MAS, Modified Ashworth Scale; NA, not applicable; GCM, gastrocnemius.

TOOLS
Similar articles