INTRODUCTION
MATERIALS AND METHODS
RESULTS
General patient characteristics
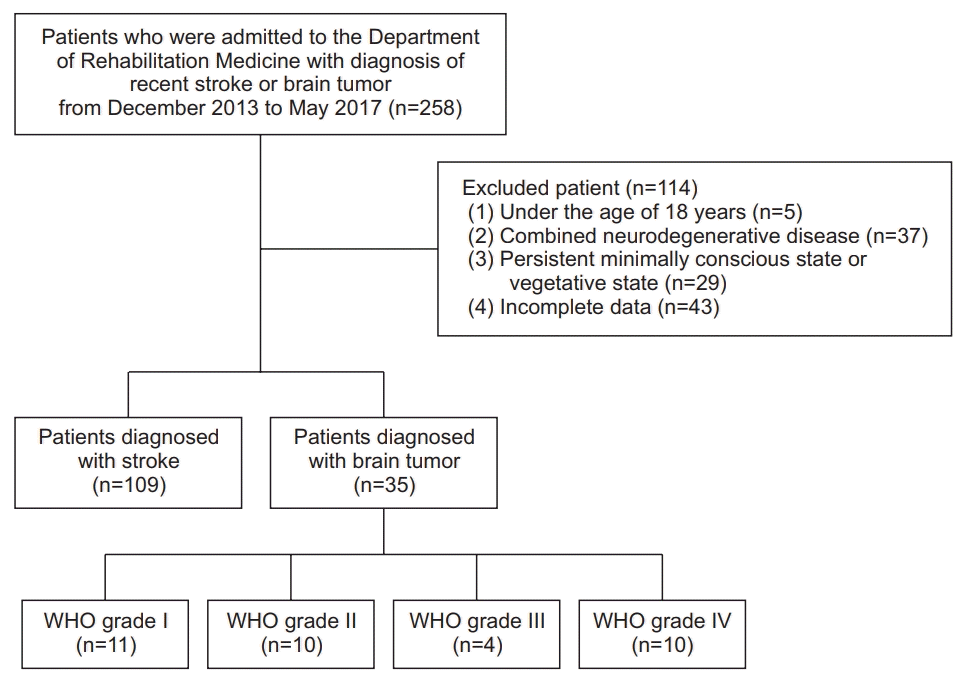
Fig. 1.

Table 1.
Values are presented as number or mean±standard deviation or number of patients (%).
Mean value and the percentage of each groups were compared by independent t-test.
Continuous data were tested by independent t-test and categorical data were tested by chi-square test.
WHO, World Health Organization; NA, not applicable.
Table 2.
| Benign brain tumor (n=21) | Malignant brain tumor (n=14) | p-value | |
|---|---|---|---|
| Lesion location | 0.537 | ||
| Right frontal | 4 (19.0) | 3 (21.4) | |
| Right temporal | 2 (9.5) | 2 (14.3) | |
| Right parietal | 0 (0) | 1 (7.1) | |
| Right hypothalamus | 1 (4.8) | 0 (0) | |
| Right thalamus | 0 (0.0) | 1 (7.1) | |
| Left frontal | 1 (4.8) | 1 (7.1) | |
| Left temporal | 4 (19.0) | 2 (14.3) | |
| Left parietal | 1 (4.8) | 1 (7.1) | |
| Left thalamus | 0 (0) | 1 (7.1) | |
| Left cingulate gyrus | 0 (0) | 1 (7.1) | |
| Left lateral ventricle | 3 (14.3) | 0 (0.0) | |
| Cerebellum | 1 (4.8) | 1 (7.1) | |
| Brain stem | 3 (14.3) | 0 (0) | |
| Skull base | 1 (4.8) | 0 (0) | |
| Lesion size, long axis (cm) | 0.537 | ||
| 2–3 | 3(14.3) | 2 (14.3) | |
| 3–4 | 7 (33.3) | 4 (28.6) | |
| 4–5 | 6 (28.6) | 2 (14.3) | |
| 5–6 | 4 (19.0) | 3 (21.4) | |
| 6–7 | 1 (4.8) | 3 (21.4) | |
| Treatment modality | <0.001*** | ||
| Surgery | 13 (61.9) | 0 (0) | |
| Surgery+chemotherapy | 1 (4.8) | 2 (14.3) | |
| Surgery+radiotherapy | 7 (33.3) | 4 (28.6) | |
| Surgery+chemotherapy+radiotherapy | 0 (0) | 8 (57.1) | |
| Recurrence | |||
| Primary | 16 (76.2) | 8 (57.1) | <0.001*** |
| Recurrent | 5 (23.8) | 6 (42.9) | |
| Initial ECOG scale | |||
| 1 | 2 (9.5) | 0 (0) | 0.071 |
| 2 | 4 (19.0) | 3 (14.3) | |
| 3 | 7 (33.3) | 9 (42.9) | |
| 4 | 8 (38.1) | 2 (9.5) |
Values are presented as number of patients (%).
Benign brain tumor subgroup included atypical meningioma, atypical neurocytoma, chordoid glioma, chordoma, craniopharyngioma, hemangioblastoma, meningothelial meningioma, pilocytic astrocytoma, pleomorphic xanthoastrocytoma, reactive gliosis and schwannoma. Malignant brain tumor subgroup included anaplastic astrocytoma and glioblastoma.
ECOG, Eastern Cooperative Oncology Group.
Rehabilitation outcomes
Fig. 2.

Table 3.
|
Brain tumor group (n=35) |
Stroke group (n=108) |
p-valuea) (between groups) | |||||
|---|---|---|---|---|---|---|---|
| Baseline | Discharge | p-value (within groups) | Baseline | Discharge | p-value (within groups) | ||
| FMA score | 34.5±22.2 | 49.1±17.5 | <0.001*** | 30.1±21.6 | 41.8±21.0 | <0.001*** | 0.737 |
| BBS score | 17.0±15.9 | 35.6±17.7 | <0.001*** | 20.7±18.0 | 35.2±17.7 | <0.001*** | 0.929 |
| K-MBI score | 36.9±18.5 | 58.3±20.1 | <0.001*** | 38.6±21.0 | 56.7±23.2 | <0.001*** | 0.447 |
| K-MMSE score | 17.3±10.1 | 23.1±7.6 | <0.001*** | 16.7±8.2 | 21.1±7.1 | <0.001*** | 0.569 |
| IQ score | 67.1±18.1 | 78.9±14.8 | <0.001*** | 69.6±18.4 | 78.5±18.4 | <0.001*** | 0.180 |
Values are presented as mean±standard deviation.
FMA, Fugl-Meyer Assessment; BBS, Berg Balance Scale; K-MBI, Korean version of Modified Barthel Index; K-MMSE, Korean Mini-Mental State Examination; IQ, intelligence quotient.
Table 4.
|
Benign brain tumor (n=21) |
Malignant brain tumor (n=14) |
p-valuea) (between groups) | |||||
|---|---|---|---|---|---|---|---|
| Baseline | Discharge | p-value (within groups) | Baseline | Discharge | p-value (within groups) | ||
| FMA score | 36.7±22.3 | 51.1±15.4 | <0.001*** | 31.1±20.8 | 45.9±20.7 | 0.002** | 0.434 |
| BBS score | 19.1±17.1 | 38.0±15.7 | <0.001*** | 13.9±13.0 | 32.1±20.1 | 0.002** | 0.210 |
| K-MBI score | 37.7±20.2 | 61.4±21.6 | <0.001*** | 35.9±15.6 | 53.8±18.4 | 0.016* | 0.702 |
| K-MMSE score | 15.5±7.3 | 23.5±5.1 | <0.001*** | 19.3±9.8 | 22.6±7.1 | <0.001*** | 0.220 |
| IQ score | 63.9±16.1 | 79.1±12.8 | 0.001** | 71.5±20.7 | 78.5±17.7 | 0.002** | 0.156 |
| ECOG scale | 3.0±0.8 | 2.9±0.4 | <0.001*** | 1.86±0.7 | 2.1±0.7 | 0.011* | 0.175 |
Values are presented as mean±standard deviation.
FMA, Fugl-Meyer Assessment; BBS, Berg Balance Scale; K-MBI, Korean version of Modified Barthel Index; K-MMSE, Korean Mini-Mental State Examination; IQ, intelligence quotient; ECOG, Eastern Cooperative Oncology Group.
Table 5.
| Variable | Outcome | Predictor | Adjusted R2 | p-value |
|---|---|---|---|---|
| Brain tumor group | Change of FMA | Baseline FMA | 0.032 | <0.001*** |
| Change of BBS | Baseline BBS | 0.084 | 0.041* | |
| Change of MBI | Baseline K-MBI | 0.354 | 0.034* | |
| Change of K-MMSE | Baseline K-MMSE | 0.354 | <0.001*** | |
| Baseline IQ | 0.200 | 0.004** | ||
| Change of IQ | Baseline K-MMSE | 0.181 | 0.006** | |
| Baseline IQ | 0.402 | <0.001*** | ||
| Benign tumor subgroup | Change of FMA | Baseline K-MMSE | 0.263 | 0.010* |
| Baseline IQ | 0.456 | <0.001*** | ||
| Change of BBS | Baseline BBS | 0.150 | 0.047* | |
| Change of K-MBI | Baseline K-MBI | 0.219 | 0.019* | |
| Change of K-MMSE | Baseline K-MMSE | 0.918 | 0.005** | |
| Baseline IQ | 0.294 | 0.007** | ||
| Change of IQ | Baseline K-MBI | 0.344 | 0.003** | |
| Malignant tumor subgroup | Change of BBS | Baseline FMA | 0.252 | 0.039* |
| Change of K-MBI | Baseline K-MBI | 0.185 | 0.029* | |
| Change of K-MMSE | Baseline K-MBI | 0.373 | 0.012* | |
| Baseline K-MMSE | 0.337 | 0.017* | ||
| Change of IQ | Baseline IQ | 0.256 | 0.038* |
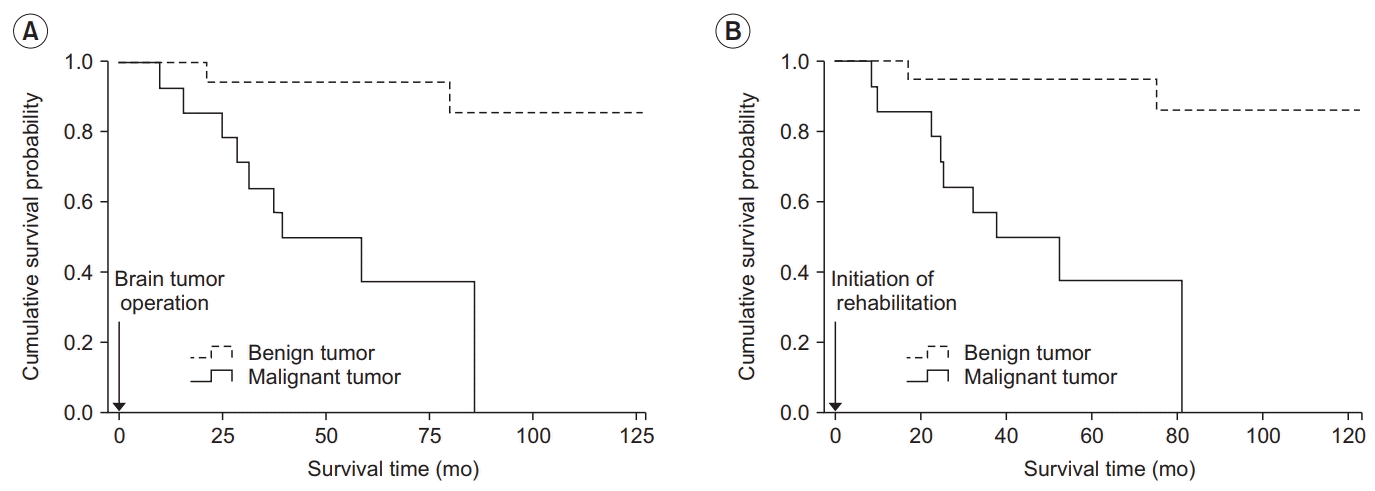
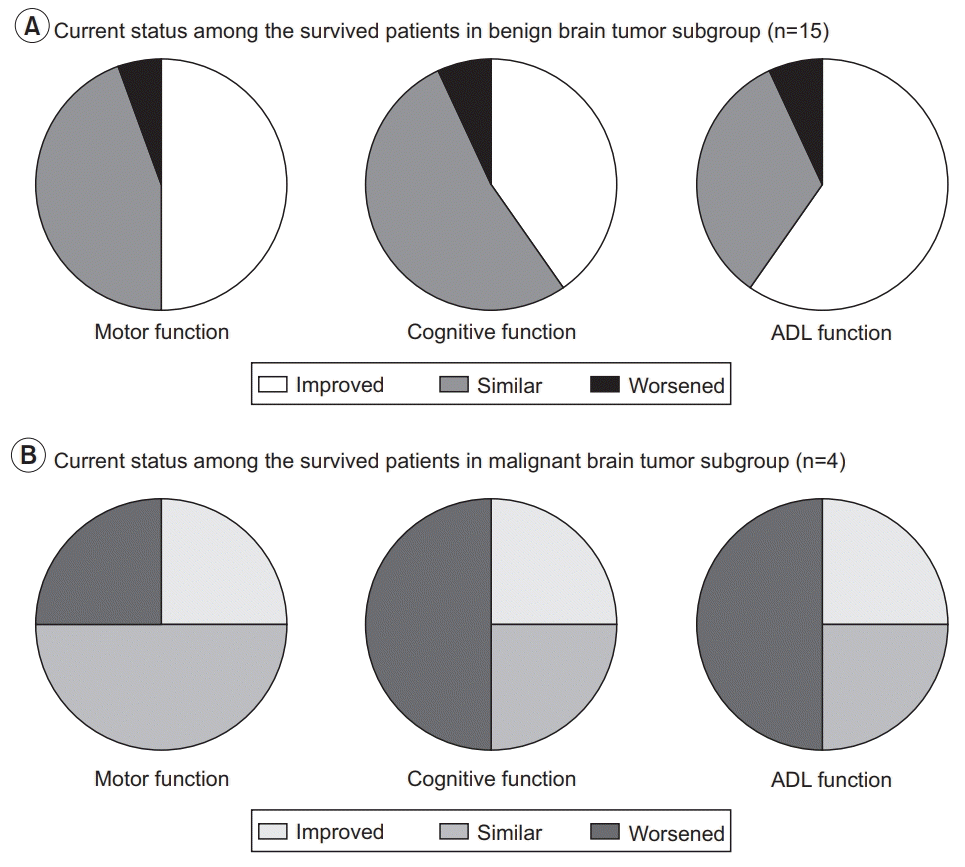
Long-term survival
Fig. 3.

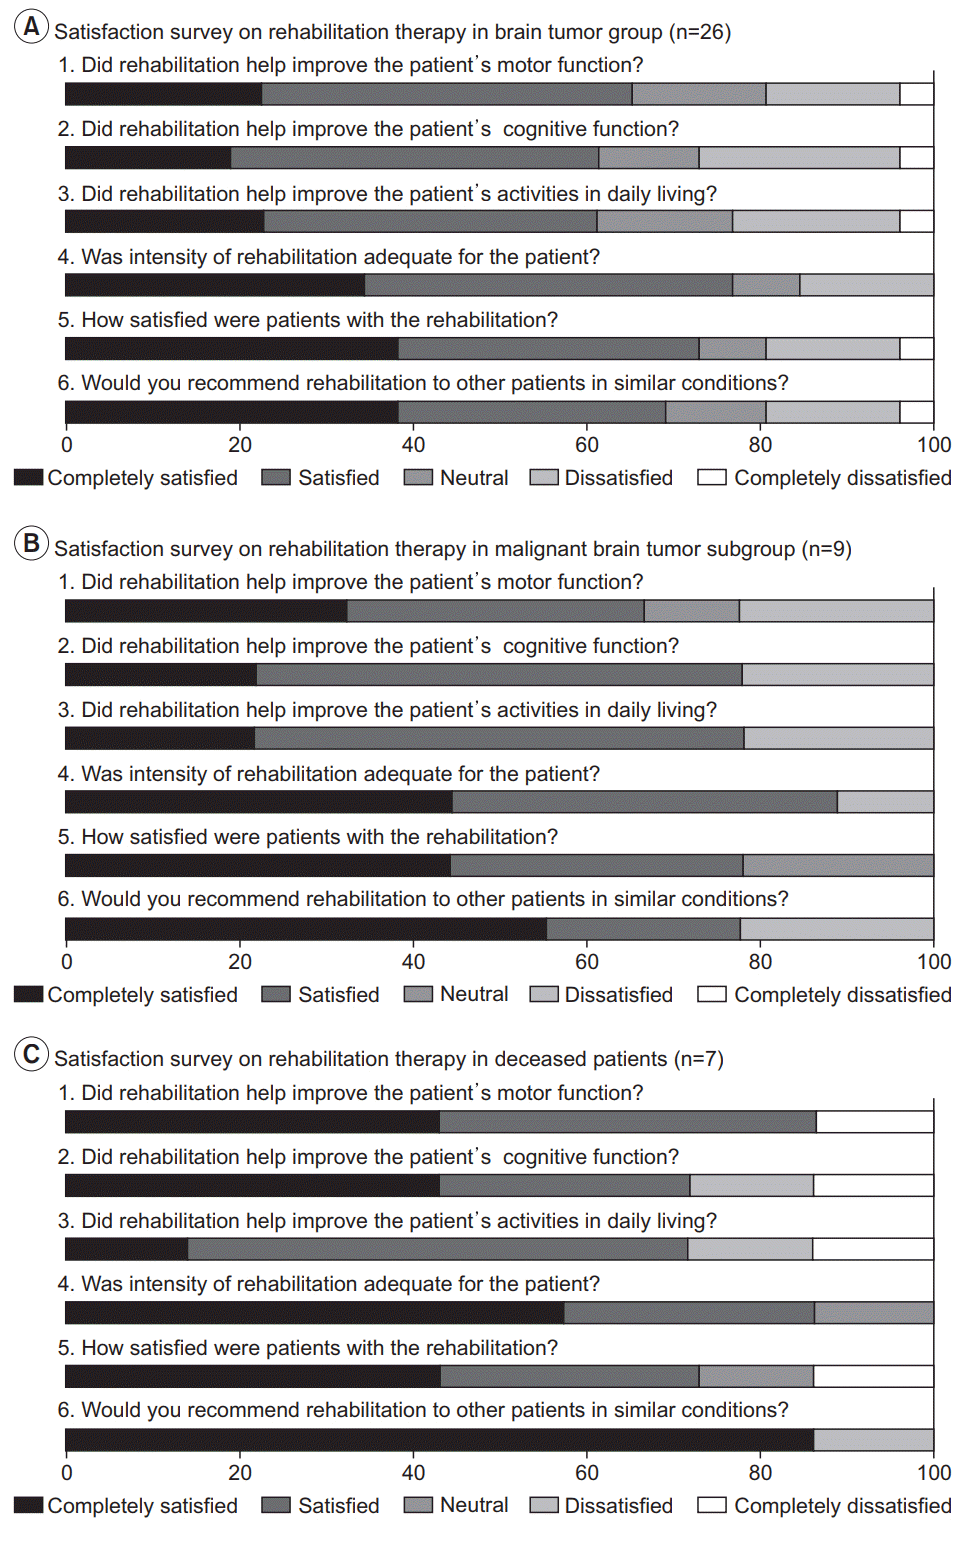
Long-term satisfaction
Fig. 4.


 PDF
PDF Citation
 Print
Print


 XML Download