INTRODUCTION
MATERIALS AND METHODS
Study participants
Variables and data collection
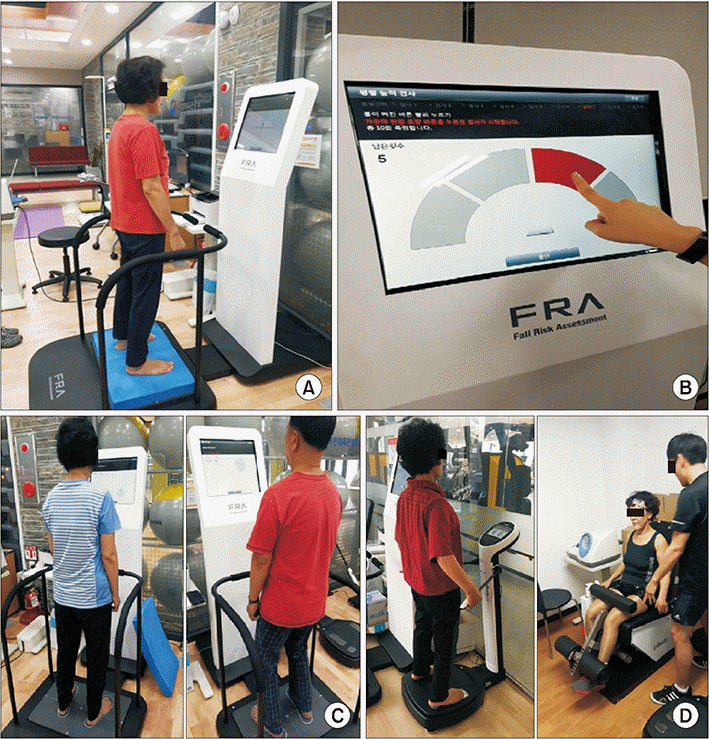
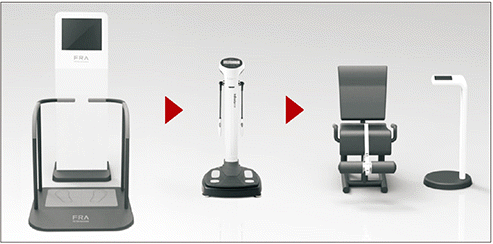
Fall Risk Assessment system
mCTSIB for sensory system score
Fig. 2.

Reaction time and latent reaction time tests for reaction score
Shifting velocity test and target tracking test for integrated balance ability score
Leg muscle mass and leg muscle strength test for muscular system score
Composite FRA score
Statistical analysis
RESULTS
Table 1.
| Variable | No. of participants (%) | Composite FRA score | p-value |
|---|---|---|---|
| Age (yr) | <0.001*** | ||
| 65–69 | 20 (6.9) | 75.1±6.2 | |
| 70–74 | 76 (26.3) | 68.7±6.7 | |
| 75–79 | 116 (40.1) | 67.0±7.9 | |
| 80–84 | 63 (21.8) | 66.9±7.0 | |
| ≥85 | 14 (4.8) | 61.7±7.7 | |
| Sex | 0.001** | ||
| Male | 87 (30.1) | 70.0±6.9 | |
| Female | 202 (69.9) | 66.8±7.7 | |
| Educational statusa) | <0.001*** | ||
| High | 230 (79.6) | 68.8±7.6 | |
| Low | 59 (20.4) | 63.6±6.4 | |
| Living alone | 0.001** | ||
| No | 120 (41.5) | 69.6±8.0 | |
| Yes | 169 (58.5) | 66.5±7.1 | |
| Injurious fallers | 0.799 | ||
| No | 263 (91.0) | 67.7±7.7 | |
| Yes | 26 (9.0) | 68.1±7.3 | |
| Use of an assistive device | 0.322 | ||
| No | 279 (96.5) | 67.8±7.7 | |
| Yes | 10 (3.5) | 65.4±5.6 | |
| Psychotropic drug userb) | 0.553 | ||
| No | 259 (89.6) | 67.8±7.5 | |
| Yes | 30 (10.4) | 67.0±8.9 | |
| Physical activity (MET min/wk)c) | 0.201 | ||
| <600 | 250 (86.5) | 67.5±7.5 | |
| ≥600 | 39 (13.5) | 69.2±8.3 | |
| BMI (kg/m2) | 0.009** | ||
| Underweight (<18.5) | 6 (2.1) | 62.3±6.1 | |
| Normal weight (18.5–22.9) | 63 (21.8) | 65.4±8.0 | |
| Overweight (23.0–24.9) | 71 (24.6) | 68.7±6.2 | |
| Obesity (≥25.0) | 149 (51.5) | 68.5±7.0 | |
| Dizziness | 0.514 | ||
| No | 280 (96.9) | 67.8±7.6 | |
| Yes | 9 (3.1) | 66.1±8.4 | |
| Visual deficitd) | 0.054 | ||
| No | 236 (81.7) | 68.2±7.7 | |
| Yes | 53 (18.3) | 65.9±7.0 | |
| Irritative LUTSe) | 0.008** | ||
| No | 106 (36.7) | 69.2±6.6 | |
| Yes | 183 (63.3) | 66.9±8.0 |
Values are presented as number (%) or mean±standard deviation.
FRA, Fall Risk Assessment system; MET, metabolic equivalent of task; BMI, body mass index; ALMI, appendicular lean mass index; LUTS, lower urinary tract symptoms.
a) High educational status was defined as attending education further than elementary school while low educational status was defined as completion of elementary school or below.
b) Psychotropic drug use was defined as regular and persistent use of sedatives, hypnotics, antidepressants, or antipsychotics for at least last 6 weeks.
c) Physical activity was defined as the total sum of walking, moderate-intensity physical activity, and vigorous intensity activity.
Table 2.
| Pearson correlation coefficient | p-value | |
|---|---|---|
| SPPB | 0.394 | <0.001*** |
| BBS | 0.399 | <0.001*** |
| TUG | -0.362 | <0.001*** |
Table 3.
|
Unadjusted model |
Adjusted model |
|||
|---|---|---|---|---|
| β coefficient | p-value | β coefficient | p-value | |
| SPPB | 1.703 | <0.001 | 1.012 | <0.001*** |
| BBS | 1.017 | <0.001 | 0.481 | <0.001*** |
| TUG | -1.356 | <0.001 | -0.831 | <0.001*** |
Analyses were adjusted by age, sex, educational status, living alone, use of assistive device, BMI, ALMI, dizziness, visual deficit, and irritative LUTS. Age, BMI, and ALMI were used as continuous variables.
FRA, Fall Risk Assessment system; SPPB, Short Physical Performance Battery; BBS, Berg Balance Scale; TUG, Timed Up and Go Test; BMI, body mass index; ALMI, appendicular lean mass index; LUTS, lower urinary tract symptoms.


 PDF
PDF Citation
 Print
Print


 XML Download