Abstract
Purpose
Materials and Methods
Results
REFERENCES
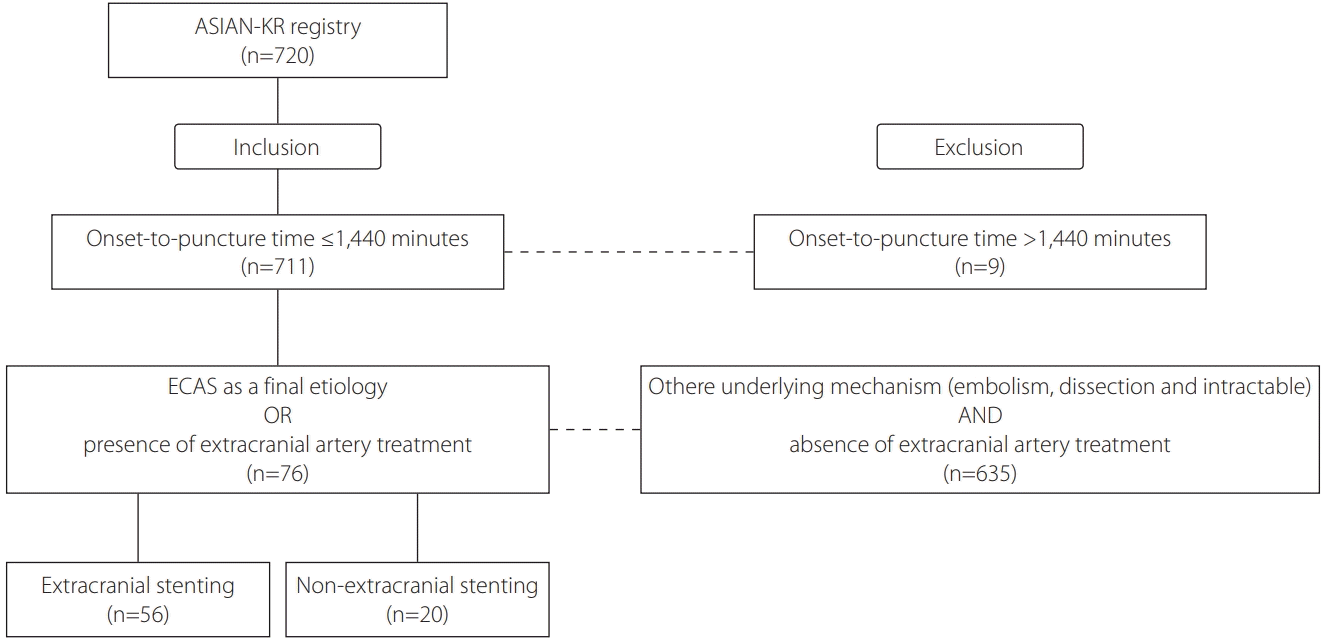
Fig. 1.

Table 1.
Table 2.
Table 3.
Values are presented as mean±standard deviation or number (%) unless otherwise indicated.
EVT, endovascular treatment; OR, odds ratio; CI, confidence interval; TIA, transient ischemic attack; NIHSS, National Institutes of Health Stroke Scale; ICA, internal carotid artery; MCA, middle cerebral artery; ASPECTS, Alberta Stroke Program Early CT Score; IV, intravenous.
Table 4.
|
Univariate analysis |
Multivariate analysis |
||||
|---|---|---|---|---|---|
| Poor outcomes (n=31) | Good outcomes (n=45) | P-value | OR (95% CI) | P-value | |
| Age | 71.9±9.5 | 66.6±7.0 | 0.007 | 0.918 (0.848–0.993) | 0.033 |
| Sex, men | 27 (87.1) | 38 (84.4) | 0.747 | 0.841 (0.162–4.353) | 0.837 |
| Hypertension | 22 (71.0) | 29 (64.4) | 0.552 | ||
| Diabetes mellitus | 10 (32.3) | 16 (35.6) | 0.766 | 0.687 (0.177–2.665) | 0.587 |
| Atrial fibrillation | 7 (22.6) | 4 (8.9) | 0.095 | 0.216 (0.027–1.718) | 0.147 |
| Smoker | 7 (22.6) | 20 (44.4) | 0.050 | ||
| Dyslipidemia | 8 (25.8) | 16 (35.6) | 0.369 | ||
| Premorbid mRS score, median | 0 (0–1) | 0 (0–0) | 0.635 | ||
| Initial NIHSS score, median | 19 (11–22) | 14 (10–17) | 0.126 | 0.895 (0.801–0.999) | 0.049 |
| Initial occlusion site | 0.453 | ||||
| ICA, T-type | 15 (48.4) | 25 (55.6) | |||
| MCA, M1 | 11 (35.5) | 17 (37.8) | |||
| MCA, M2 | 1 (3.2) | 0 (0.0) | |||
| Vertebrobasilar artery | 3 (9.7) | 1 (2.2) | |||
| None, only extracranial ICA | 1 (3.2) | 2 (4.4) | |||
| ASPECTS score, median | 6.5 (4.3–8.8) (n=24) | 6 (7–9) (n=41) | 0.610 | ||
| Onset to puncture time (minutes) | 461.3±332.8 | 359.5±224.2 | 0.144 | 0.998 (0.996–1.000) | 0.117 |
| Puncture to final time (minutes) | 89.7±55.2 | 71.0±36.9 | 0.104 | ||
| Prior history of TIA or stroke | 5 (16.1) | 8 (17.8) | 0.851 | ||
| Prior usage of antiplatelets | 6 (19.4) | 14 (31.1) | 0.253 | ||
| Prior usage of anticoagulants | 1 (3.2) | 2 (4.4) | 0.789 | ||
| Initial systolic blood pressure (mmHg) | 156.0±26.1 | 161.0±29.2 | 0.450 | ||
| Initial diastolic blood pressure (mmHg) | 85.6±12.6 | 85.9±16.9 | 0.929 | ||
| Hemoglobin (g/dL) | 13.4±1.6 | 13.7±1.4 | 0.354 | ||
| White blood cell (×109/L) | 10.6±3.6 | 9.3±2.9 | 0.090 | ||
| Platelet (×109/L) | 234.8±69.4 | 267.7±83.3 | 0.075 | ||
| Glucose (mg/dL) | 143.3±73.9 | 135.7±47.7 | 0.586 | ||
| Total cholesterol (mg/dL) | 174.5±46.9 | 171.1±46.1 | 0.753 | ||
| Low-density lipoprotein (mg/dL) | 111.0±46.6 | 108.3±40.3 | 0.787 | ||
| High-density lipoprotein (mg/dL) | 43.0±10.2 | 40.4±9.1 | 0.255 | ||
| Triglyceride (mg/dL) | 152.7±286.9 | 129.1±83.3 | 0.604 | ||
| IV thrombolysis | 11 (35.5) | 23 (51.1) | 0.178 | 1.059 (0.236–4.752) | 0.940 |
| Use of balloon guide catheter | 17 (54.8) | 33 (73.3) | 0.095 | ||
| Remote aspiration with balloon guide catheter | 7 (22.6) | 16 (35.6) | 0.226 | ||
| Stent retrieval | 14 (45.2) | 9 (20.0) | 0.019 | ||
| Contact aspiration | 19 (61.3) | 34 (75.6) | 0.183 | ||
| Local tirofiban infusion | 4 (12.9) | 7 (15.6) | 0.747 | ||
| Extracranial stenting* | 23 (74.2) | 33 (73.3) | 0.933 | 0.530 (0.117–2.395) | 0.409 |
| Successfulreperfusion | 23 (74.2) | 41 (91.1) | 0.047 | 13.892 (2.132–90.538) | 0.006 |
| Post-procedure intracerebral hemorrhage, any type* | 15 (48.4) | 11 (24.4) | 0.037 | 0.202 (0.054–0.759) | 0.018 |
| Post-procedure subarachnoid hemorrhage, any type | 3 (9.7) | 2 (4.4) | 0.294 | ||
Values are presented as mean±standard deviation or number (%) unless otherwise indicated.
OR, odds ratio; CI, confidence interval; mRS: modified Rankin Scale; NIHSS; National Institutes of Health Stroke Scale; ICA, internal carotid artery; MCA, middle cerebral artery; ASPECTS, Alberta Stroke Program Early CT Score; TIA, transient ischemic attack; IV, intravenous.


 PDF
PDF Citation
 Print
Print


 XML Download