Abstract
Objective
To investigate changes of cardiac and muscle damage markers in exercise-induced hypertension (EIH) runners before running (pre-race), immediately after completing a 100-km ultramarathon race, and during the recovery period (24, 72, and 120 hours post-race).
Methods
In this observational study, volunteers were divided into EIH group (n=11) whose maximum systolic blood pressure was ≥210 mmHg in graded exercise testing and normal exercise blood pressure response (NEBPR) group (n=11). Their blood samples were collected at pre-race, immediately after race, and at 24, 72, and 120 hours post-race.
Results
Creatine kinase (CK) and cardiac troponin I (cTnI) levels were significantly higher in EIH group than those in the NEBPR group immediately after race and at 24 hours post-race (all p<0.05). However, lactate dehydrogenase (LDH), creatine kinase-myocardial band (CKMB), or CKMB/CK levels did not show any significant differences between the two groups in each period. N-terminal pro-brain natriuretic peptide (NT-proBNP) levels were significantly higher in EIH group than those in NEBPR group immediately after race and at 24 and 72 hours post-race (all p<0.05). A high sensitivity C-reactive protein (hs-CRP) level was significantly higher in EIH group than that in NEBPR group at 24 hours post-race (p<0.05).
Conclusion
The phenomenon of higher inflammatory and cardiac marker levels in EIH group may exaggerate cardiac volume pressure and blood flow restrictions which in turn can result in cardiac muscle damage. Further prospective studies are needed to investigate the chronic effect of such phenomenon on the cardiovascular system in EIH runners.
An ultramarathon is a long-distance running activity that lasts longer than a normal marathon (42.195 km). Sufficient researches have been made on cardiac markers in ultramarathon runners after running 100, 161, 216, 246, or 308 km [1-5]. Exercise training has been proven to be beneficial for preventing and treating cardiovascular diseases as well as lowering mortality [6,7]. However, expression levels of cardiac markers and other biomarkers in vigorous long-distance races such as marathon and ultramarathon are known to be different from those in moderate-intensity aerobic exercises because conditions and environments of running vary depending on distances [8]. Although marathons are shorter than ultramarathons in terms of distance, they usually result in higher expression levels of myocardial injury markers such as cardiac troponin because they entail higher-intensity running [9]. In contrast, ultramarathons increase markers of myocardial load such as N-terminal pro-brain natriuretic peptide (NT-proBNP) because of their longer distance than marathons [10].
The mechanism by which levels of cardiac markers are increased to exceed their upper reference limits (URLs) in a long-distance running has not been clearly known. Recently, it has been reported that expression levels of cardiac markers in exercise-induced hypertension (EIH) runners are higher than those in ultramarathon runners with normal response [11]. EIH runners have been reported to have higher myocardial load and increased skeletal muscle damage during marathon [12].
EIH is defined as resting blood pressure (BP) <140/90 mmHg with maximal systolic blood pressure (SBP) during exercise ≥210 mmHg [13]. EIH is likely to shift to high resting BP in the future [14]. It is considered a risk factor of cardiocerebrovascular diseases [15,16].
In this study, EIH runners were examined at pre-race, immediately after an ultramarathon race, and during the recovery period to identify physiological expression of cardiac markers and associated biomarkers indicating changes in physiological responses of heart and skeletal muscles.
Normotensive volunteers who provided written informed consent were enrolled in this study after experimental protocol was approved by Inje University Research Committee (No. 10-95). Participants were required to have completed at least one 100 km ultramarathon in order to be enrolled in this study. Among 40 volunteers who finished graded exercise testing 1 week before competition, 11 EIH runners were selected for EIH group. EIH was defined as resting BP <140/90 mmHg with maximal SBP ≥210 mmHg in graded exercise testing [13]. Of the remaining 29 participants, 11 were selected for normal exercise blood pressure response (NEBPR) group as control group. These 11 NEBPR participants were selected because they had similar characteristics such as age, sex, body mass index (BMI), and exercise experiences as those participants in the EIH group. Their resting BPs were <140/90 mmHg with maximal SBP <210 mmHg during exercise. Characteristics of demographics and cardiorespiratory fitness of participants are summarized in Table 1. All participants were males. No values except maximal SBP demonstrated statistically significant differences between the two groups. Blood samples were collected from participants at 2 hours pre-race, immediately after a 100-km ultramarathon race, and at 24, 72, and 120 hours post-race. Those with resting BP of ≥140/90 mmHg, those who took drugs for cardiovascular diseases, diabetes, renal disease, hepatic disease, or high BP, and those who failed to finish the ultramarathon within 15 hours, the time limit for 100 km running, were excluded from this study. The starting time was 7 PM at a temperature of 15°C and humidity of 36%. Personal data of all participants were collected via questionnaires.
Graded exercise testing was conducted by using Bruce Protocol. It was performed with treadmills (Medtrack ST55; Quinton Instrument Co., Boston, MA, USA). Respiratory gas analysis was conducted with a Quinton meta-bolic cart (QMC) of which the mixing chamber mode was set at an interval of 15 seconds to measure the maximal oxygen uptake and respiratory exchange ratio. For realtime electrocardiograph monitoring, a 12-channel Quinton stress test system (Q4500) was used.
Resting BP was measured using an automatic BP monitor (Model 412, Quinton Instrument Co.) after participants sat down on chairs for 5 minutes with their eyes closed. BP was measured twice at intervals of 3 minutes and the lower value was used. BP during exercise was measured at the second minute of each exercise stage by using the automatic BP monitor. An integrated headset was used by testers to ensure the correct identification of Korotkoff sounds with the automated monitor. The testing was terminated by detailed exercise stoppage requirements based on guidelines of the American College of Cardiology/American Heart Association [17].
Blood samples were collected from antecubital veins at pre-race, immediately post-race, and at 24, 72, and 120 hours post-race using the criteria established in the Clinical and Laboratory Standards Institute guidelines. Creatine kinase (CK), creatine kinase-myocardial band (CKMB), cardiac troponin I (cTnI), NT-proBNP, and high sensitivity C-reactive protein (hs-CRP) levels were determined after collecting samples using vacuum SST blood collecting tubes (BD Vacutainer serum separator tube; BD, Franklin Lakes, NJ, USA) which included gel and blood clotting accelerant. These blood samples were centrifuged at 3,400 rpm for 15 minutes to obtain serum samples which were frozen at -70°C until measurement.
To determine CK and lactate dehydrogenase (LDH) levels, Denka-Seiken reagent (Denka Seiken Co. Ltd., Tokyo, Japan) was used under the principle of the Japan Society of Clinical Chemistry. Levels of CKMB and NT-proBNP were measured using Modular Analytics E170 (Roche Diagnostics, Mannheim, Germany) with electro-chemiluminescence immunoassay method. cTnI levels were evaluated using ADVIA Centaur (Siemens Healthcare, Terrytown, NY, USA) with chemiluminescence immunoassay method. A hs-CRP level was determined with TBA-200FR NEO (Toshiba, Tokyo, Japan) under the principle of immunoturbidimetric assay using HBI reagent (HBI Co. Ltd., Anyang, Korea). Their normal reference ranges were: CK 58–348 IU/L, LDH 260 IU/L, CKMB ≤4.94 ng/mL, cTnI ≤0.78 ng/mL, NT-proBNP ≤125 pg/mL, and hs-CRP ≤0.3 mg/dL.
Regarding coefficient of variation (CV) indicating the accuracy of relevant duration of measurement in the test laboratory for these items, results were as follows: CK 1.2%, LDH 4%, CKMB 3.8%, cTnI 11.8%, NT-proBNP 2%, and hs-CRP 10.32%. Plasma volume changes due to dehydration were measured based on hematocrit and hemoglobin levels [16].
Personal characteristics and marker levels of participants were analyzed using SPSS statistical package version 18 (SPSS Inc., Chicago, IL, USA). All results are presented as mean±standard deviation. Differences in periods for repeated measures within a group were determined using the Friedman test and post-hoc test with Tukey. Personal differences and those depending on periods between groups were determined using Mann-Whitney U test. Differences were considered statistically significant when p-value was less than 0.05.
At pre-race, immediately after race, and at 24, 72, and 120 hours post-race in the NEBPR group, CKMB levels were 2.0±0.7, 29.5±16.8, 15.8±8.1, 6.7±3.8, and 3.3±2.2 ng/mL, respectively. They were 2.3±0.8, 45.2±30.3, 24.1±22.6, 10.1±5.8, and 3.9±2.1 ng/mL, respectively, in the EIH group. In both groups, CKMB levels immediately after race were significantly higher than those at pre-race (p<0.05). Those at 24 hours post-race were also significantly higher than those at pre-race (p<0.05), but lower than those immediately post-race (p<0.05). In both groups, CKMB levels were significantly lower at 72 hours post-race than those immediately after the race (p<0.05). CKMB levels at 120 hours post-race were significantly lower than those immediately post-race or at 24 hours post-race (both p<0.05). However, CKMB levels did not show any significantly differences between the two groups (Fig. 1).
CKMB/CK ratios at pre-race, immediately after race, and at 24, 72, and 120 hours post-race in NEBPR group were 1.6±0.5, 2.0±1.6, 1.4±0.8, 1.2±0.4, and 1.9±0.5, respectively. They were 1.8±0.6, 1.5±0.8, 1.0±0.4, 1.3±0.9, and 2.0±0.8 in EIH group, respectively. In both groups, CKBM/CK ratios at 120 hours post-race were significantly higher than those at 24 hours post-race (p<0.05) (Fig. 2).
cTnI levels at pre-race, immediately after race, and at 24, 72, and 120 hours post-race in NEBPR group were 0.006±0.001, 0.01±0.004, 0.005±0.002, 0.006±0.001, and 0.006±0.001 ng/mL, respectively. They were 0.006±0.001, 0.02±0.009, 0.009±0.002, 0.006±0.001, and 0.007±0.002 ng/mL in EIH group, respectively. Their levels immediately after the race were significantly higher than those at pre-race, 24, 72, and 120 hours post-race in both groups (all p<0.05). In NEBPR group, cTnI level at 24 hours post-race was significantly lower than that immediately after the race (p<0.05). In EIH group, its level at 24 hours post-race was significantly higher than that at pre-race, but significantly lower than that immediately after the race (p<0.05). As for difference between the two groups, cTnI levels were significantly higher in EIH group than those in NEBPR group immediately post-race and at 24 hours post-race (both p<0.05) (Fig. 3).
NT-proBNP levels at pre-race, immediately after race, and at 24, 72, and 120 hours post-race in NEBPR group were 13.0±13.4, 114.8±63.4, 25.0±18.5, 29.8±19.0, and 16.7±20.5 ng/mL, respectively. They were 13.1±10.5, 320.1±241.3, 61.4±45.7, 67.2±43.9, and 19.1±15.7 ng/mL, respectively, in EIH group. In NEBPR group, NT-proBNP level immediately post-race was significantly higher than that at pre-race (p<0.05). Its levels at 24, 72, and 120 hours post-race were significantly lower than those immediately after the race (p<0.05). In EIH group, its level immediately post-race was significantly higher than that at pre-race (p<0.05). However, NT-proBNP levels at 24 and 72 hours post-race were significantly higher than those at pre-race, but lower than those immediately after the race (p<0.05). Its levels at 120 hours post-race were significantly lower than those immediately post-race and at 72 hours post-race in EIH group (p<0.05). As for differences in NT-proBNP levels between the two groups, its levels were significant higher in EIH group than those in NEBPR group immediately after race and at 24 and 72 hours post-race (all p<0.05) (Fig. 4).
CK levels at pre-race, immediately after race, and at 24, 72, and 120 hours post-race in NEBPR group were 128.4±45.5, 1,858.3±986.8, 1,212.1±437.2, 587.9±219.6, and 174.6±98.1 IU/L, respectively. They were 132.3±13.9, 3,083.3±1049.5, 2,126.2±1240.7, 986.7±625.5, and 213.0±112.6 IU/L, respectively, in EIH group. In both groups, CK levels were significantly higher immediately after the race and at 24 and 72 hours post-race than those at pre-race (p<0.05). They were significantly higher immediately post-race and at 24 hours post-race than those at 72 hours post-race (p<0.05). CK levels at 120 hours post-race were significantly lower than those immediately after the race and at 24 hours post-race (p<0.05). As for differences between groups, EIH group showed significantly higher levels of CK than NEBPR group immediately after the race and at 24 hours after the race (both p<0.05) (Fig. 5).
hs-CRP levels at pre-race, immediately after the race, and at 24, 72, and 120 hours after the race in NEBPR group were 0.04±0.03, 0.57±0.33, 1.70±0.87, 0.85±0.42, and 0.16±0.12 mg/dL, respectively. They were 0.04±0.04, 0.71±0.34, 2.36±1.11, 1.01±0.42, and 0.17±0.08 mg/dL, respectively, in the EIH group. hs-CRP levels immediately post-race were significantly higher than those at pre-race (p<0.05) while those at 24 hours post-race were significantly higher than those at pre-race or immediately after the race (p<0.05) in both groups. Their levels at 72 hours post-race were significantly higher than those at prerace but significantly lower than those at 24 hours post-race (p<0.05). In both groups, Hs-CRP levels at 120 hours post-race were significantly higher than those at pre-race (p<0.05) but significantly lower than those immediately post-race and at 24 or 72 hours post-race (p<0.05). Additionally, hs-CRP levels were significantly higher at 24 hours post-race in EIH group than those in NEBPR group (p<0.05) (Fig. 6).
LDH levels at pre-race, immediately post-race, and at 24, 72, and 120 hours post-race in NEBPR group were 336.0±48.2, 650.9±97.8, 641.5±135.4, 609.8±124.3, and 467.3±98.2 IU/L, respectively. They were 326.6±33.8, 682.8±174.2, 722.2±362.3, 685.8±303.1, and 500.6±165.8 IU/L in EIH group, respectively. In both groups, LDH levels were significantly higher immediately after race and at 24 and 72 hours post-race than those at pre-race (p<0.05). Those at 120 hours post-race were significantly higher than those at pre-race, but significantly lower than immediately after race or at 24 and 72 hours post-race (p<0.05). Neither group showed any significant intergroup differences (Fig. 7).
This study investigated levels of cardiac and muscle damage markers in runners of EIH and NEBPR groups before and immediately after running and during the three-stage recovery period after an ultramarathon. Although differences were present between the two groups, all 100-km ultramarathon runners demonstrated normal values by the 5th day.
Among cardiac markers, CKMB is a specific enzyme expressed in cardiac muscles. It is an isoenzyme of CK. CKMB is affected by CK which is expressed during exhaustion. It is induced by damage of muscles after extreme exercise [18]. CKMB/CK ratio (%) of more than 2.5% is considered clinically significant [19]. In this study, levels of CKMB were significantly increased immediately after running, without showing significant differences between the two groups. By the 5th day, their values in all the runners were within normal range (<4.94 ng/mL) (Fig. 1). Although CKMB levels were increased immediately after finishing the ultramarathon, no significant cardiac muscle damage was observed because CKMB/CK ratio was within normal range during all periods (Fig. 2). Exercise intensities of a marathon and 100-km race are high (average 11.3 km/hr) and medium-to-high (average 7.4 km/hr), respectively [20]. Participants in the present study underwent exercise with relatively lower intensity (100-km running) than those in a previous study (marathon) [19]. This might have led to normal range of CKMB/CK ratio.
Compared to CKMB, cTnI is a marker of cardiac damage with higher specificity and susceptibility [21]. Although the mechanism by which levels of cTnI are increased during extreme exercise has not been clearly identified yet, intercellular calcium overload accompanied with activation of calpains, increased catecholamine, and mechanically-induced membrane damage in the myocardium cell membrane might play an important role [1,22,23]. In this study, cTnI levels were within the normal range (≤0.78 ng/mL) in EIH group. However, they were significantly higher in EIH group than those in NEBPR group immediately after the race and at 24 hours post-race (Fig. 3). Levels of cTnI can be increased by extreme exercise such as a marathon or a 100-km ultramarathon [1,12,24,25]. They can even exceed the URL. They are associated with exercise intensity [9,10,26]. An ultra-distance running such as a 308-km marathon (more than 100-km) cannot express cardiac muscle damage markers including cTnI because cardiac muscle tension is reduced due to relatively lower exercise intensity [5]. The increase of cTnI level in the EIH group observed in this study might be caused by an increase in cardiac muscle load due to relatively higher SBP that affected cTnI expression. However, biomarkers of cardiac injury cannot represent actual cardiac dysfunction. Thus, it is important not to jump to a conclusion that elevated biomarkers are directly correlated with myocardial injury [27].
As for another evidence of cardiac muscle load, the expression of NT-proBNP was significantly higher in EIH group than that in NEBPR group immediately post-race and at 24 and 72 hours post-race for a relatively longer time period (Fig. 4). NT-proBNP demonstrated clinically higher levels in the presence of cardiac diseases such as heart failure and cardiac dysfunction reflecting cardiac muscle stress due to expansion and pressure overload of cardiac muscles [28]. NT-proBNP is also expressed after extreme exercise. It has been reported that NT-proBNP can exceed the URL in 77% of athletes after finishing endurance exercises (marathon, 100 km running, or mountain bike marathon) [1]. NT-proBNP levels also can exceed URL after a 308-km long-distance running [5]. The higher expression of NT-proBNP during extreme exercise is caused by increased volume pressure within ventricles due to exercise and physiologic processes such as natriuresis, vasodilation, and sympathetic block that can reduce stress on myocardial walls known to play a role in reducing preload and afterload [8]. NT-proBNP has growth-regulating effects. It is a cytoprotective factor by reducing cardiac muscle load [8]. In cases of EIH, increases in cardiac output are known to increase peripheral vascular resistance due to dysfunction of peripheral blood vessel expansion that can excessively increase afterload and BP during exercise [29].
In addition to increased levels of cardiac markers, levels of CK and hs-CRP were also significantly higher in EIH group than those in NEBPR group (Figs. 5, 6). CK and hs-CRP levels were increased after extreme longdistance running, indicating damage of working muscles and inflammatory expression [30]. The EIH group demonstrated more damage of working muscles and inflammation possibly due to dysfunction of peripheral blood vessel expansion during exercise which might restrict blood flow to working muscles. These results suggest that EIH runners have chronically higher resistance applied to their cardiac muscles and blood vessels not only during competitions, but also during training periods. Further studies are needed to investigate cardiophysiological changes in these runners.
Although several studies have examined changes of cardiac markers before, during, and immediately after long-distance running of 100 km, most of these studies did not focus on the recovery period. To the best of our knowledge, the present study is the first one investigating those markers during the recovery period after longdistance running. While cTnI level was higher in EIH group until 24 hours post-race (Fig. 3), NT-proBNP level was also higher in EIH group than that in NEBPR group until 72 hours after running. Consequently, this study indicates that EIH runners may show higher myocardial load even after exercise. Further studies are needed to investigate whether such phenomenon of cardiovascular factors might have negative effects on EIH runners.
This study has some limitations. First, it was impossible to control food, beverage, or nutritional supplement intake of runners during running or recovery periods. Second, body composition (such as body water and fat) or calorie consumption after finishing ultramarathon was not measured. Third, the relationship between cardiac function and changes of cardiac markers/echocardiography was not assessed.
In conclusion, muscle damage and significantly increased inflammatory markers were observed in EIH group of runners after finishing ultramarathon. This might result from blood flow restrictions caused by vasodilation disorders of working muscles. Increased muscle damage and inflammatory response of the working muscle can lead to an increase in general peripheral resistance, which subsequently increases the cardiac volume pressure, eventually increasing levels of cardiac markers.
REFERENCES
1. Scharhag J, Herrmann M, Urhausen A, Haschke M, Herrmann W, Kindermann W. Independent elevations of N-terminal pro-brain natriuretic peptide and cardiac troponins in endurance athletes after prolonged strenuous exercise. Am Heart J. 2005; 150:1128–34.

2. Scott JM, Esch BT, Shave R, Warburton DE, Gaze D, George K. Cardiovascular consequences of completing a 160-km ultramarathon. Med Sci Sports Exerc. 2009; 41:26–34.

3. Roth HJ, Leithauser RM, Doppelmayr H, Doppelmayr M, Finkernagel H, von Duvillard SP, et al. Cardiospecificity of the 3rd generation cardiac troponin T assay during and after a 216 km ultra-endurance marathon run in Death Valley. Clin Res Cardiol. 2007; 96:359–64.

4. Tchou I, Margeli A, Tsironi M, Skenderi K, Barnet M, Kanaka-Gantenbein C, et al. Growth-differentiation factor-15, endoglin and N-terminal pro-brain natriuretic peptide induction in athletes participating in an ultramarathon foot race. Biomarkers. 2009; 14:418–22.

5. Kim YJ, Shin YO, Lee JB, Lee YH, Shin KA, Kim AC, et al. The effects of running a 308 km ultra-marathon on cardiac markers. Eur J Sport Sci. 2014; 14 Suppl 1:S92–7.

6. Lavie CJ, Arena R, Swift DL, Johannsen NM, Sui X, Lee DC, et al. Exercise and the cardiovascular system: clinical science and cardiovascular outcomes. Circ Res. 2015; 117:207–19.
7. Lavie CJ, Lee DC, Sui X, Arena R, O’Keefe JH, Church TS, et al. Effects of running on chronic diseases and cardiovascular and all-cause mortality. Mayo Clin Proc. 2015; 90:1541–52.

8. Scharhag J, George K, Shave R, Urhausen A, Kindermann W. Exercise-associated increases in cardiac biomarkers. Med Sci Sports Exerc. 2008; 40:1408–15.

9. Legaz-Arrese A, George K, Carranza-Garcia LE, Munguia-Izquierdo D, Moros-García T, Serrano-Ostariz E. The impact of exercise intensity on the release of cardiac biomarkers in marathon runners. Eur J Appl Physiol. 2011; 111:2961–7.

10. Serrano-Ostariz E, Terreros-Blanco JL, Legaz-Arrese A, George K, Shave R, Bocos-Terraz P, et al. The impact of exercise duration and intensity on the release of cardiac biomarkers. Scand J Med Sci Sports. 2011; 21:244–9.
11. Kim YJ, Kim CH, Shin KA, Kim AC, Lee YH, Goh CW, et al. Cardiac markers of EIH athletes in ultramarathon. Int J Sports Med. 2012; 33:171–6.

12. Kim YJ, Shin YO, Lee YH, Jee HM, Shin KA, Goh CW, et al. Effects of marathon running on cardiac markers and endothelin-1 in EIH athletes. Int J Sports Med. 2013; 34:777–82.

13. Lauer MS, Levy D, Anderson KM, Plehn JF. Is there a relationship between exercise systolic blood pressure response and left ventricular mass? The Framingham Heart Study. Ann Intern Med. 1992; 116:203–10.
14. Singh JP, Larson MG, Manolio TA, O’Donnell CJ, Lauer M, Evans JC, et al. Blood pressure response during treadmill testing as a risk factor for new-onset hypertension. The Framingham heart study. Circulation. 1999; 99:1831–6.
15. Kjeldsen SE, Mundal R, Sandvik L, Erikssen G, Thaulow E, Erikssen J. Exercise blood pressure predicts cardiovascular death and myocardial infarction. Blood Press Monit. 1997; 2:147–53.
16. Kurl S, Laukkanen JA, Rauramaa R, Lakka TA, Sivenius J, Salonen JT. Systolic blood pressure response to exercise stress test and risk of stroke. Stroke. 2001; 32:2036–41.

17. Gibbons RJ, Balady GJ, Beasley JW, Bricker JT, Duvernoy WF, Froelicher VF, et al. ACC/AHA guidelines for exercise testing: executive summary. A report of the American College of Cardiology/American Heart Association Task Force on Practice Guidelines (Committee on Exercise Testing). Circulation. 1997; 96:345–54.
18. Clarkson PM. Exertional rhabdomyolysis and acute renal failure in marathon runners. Sports Med. 2007; 37:361–3.

19. Pearson JR, Carrea F. Evaluation of the clinical usefulness of a chemiluminometric method for measuring creatine kinase MB. Clin Chem. 1990; 36:1809–11.

20. Shin KA, Park KD, Ahn J, Park Y, Kim YJ. Comparison of changes in biochemical markers for skeletal muscles, hepatic metabolism, and renal function after three types of long-distance running: observational study. Medicine (Baltimore). 2016; 95:e3657.
21. Adams JE 3rd, Bodor GS, Davila-Roman VG, Delmez JA, Apple FS, Ladenson JH, et al. Cardiac troponin I: a marker with high specificity for cardiac injury. Circulation. 1993; 88:101–6.

22. McNeil PL, Terasaki M. Coping with the inevitable: how cells repair a torn surface membrane. Nat Cell Biol. 2001; 3:E124–9.

23. Scharhag J, Urhausen A, Schneider G, Herrmann M, Schumacher K, Haschke M, et al. Reproducibility and clinical significance of exercise-induced increases in cardiac troponins and N-terminal pro brain natriuretic peptide in endurance athletes. Eur J Cardiovasc Prev Rehabil. 2006; 13:388–97.

24. Herrmann M, Scharhag J, Miclea M, Urhausen A, Herrmann W, Kindermann W. Post-race kinetics of cardiac troponin T and I and N-terminal pro-brain natriuretic peptide in marathon runners. Clin Chem. 2003; 49:831–4.

25. Wilson M, O’Hanlon R, Prasad S, Oxborough D, Godfrey R, Alpendurada F, et al. Biological markers of cardiac damage are not related to measures of cardiac systolic and diastolic function using cardiovascular magnetic resonance and echocardiography after an acute bout of prolonged endurance exercise. Br J Sports Med. 2011; 45:780–4.

26. Serrano-Ostariz E, Legaz-Arrese A, Terreros-Blanco JL, Lopez-Ramon M, Cremades-Arroyos D, Carranza-Garcia LE, et al. Cardiac biomarkers and exercise duration and intensity during a cycle-touring event. Clin J Sport Med. 2009; 19:293–9.
27. Shave RE, Dawson E, Whyte G, George K, Ball D, Gaze DC, et al. Evidence of exercise-induced cardiac dysfunction and elevated cTnT in separate cohorts competing in an ultra-endurance mountain marathon race. Int J Sports Med. 2002; 23:489–94.

28. Maisel AS, Krishnaswamy P, Nowak RM, McCord J, Hollander JE, Duc P, et al. Rapid measurement of Btype natriuretic peptide in the emergency diagnosis of heart failure. N Engl J Med. 2002; 347:161–7.

29. Wilson MF, Sung BH, Pincomb GA, Lovallo WR. Exaggerated pressure response to exercise in men at risk for systemic hypertension. Am J Cardiol. 1990; 66:731–6.

30. Kim HJ, Lee YH, Kim CK. Changes in serum cartilage oligomeric matrix protein (COMP), plasma CPK and plasma hs-CRP in relation to running distance in a marathon (42.195 km) and an ultra-marathon (200 km) race. Eur J Appl Physiol. 2009; 105:765–70.
Fig. 1.
Responses of CKMB to 100-km ultra-marathon race and its recovery in EIH and NEBPR groups. CK, creatine kinase; EIH, exercise-induced hypertension; NEBPR, normal exercise blood pressure response. a)Significantly different from the pre-race at p<0.05, b)significantly different from immediately post-race at p<0.05, c)significantly different from the 24 hours post-race at p<0.05, d)significantly different from the 72 hours post-race at p<0.05.
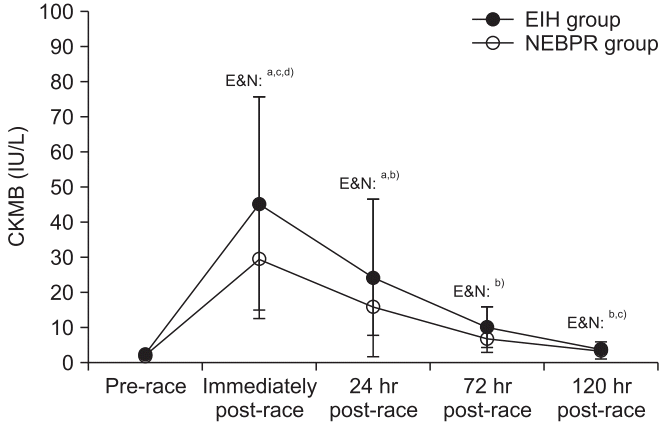
Fig. 2.
Responses of CKMB/CK (ratio) to 100-km ultramarathon race and its recovery in EIH and NEBPR groups. CK, creatine kinase; EIH, exercise-induced hypertension; NEBPR, normal exercise blood pressure response. a)Significantly different from the 24 hours post-race at p<0.05.
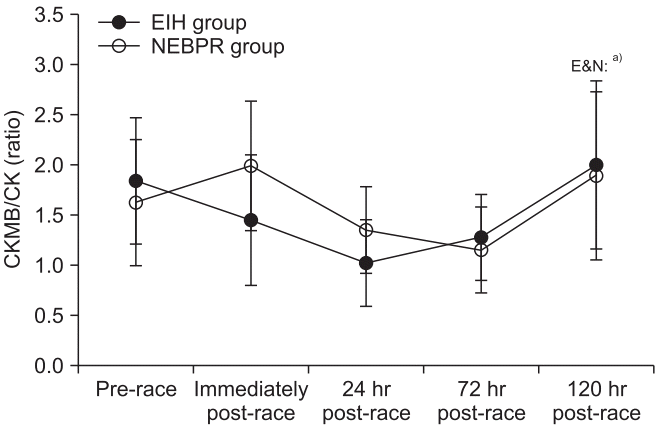
Fig. 3.
Responses of cTnI to 100-km ultra-marathon race and its recovery in EIH and NEBPR groups. cTnI, cardiac troponin I; EIH, exercise-induced hypertension; NEBPR, normal exercise blood pressure response. a)Significantly different from the pre-race at p<0.05, b)significantly different from immediately post-race at p<0.05, c)significantly different from the 24 hours post-race at p<0.05, d)significantly different from the 72 hours post-race at p<0.05, e)significantly different between the groups at p<0.05.
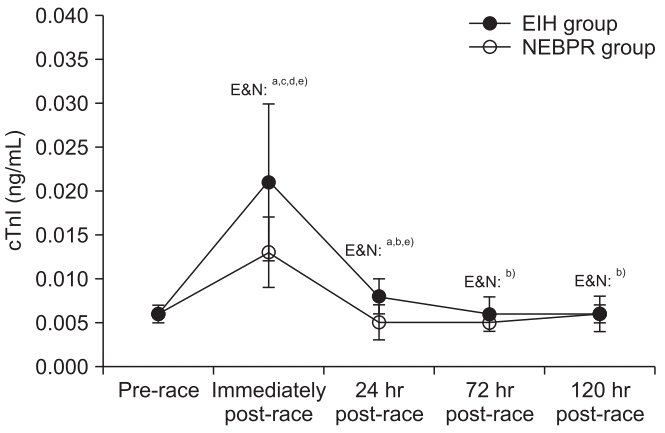
Fig. 4.
Responses of NT-proBNP to 100-km ultra-marathon race and its recovery in EIH and NEBPR groups. NTproBNP, N-terminal pro B-type natriuretic peptide; EIH, exercise-induced hypertension; NEBPR, normal exercise blood pressure response. a)Significantly different from the pre-race at p<0.05, b)significantly different from immediately post-race at p<0.05, c)significantly different from the 72 hours post-race at p<0.05, d)significantly different between the groups at p<0.05.
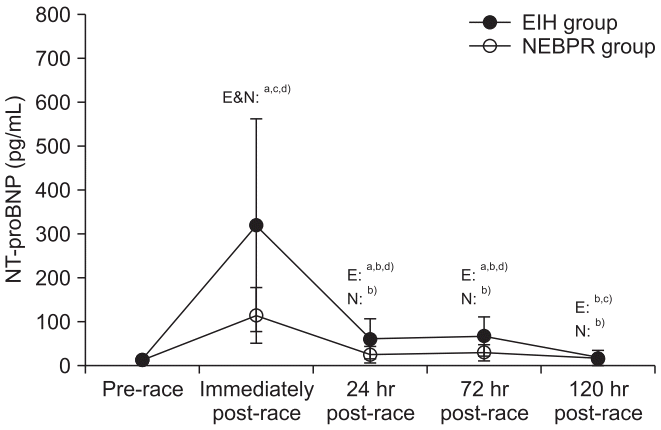
Fig. 5.
Responses of CK to 100-km ultra-marathon race and its recovery in EIH and NEBPR groups. CK, creatine kinase; EIH, exercise-induced hypertension; NEBPR, normal exercise blood pressure response. a)Significantly different from the pre-race at p<0.05, b)significantly different from immediately post-race at p<0.05, c)significantly different from the 24 hours post-race at p<0.05, d)significantly different from the 72 hours post-race at p<0.05, e)significantly different between the groups at p<0.05.
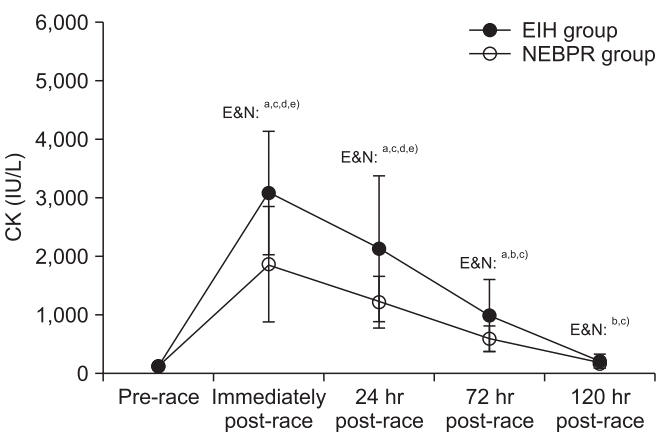
Fig. 6.
Responses of hs-CRP to 100-km ultra-marathon race and its recovery in EIH and NEBPR groups. hsCRP, high sensitive C-reactive protein; EIHG, exerciseinduced hypertension; NEBPRG, normal exercise blood pressure response. a)Significantly different from the prerace at p<0.05, b)significantly different from immediately post-race at p<0.05, c)significantly different from the 24 hours post-race at p<0.05, d)significantly different from the 72 hours post-race at p<0.05, e)significantly different between the groups at p<0.05.
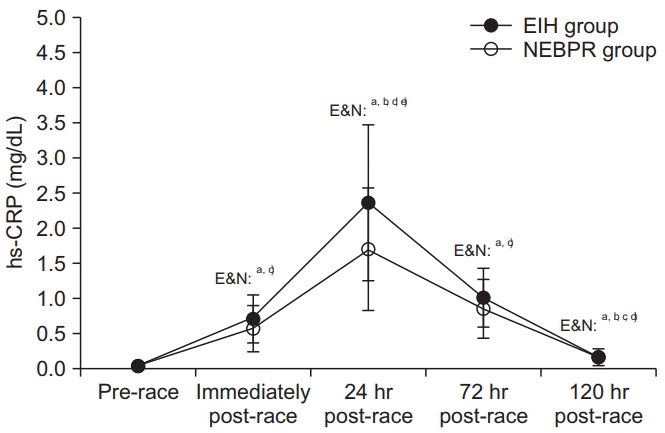
Fig. 7.
Responses of LDH to 100-km ultramarathon race and its recovery in EIH and NEBPR groups. LDH, lactate dehydrogenase; EIH, exercise-induced hypertension; NEBPR, normal exercise blood pressure response. a)Significantly different from the pre-race at p<0.05, b)significantly different from immediately post-race at p<0.05, c)significantly different from the 24 hours post-race at p<0.05, d)significantly different from the 72 hours postrace at p<0.05.
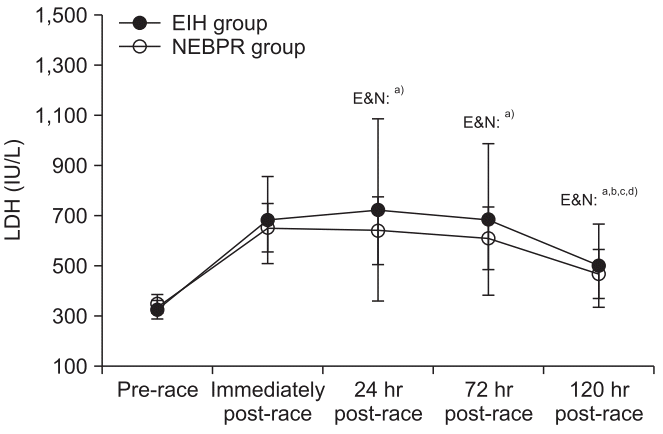
Table 1.
Characteristics of demographics and cardiorespiratory fitness of study participants
| EIH (n=11) | NEBPR (n=11) | p-value | |
|---|---|---|---|
| Age (yr) | 52.91±3.85 | 51.73±4.36 | 0.509 |
| Height (cm) | 169.78±4.79 | 169.13±3.09 | 0.708 |
| Weight (kg) | 66.59±4.79 | 67.47±5.90 | 0.705 |
| BMI (kg/m2) | 23.11±1.24 | 23.60±2.17 | 0.531 |
| Race career (mo) | 109.09±69.07 | 138.27±74.16 | 0.351 |
| Race record (min) | 778.09±95.62 | 779.45±85.65 | 0.972 |
| VO2max (mL/kg/min) | 49.29±5.18 | 51.06±4,73 | 0.412 |
| HRrest (beat/min) | 62.45±9.08 | 66.36±8.78 | 0.317 |
| HRmax (beat/min) | 165.45±12.33 | 173.00±10.48 | 0.138 |
| SBPrest (mmHg) | 120.18±9.00 | 116.27±7.97a) | 0.294 |
| DBPrest (mmHg) | 73.45±9.76 | 71.91±6.96 | 0.674 |
| SBPmax (mmHg) | 255.73±13.90a) | 194.00±9.97 | 0.000 |
| DBPmax (mmHg) | 71.45±16.90 | 65.82±10.25 | 0.356 |


 PDF
PDF Citation
 Print
Print


 XML Download