INTRODUCTION
The ankle joint complex consists of the ankle (talocrural) joint and the subtalar (talocalcaneal) joint. The gross motion between the foot and the shank is the result of the motions at the ankle joint complex. Because the ankle joint complex is crucial to human locomotion, accurate knowledge on the kinematics of these joints is essential for proper diagnosis and treatment of injuries and diseases in this region [
1].
Numerous investigations have been carried out to analyze the kinematic characteristics of the ankle joint complex [
23]. For clinical applications, joint mobility is often quantified by range of motion (ROM), which is clinically defined as the maximal range of joint angle [
4].
Studies have proven that there are variations in the degree of mobility of the ankle related to gender and age, in apparently normal individuals [
356]. But, most studies have been conducted on a Western population [
3789]. There are very few studies regarding the normal ROM of lower extremity joints in the Asian population [
510]. Cultural habits, such as squat toilet use, sitting cross-legged, squatting and kneeling on the ground and religious exercises involving kneeling can affect normal ROM of the ankle joints.
Reproducible measurements of the ROM are an important prerequisite for the interpretation of study results. Visual inspection, goniometric measurements, inclinometer and high-speed cinematography are examples of methods that have been used to quantify the ROM. For this purpose, the digital inclinometer is considered to be a useful instrument due to its cost-effectiveness and ease of use [
11].
ROM of ankle can be measured differently by measurement posture, pushing force and gender [
1213]. When the ankle is manually dorsiflexed or plantarflexed, the amount of force applied could influence the amount of ROM achieved [
1415]. However, no previous study has assessed adequate pushing force to measure ROM of ankle joint. Furthermore, the extent to which posture of knee joint influences ROM of ankle joint is not well documented.
A standardized method for measurement of joint ROM of Koreans has not been presented to date. Korean standard reference for joint ROM and standard and objective method and protocol for measurement of joint ROM are required. The purpose of our study was to evaluate the effect of gender, pushing force and knee joint position on the normal ROM of ankle joint in healthy young Korean subjects.
Go to :

MATERIALS AND METHODS
Subjects
The study included a total of 128 (55 males and 73 females) healthy volunteers. Individuals with a history of illness such as inflammatory arthropathy, prior surgery or trauma involving any joint of either lower extremity were excluded from the study. Mean age and age range of the subjects were presented in
Table 1.
Table 1
Demographic data of the subjects


Methods
Prior to measuring ROM of ankle, measures of the body mass index (BMI), blood tests including erythrocyte sedimentation rate (ESR), C-reactive protein (CRP), rheumatoid arthritis (RA) factor and radiologic study of knee & ankle joint anteroposterior (AP) and lateral, were conducted in all subjects, in order to rule out any disease that can affect the ROM of ankle joint such as inflammatory arthropathy, prior surgery or trauma involving any joint of either lower extremity. Subsequently, the examiner completed the ROM measurements. Prior to participation, all procedures were explained to each subject, and informed consent was obtained, as approved by the Institutional Review Board at Chungnam National University Hospital (No. 2014-03-001). The rights of the subjects were protected.
Dualer IQ Inclinometers (J-Tech, Torrance, CA, USA) and Commander Muscle Tester (J-Tech) were used to record the passive ROM of ankle and objective quantify strength (
Fig. 1). Prior to actual testing, the inclinometer was calibrated with computer-generated angles to assess accuracy. Next, the examiner established a point of reference by placing the inclinometer on the hand and read the angle while the subtalar joint was maintained in a neutral position. There was perfect agreement between the inclinometer and the reference angles.
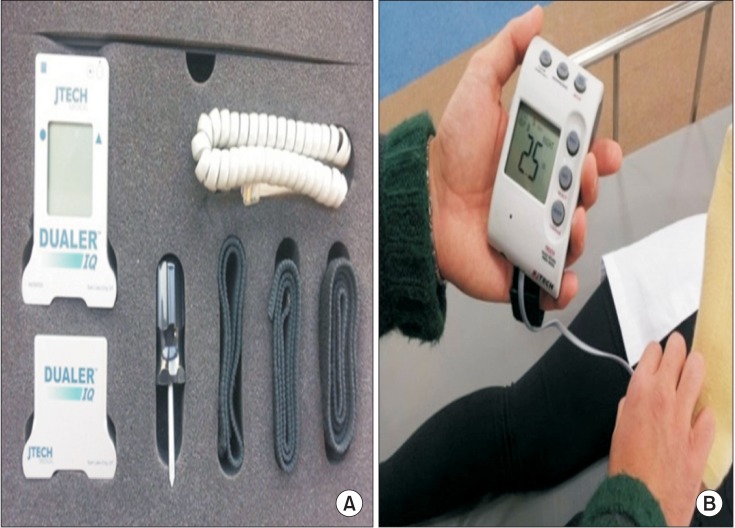 | Fig. 1(A) Dualer IQ Inclinometers (J-Tech, Torrance, CA, USA), (B) Commander Muscle Tester (J-Tech).
|
One examiner performed ankle ROM measurements using a Dualer IQ Inclinometers and Commander Muscle Tester. Examiner reviewed testing procedures and use of the digital inclinometer prior to actual testing.
ROM of ankle dorsiflexion (DF) and plantarflexion (PF) at neutral position of knee joint and knee flexion of 90° were measured according to change of pushing force—0 kg (full active ROM), 4 lb (1.814 kg), 18 lb (8.165 kg), 31 lb (14.061 kg), 44 lb (19.958 kg). All measurements were executed with test subjects in prone position with the thigh stabilized to the table with a belt. For the measurement with the knee flexed, the examiner flexed the subject's knee to 90° and lower leg stabilized to 90° angle with solid vertical plate (
Fig. 2).
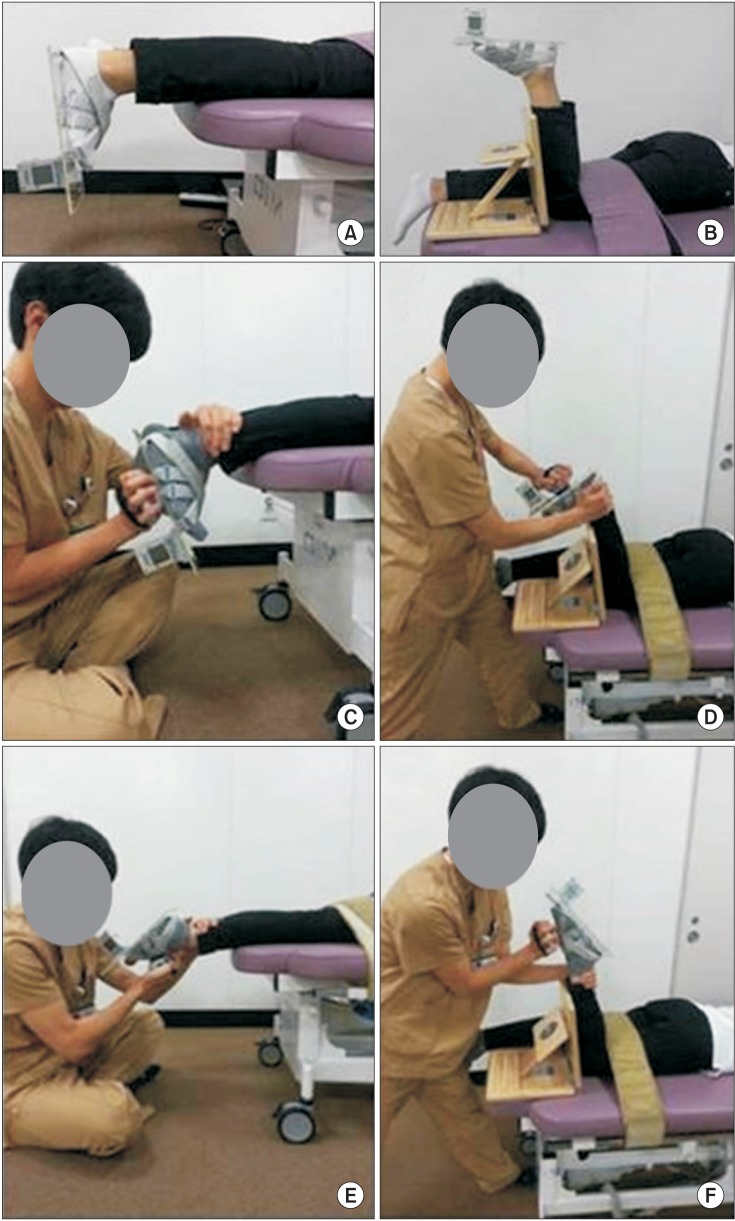 | Fig. 2Starting position before measurement of range of motion of ankle dorsiflexion & plantarflexion at neutral position of knee joint (A) and ankle dorsiflexion & plantarflexion at knee flexion of 90° (B). Position to measurement of range of motion of ankle dorsiflexion (C, D) and ankle plantarflexion (E, F).
|
The subtalar joint neutral position is considered an important reference position from which motion can be measured. Subtalar joint neutral was determined when the talar head was felt equally between the thumb and index finger. For consistency, examiner determined subtalar joint neutral position as the moment the medial head of the talus was no longer prominent when moving the subject's foot from a pronated to a supinated position. The tester then placed the straight edge of the Dualer IQ Inclinometers parallel to the 2 dots on the calcaneus while keeping the inclinometer in the frontal plane. During the inclinometer measurement, patients were instructed to hold the position of subtalar joint neutral.
Examiner obtained 5 repeated measures with each method in order to investigate the correlation between passive ranges of motion and these measurements were averaged. Study design consisted of a test–retest crossover with serial measurements for each joint position (
Fig. 3).
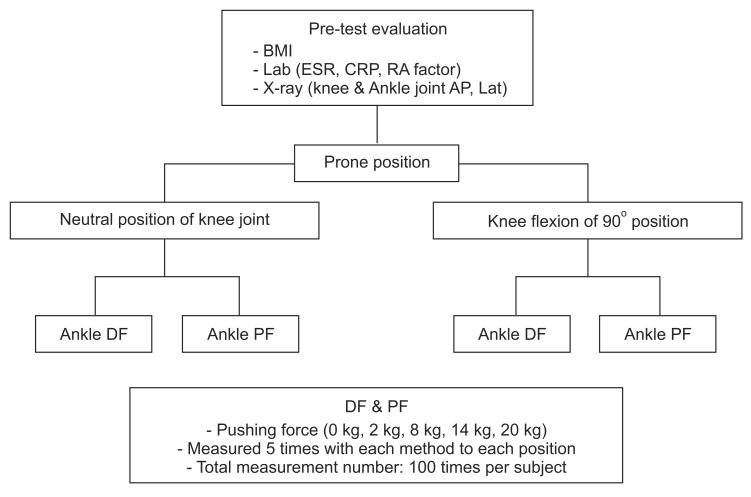 | Fig. 3Overall flow sheet of the measurement process. BMI, body mass index; ESR, erythrocyte sedimentation rate; CRP, C-reactive protein; RA, rheumatoid arthritis; AP, anteroposterior; DF, dorsiflexion; PF, plantarflexion.
|
Statistical analysis
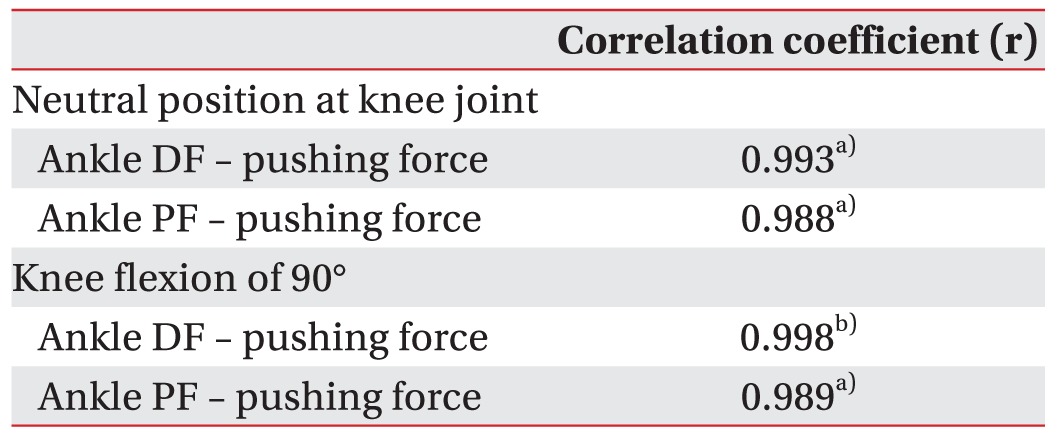
Statistical analyses were performed using SPSS ver. 18.0 (SPSS Inc., Chicago, IL, USA). Relationships between pushing force and ROM were calculated using the Pearson correlation coefficient. The independent t-test was used to compare the ROM of male and female subjects and the differences of ankle ROM according to the knee joint position. p-values of <0.05 were considered significant.
Go to :

DISCUSSION
The handbook of the American Academy of Orthopedic Surgeons (AAOS) is a well-known source for average ranges of joint motions [
416]. Both this handbook and some reports in the literature give no information about the evaluated population (age, gender, race, etc.) or the measurement technic (active or passive) [
1617].
Results of this study identified differences between the mobility of ankle joints in respect to the pushing force, knee joint position and gender in normal Korean individuals. Findings from this study support a simple method using a digital inclinometer to reliably assess ankle ROM in the clinical setting.
The few studies based on Asian populations have shown that ankle DF is significantly greater than those of the Western population [
510]. Kumar et al. [
10] reported passive ankle DF of 24° in the Indian population. In a study with a population of 50 Arab males, Ahlberg et al. [
5] reported passive ROMs of 32° of ankle DF. On the other hand, Roaas and Andersson [
3] reported passive ROMs of 15° of ankle DF in males aged between 30 and 40 years from the city of Gothenburg. The results of this study, in agreement with the previous works [
510], suggest that Asian populations have shown that ankle DF is significantly greater than those of the Western population.
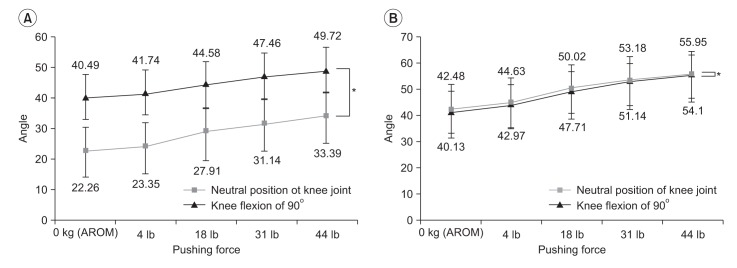
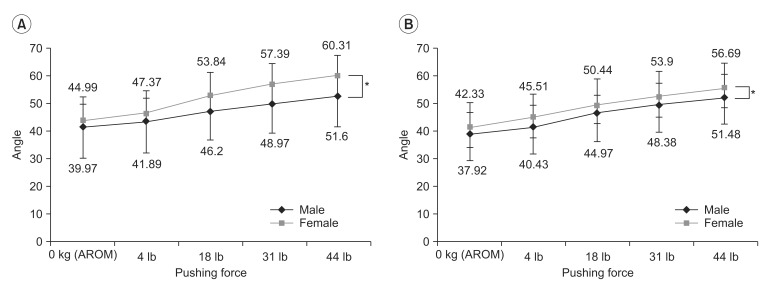
The mean value for ankle ROM indicate that higher pushing force leads to more ROM at ankle DF and ankle PF (p<0.05). In physics, a force is any interaction that tends to change the motion of an object [
17]. Forces act in a particular direction and have sizes dependent upon the strength of push or pull. In other words, a force can cause a change in velocity of an object with mass. Thus the greater the pushing force accelerating the motion of the ankle, leads to increasing of the ROM of ankle. When the pushing force increases, the talocrural joint, as well as with a compensation movement of the subtalar joint and midtarsal joint can lead to larger ROM of the ankle joint. To the best of our knowledge, this study is the first to assess the relationship between pushing force and ROM of ankle joint.
Greater pushing force leads to more ROM at ankle. Therefore, a more standardized manner is required when measuring the joint ROM. It is possible to improve the accuracy of the joint ROM measurement by using a tool like Dualer IQ Inclinometers as used in this study, as well as another test with application of the same force. In this study, a wide range of pushing force up to 20 kg, was used to assess the relationship between pushing force and ROM of ankle joint. Since greater pushing force leads to more ROM at ankle, we emphasized the need for new settings to the improvement of the application value and accuracy of the pushing force.
There was a significant effect of knee flexion angle on estimated ROM of ankle joint (p<0.001). Knee flexion of 90° position increased the DF angle about 50%, as compared to neutral position of knee joint. Anatomical studies indicate that joint position changes at the knee influence ankle ROM by altering tension within passive tissues that span from the lumbar spine to the foot [
1819]. Because the gastrocnemius is a bi-articulate muscle (i.e., crosses both the ankle and the knee), it may be possible to reduce Achilles tendon forces during passive DF simply by flexing the knee. On the other hand, PF had less change associated with the knee joint position. This result considered different synergy effect of other muscles to ankle PF. Further research is required to determine which muscles act as synergist and antagonist of the ankle PF.
In the present study, ROM of ankle PF were higher in female subjects. ROM of ankle DF for female were greater than for male, with no significant difference. Gender differences in the ROM of ankle have been shown for young healthy populations [
2021]. A previous study demonstrated that in normal Taiwan individuals, females showed greater joint ROM than males in lower-extremity joints. The greater mobility for female is based on the greater capacity of PF, as compared to male [
21]. Our study result of the differences in the male and female corroborated previous descriptions.
A standardized method for measurement of joint ROM of Koreans have not been presented to date. Korean standard reference for joint ROM and standard and objective method and protocol for measurement of joint ROM are required.
A primary goal of healthcare is to understand the boundaries of health and normality and identify when abnormalities are harmful. Diagnosis of disease or impairment is often made by comparing results from clinical measures with healthy reference values. Currently, there is need for comprehensive lower limb reference data representing the healthy population [
22]. The 128 normal subjects are currently recruiting to provide reference values for a set of widely-used clinical and biomechanical measures of the ankle ROM.
This study had some limitations. First, this study was performed with participants in young, healthy age group. It is possible that more substantial age-related effects would have become apparent if more participants were tested or if the older cohort was more aged or more frail. Second, in this study, ankle ROM was measured using a digital inclinometer. However, measurement method utilizing the goniometer is more standardized and widely available currently. Comparative ROM measures between these 2 methods would be more meaningful for research purposes and are required in further studies. Third, the patient has to maintain a neutral position of subtalar joint themselves against the larger pushing force, which is very difficult. Therefore, in this study, it may be a significant limitation that we did not use the external device for maintaining the neutral position of subtalar joint during ROM measurement. Fourth, this study is inadequate to determine the most appropriate pushing force to measure the ROM of ankle. Thus, further research is needed that can accurately present the criteria for pushing force to measurement of ROM.
However, this study will contribute substantially to our understanding of the range of normal ankle function in healthy individuals. The reference dataset will be a useful tool for disease diagnosis and management, health surveillance and future outcome measure development for clinical trials of rehabilitative, surgical and pharmacological interventions.
In conclusion, to the best of our knowledge, this is the first study to assess the relationship between pushing force and ROM of ankle joint. There was significant correlation between ROM of ankle and pushing force, i.e., greater pushing force leads to more ROM at ankle DF and ankle PF. ROM of ankle PF for females was greater than for males regardless of the pushing force. According to the knee joint position, the ROM of the ankle is measured differently. Hence, the pushing force, gender and knee joint position should be considered when measuring the ROM of ankle joint.
Go to :


 PDF
PDF ePub
ePub Citation
 Print
Print



 XML Download