

 PDF
PDF ePub
ePub Citation
 Print
Print


INTRODUCTION
Denervation muscle results in significant weakness and muscle atrophy. Early and accurate detection of muscle denervation is important to prevent muscle weakness. Electrodiagnostic study is the gold standard for evaluating muscle denervation in peripheral neuropathy [12]. However, due to pain caused by needle insertion, an electrodiagnostic study can be invasive and uncomfortable for patients. In addition, patient cooperation is required for obtaining accurate results during this test [34].
Interest in high-resolution ultrasonography (US) is increasing [56]. Compared to an electrodiagnostic study, musculoskeletal US is relatively noninvasive and more readily available. US can also provide real-time and dynamic information on patients [7].
Several studies have demonstrated that neuromuscular diseases can causes changes in the normal ultrasound image of the muscle [89] and echo intensity (EI) [1011]. Normal muscle tissue is echolucent, and ultrasound is transmitted through the muscle tissue easily but it is reflected from the fibrous tissue. In imaging studies, fat and collagen replacement and muscle atrophy make muscle tissue heterogeneous. Therefore, muscle EI increases with fatty infiltration and fibrous changes [1213]. High muscle EI has been suggested as evidence of muscle changes due to neuropathy and myopathy [141516].
In neuromuscular disorders, decreased muscle thickness is apparent. Muscle US could be used to detect muscle changes in the early phase of amyotrophic lateral sclerosis. Quantitative analysis demonstrated a significant increase in EI in all muscles and a bilateral decrease in muscle thickness of the biceps brachii, forearm flexors, and quadriceps femoris [1317].
Carpal tunnel syndrome (CTS) is a common disorder resulting from compression of the median nerve at the wrist [18]. Diagnosis of CTS is based on clinical signs and symptoms and it is confirmed by electrodiagnostic studies. Quantitative US of the median nerve-innervated muscles can be used to evaluate CTS. However, there are few reports on the quantitative and objective assessment of fatty infiltration of muscle in focal neuropathy using US. In a study by Kim et al. [19], the ratio of thenar muscle EI (mean pixel brightness) to hypothenar muscle EI and the muscle inhomogeneity ratio (pixel standard deviation) were significantly higher in the patient group than in the control group, demonstrating that the EI ratio and inhomogeneity ratio were useful variables to evaluate disease severity and the presence of muscle denervation in patients with CTS.
In this study, we assessed the reliability of quantitative muscle US in healthy control subjects, differences in US findings between the control and CTS groups, and the correlations between quantitative muscle US findings and electrodiagnostic study results in patients with CTS. We also evaluated the clinical significance of quantitative muscle US in CTS.
Go to : 
MATERIALS AND METHODS
Subjects
Twenty patients who were confirmed to have CTS by electrodiagnostic study and who agreed to participate in the study were recruited. To establish a clear definition of CTS, electrodiagnostic criteria were used for inclusion. Patients with medical conditions that could cause peripheral neuropathy such as diabetes mellitus, malignancy, or other endocrine diseases were excluded. Patients with a previous history of wrist fracture or other injury of the upper extremities, neuromuscular junction disorder, motor neuron disease, central nervous system disorder, or peripheral nerve disease other than CTS were also excluded. To determine the reliability of quantitative US, 20 age-matched volunteers with no history of neuromuscular disease were recruited.
The study was approved by Chungnam National University Hospital Institutional Review Board (CNUH 2011-12) and all participants understood the purpose of the study.
Methods
Ultrasonography
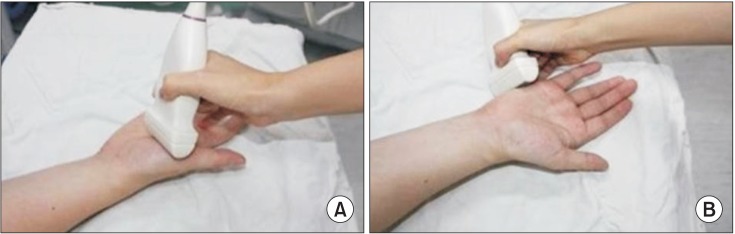
Transverse US images of the median-innervated abductor pollicis brevis (APB) muscle and the ulnar-innervated abductor digiti minimi (ADM) muscle were obtained to measure muscle cross-sectional area (CSA), thickness, and EI. US was performed with the subject sitting in a comfortable position with the upper arm in line with the trunk, the elbow flexed to 90°, the forearm supinated, the wrist in neutral position, and the thumb interphalangeal joint fully extended. During the measurements, subjects were asked to fully relax. For APB measurement, the probe was placed parallel to the ground at the midpoint of the first metacarpal bone, perpendicular to the long axis of the bone. ADM measurement was performed on the ulnar side of the palm, at the half of the fifth metacarpal bone, perpendicular to the long axis of the fifth metacarpal bone (Fig. 1).
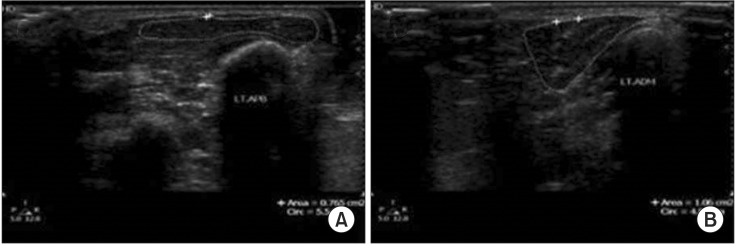
Quantitative muscle US was conducted using an ultrasound machine with a 3–12 MHz linear transducer (EnVisor; Philips, Cleveland, OH, USA). The muscle CSA and EI were measured using B-mode US under the same equipment settings including gain 50 dB and depth of 3 cm. A visible ultrasound gel layer with a thickness of 2–7 mm was maintained between the transducer and the skin on the ultrasound monitor for objective and consistent evaluation of the region of interest (ROI). The presence of a gel layer resulted in minimal compression from the transducer to the skin and the underlying tissues. Thickness of the APB and ADM muscles was measured between the upper and lower margins of the muscles at the thickest part. To measure the CSA, transverse images of the muscles were obtained at the level of maximum CSA. The CSAs of the APB and ADM muscles were determined by outlining the muscle contour by the internal rim using the area measurement software of the US system. Both arms were measured (Fig. 2).
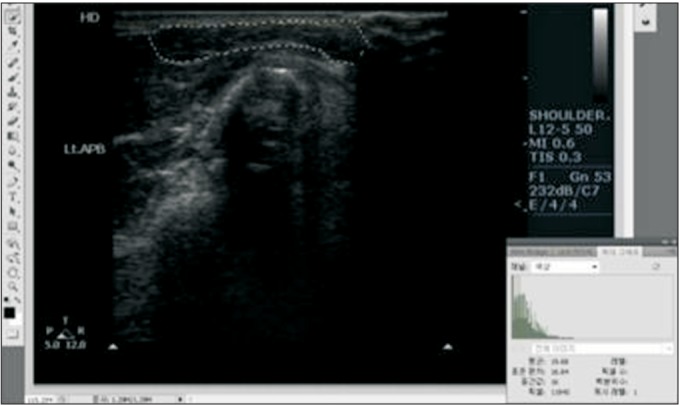
EI was determined using computer-assisted, grayscale analysis. ROIs were drawn for analysis of muscle EI using the line along the muscle fascia. Grayscale images were used to quantify muscle EI within each ROI. A grayscale image consists of achromatic color pixels with different brightness values ranging from 0 (pure black) to 255 (pure white), resolution 800×600 pixels, 8 bit [20]. We analyzed muscle EI by using the standard histogram function of a graphics package (Adobe Photoshop CS5; Adobe Systems Inc., San Jose, CA, USA) (Fig. 3).
To assess the inter-rater reliability of quantitative US, two blind examiners conducted ultrasound examinations in each control subject on the same day. Examinations were performed by one experienced examiner and one novice examiner. To assess intra-rater reliability, one examiner measured each muscle 3 times.
Electrodiagnostic study
All control and CTS subjects underwent a bilateral median and ulnar nerve conduction study (NCS) using the Nicolet Viking IV Electrodiagnostic System (Nicolet Instrument Inc., Madison, WI, USA). Electrodiagnostic study was performed with skin temperature maintained above 34℃. The median motor NCS was performed with stimulation at the wrist and the antecubital fossa and recording from the APB. The ulnar motor NCS was performed with stimulation at the wrist and the elbow and recording from the ADM. The onset latency, amplitude of the compound muscle action potential (CMAP), and conduction velocity of each nerve were recorded. The antidromic median and ulnar sensory nerve action potential (SNAP) responses over the second and fifth finger were recorded. Stimulation of the median and ulnar sensory nerves at the wrist level was performed 14 cm proximal to the recording electrodes. Additionally, stimulation of the median sensory nerve at the palm level was performed 7 cm proximal to the recording electrodes. The onset latency and amplitude of the SNAP were recorded.
CTS was diagnosed based on the following criteria: (1) median sensory nerve conduction study, distal latency >3.5 ms; (2) median motor nerve conduction study, distal latency >4.3 ms; (3) difference between distal sensory latency of the median nerve at the wrist and palm level >1.6 ms [21]. Based on the electrodiagnostic findings, patients’ hands were divided into 5 subgroups using the severity grading system based on the modified Padua criteria [22].
Statistical analysis
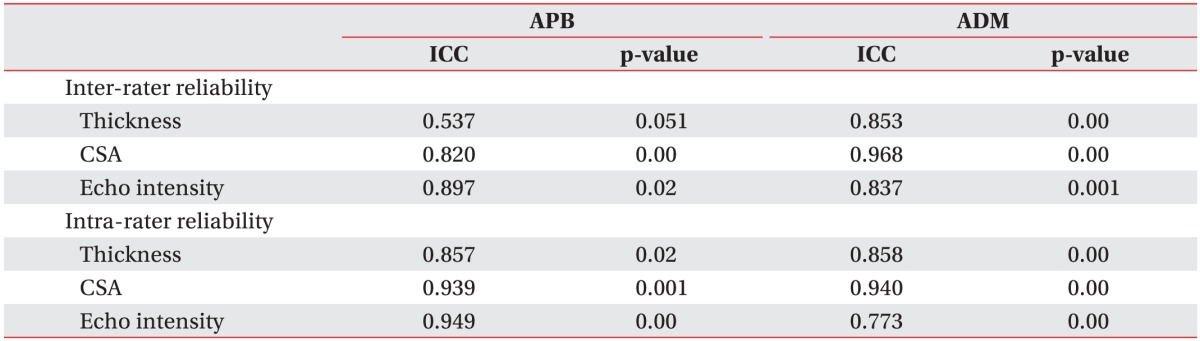
Intraclass correlation coefficient (ICC) was used to quantify inter-rater and intra-rater reliability for quantitative US in control subjects. We interpreted the results considering that an ICC above 0.75 indicated excellent reliability, ICC between 0.4 to 0.75 indicated fair to good reliability, and ICC below 0.4 had poor reliability [23].
Differences in muscle thickness, CSA, and EI between the CTS patient and control groups were analyzed using the independent t-test. The p-values <0.05 were considered statistically significant. Pearson correlation coefficient and corresponding p-values were used to evaluate the relationships between quantitative US parameters and electrodiagnostic study results. All analyses were performed using SPSS Statistics ver. 19.0 (SPSS Inc., Chicago, IL, USA). All measured values are reported as mean±standard deviation.
Go to :
RESULTS
Subject characteristics
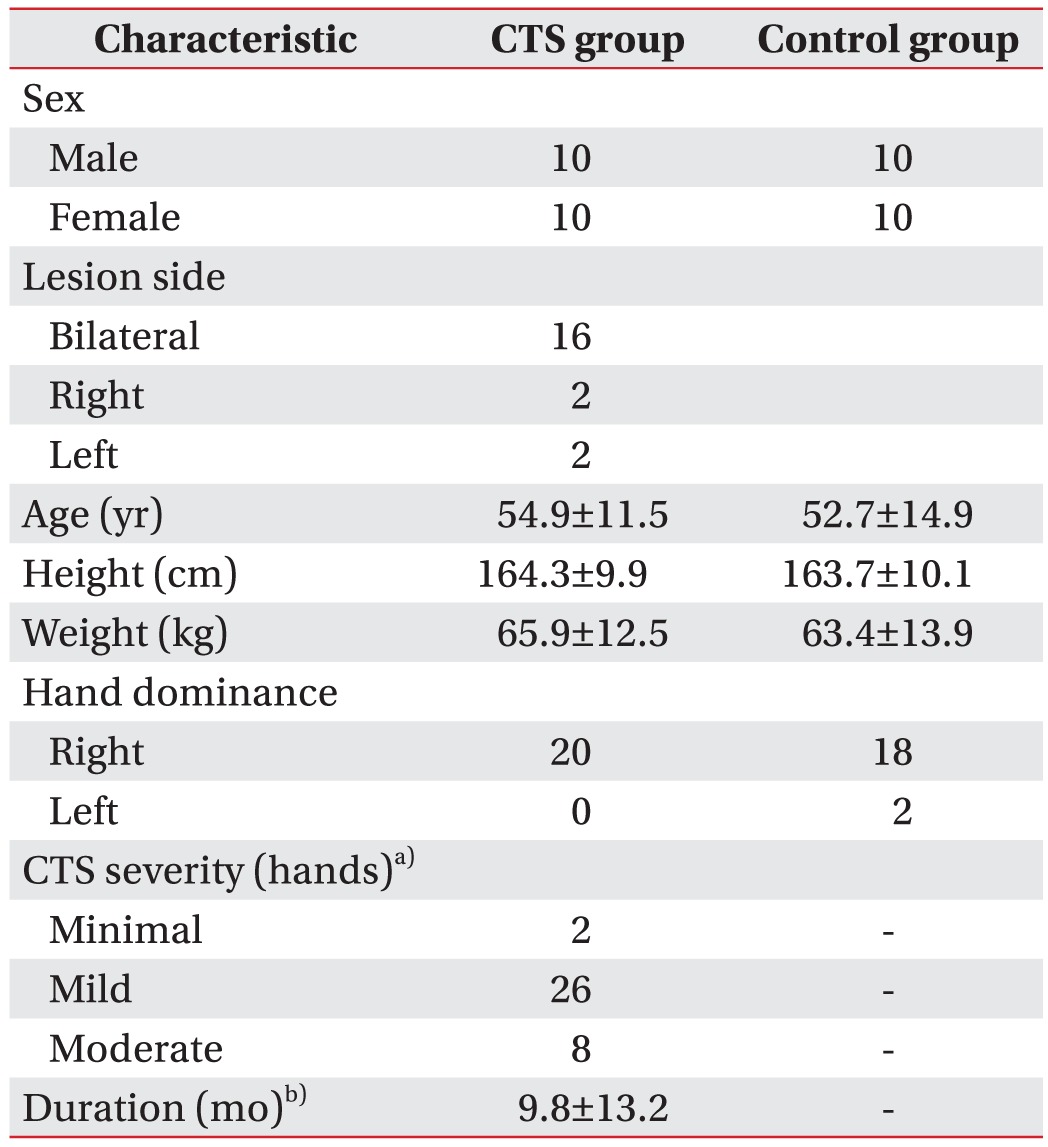
A total of 20 patients with CTS (bilateral, 16; right, 2; left, 2; mean age, 54.9±11.5 years) and 20 control subjects (mean age, 52.7±14.9 years) were included in this study. Baseline characteristics of all subjects are shown in Table 1. There were no differences in sex, age, height, and weight between the two groups.
Quantitative muscle ultrasonography in control subjects
The results of the inter-rater and intra-rater reliability analyses in the control group are shown in Table 2. The quantitative US findings demonstrated excellent inter-rater reliability for CSA and EI of the APB; and for thickness, CSA, and EI of the ADM based on ICC values above 0.75. However, measurement of APB thickness showed fair to good inter-rater reliability between a novice assessor and an experienced assessor. Using 3 trials per rater, excellent intra-rater reliability was observed in thickness, CSA, and EI of the APB (ICC=0.857–0.949) and ADM (ICC=0.773–0.940). Additionally, quantitative muscle US findings did not significantly differ between men and women or the left hand and the right hand in the control group.
Comparison of ultrasonographic parameters between the CTS and control groups
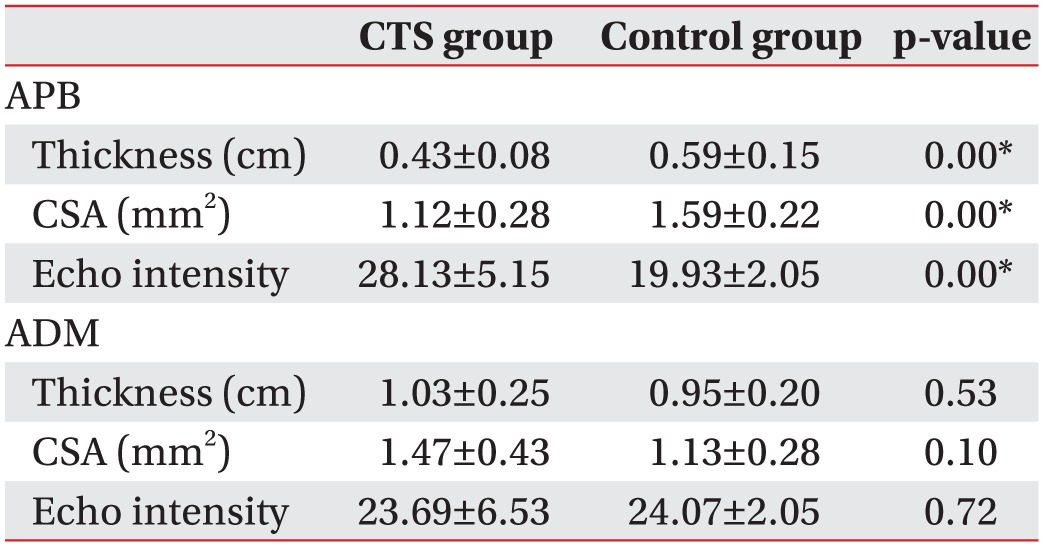
Comparison of quantitative muscle US parameters between CTS patients and control subjects are shown in Table 3. The muscle thickness and CSA of the APB were significantly decreased in CTS patients (p<0.05), and EI of the APB was significantly increased in CTS patients (p<0.05). However, results of ADM measurements did not differ significantly between controls and patients.
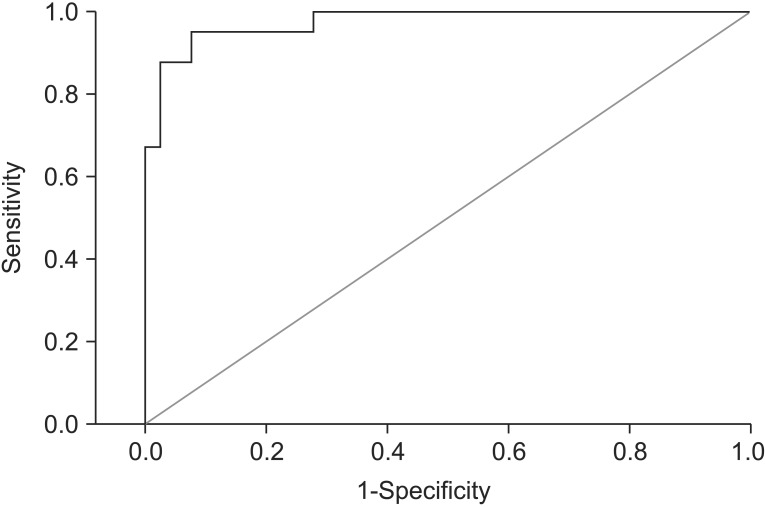
To determine the optimal cutoff point for EI to discriminate the CTS patient group from the control group, receiver operating characteristic (ROC) curve analysis was performed (Fig. 4). The optimal cutoff point of EI to define CTS was 22.60 (sensitivity 92.5%, specificity 92.5%). EI had a relatively high area under the curve (AUC=0.976).
Relationship between electrodiagnostic study and quantitative muscle ultrasonography
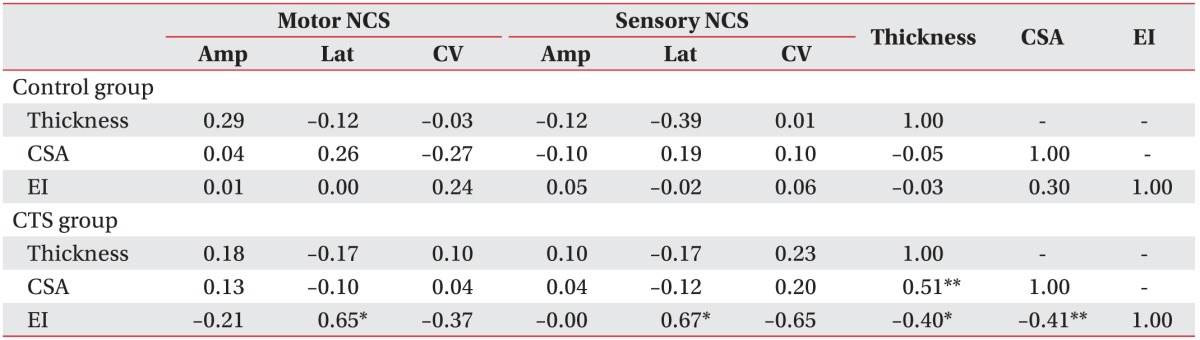
The correlation between quantitative US and electrodiagnostic parameters in the APB is shown in Table 4. There was no significant correlation between quantitative US and electrodiagnostic parameters in the control group. However, in CTS patients, EI demonstrated a significant positive correlation with the latency of the median motor and sensory NCS (p<0.05). EI was negatively correlated with muscle thickness and CSA in CTS patients (p<0.05). These significant relationships are shown graphically by using scatter plots (Fig. 5).
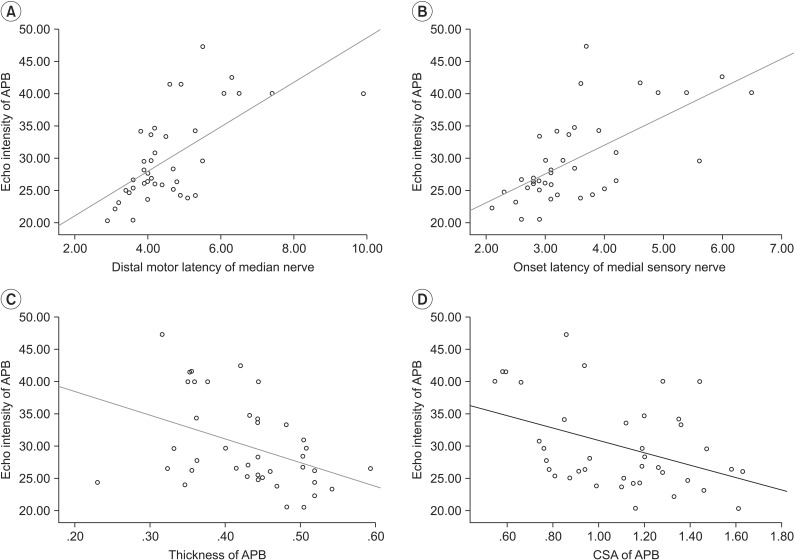 | Fig. 5Pearson correlation scatter plots for study results of echo intensity of abductor pollicis brevis (APB). (A) Distal motor latency of the median nerve (r=0.65). (B) Onset latency of the median sensory nerve (r=0.67). (C) Thickness of APB (r=−0.4). (D) Cross-sectional area (CSA) of APB (r=−0.41).
|
Go to :
DISCUSSION
The aim of this study was to investigate the differences in quantitative US findings between control subjects and CTS patients and to assess the correlation between electrodiagnostic study results and quantitative muscle US findings.
Musculoskeletal ultrasonography has been established as a diagnostic method for decades. Improvements in technology have led to its broad use in many specializations. One of its main indications is the differentiation of normal and pathological anatomical structures [24]. CTS can be diagnosed by sonography, mainly based on the demonstration of an increase in CSA of the median nerve at the level of the pisiform bone. Additionally, nerve ultrasonography in cases of peripheral neuropathy has the advantage of being able to detect a mass lesion, anatomical variants, and the underlying abnormality [25]. However, there are few reports of CTS diagnosis using quantitative muscle ultrasonography.
On muscle US, the muscle EI was measured in addition to muscle thickness and CSA. Time between sending and receiving the ultrasound pulse determines the location of the corresponding pixel, and the amplitude of the sound wave corresponds to the brightness of the image. The amount of returning echoes per square unit area determines the gray value of the image and that gray value is EI [26]. Muscle EI was determined as mean pixel brightness, and the standard deviation of pixel brightness indicates muscle inhomogeneity [1219]. Changes in muscle echogenicity reflected denervation edema after nerve injury, followed by accumulation of fat and fibrous tissue [27]. In neuropathy or myopathy, muscle EI changes differently. Neurogenic disorders usually lead to an inhomogeneous increase in EI with atrophy. Myopathies generally result in a homogeneous increase in muscle EI, often accompanied by a preserved muscle bulk [26].
In this study, we assessed the reliability of quantitative US of the APB and ADM in control subjects. Excellent inter-rater and intra-rater reliability were observed for EI and CSA measurements in both APB and ADM. The APB thickness showed fair to good inter-rater reliability. Some studies have reported the inter-rater reliability of muscle thickness or CSA. Wallwork et al. [28] studied the intra-rater and inter-rater reliability of multifidus muscle thickness measurements in the parasagittal plane, conducted by an experienced assessor and a novice assessor. When a standardized protocol was followed, high inter-rater reliability and intra-rater reliability were demonstrated (ICC=0.87–0.97). In our study, we found that the ICC for APB thickness was lower than the ICC for CSA and EI. Muscle images in the thenar area are not from a single muscle, i.e., the APB. The APB muscle is flat in shape and close to other small muscles. Therefore, it is difficult to distinguish the muscle boundaries clearly. We further tried to minimize the effect of probe compression by maintaining an ultrasound gel layer with a thickness of 2–7 mm between the transducer and the skin. However, compression of the probe could have occurred and might have affected the muscle thickness.
Arts et al. [13] demonstrated that thickness and EI in the muscles of the upper extremities showed sex differences and a muscle-specific nonlinear correlation with age in volunteers aged 17–90 years. In our study, the impact of age on EI was not assessed because the age range of subjects (range, 43–73 years) was too limited to allow a robust statistical analysis. However, quantitative muscle US findings did not differ according to sex or between the left hand and the right hand in our study. Further study is needed to evaluate the effect of subject characteristics on EI.
In a study by Kim et al. [19], the hands of CTS patients demonstrated a higher EI than those of control subjects. Subgroup analysis demonstrated that the EI measurements in the severe CTS group were significantly higher than those in the moderate CTS group. These results suggest that muscle EI parameters reflect the severity of CTS, and US may be able to objectively and quantitatively assess fatty infiltration of the APB muscle. Our study yielded similar results in that the muscle thickness and CSA of the APB were significantly decreased and EI of the APB was significantly increased in the CTS group. In addition, EI of the APB demonstrated a significant positive correlation with the latency of median motor and sensory NCS (p<0.05) and a negative correlation with muscle thickness and CSA of the APB in CTS patients. However, CSA and thickness of the APB were not significantly correlated with electrodiagnostic study results. Therefore, our results suggest that quantitative muscle US findings, especially EI, have clinical value in the evaluation of muscle change in CTS.
Simon et al. [28] performed quantitative US for the assessment of neuromuscular disorders involving denervation of hand muscles. Quantitative ultrasound of hand muscles, APB, ADM, and first dorsal interosseous muscles, could distinguish between moderate and severe muscle denervation and healthy hand muscles. Ultrasound parameters were predictive of the severity of denervation identified on electromyography (EMG) studies. Muscle thickness and echogenicity change in denervated muscles correlated with the severity of EMG abnormalities. Muscle thickness decreased with increasing severity of EMG abnormalities, while muscle echogenicity increased with increasing severity of denervation.
In the control group, there was no significant correlation between quantitative US findings and electrodiagnostic parameters. Therefore, the amplitude of CMAP in the APB and ADM was not related to the thickness and CSA of APB and ADM in healthy volunteers.
Our study had several limitations. First, the number of enrolled subjects was small. Additionally, this study included only mild to moderate CTS patients. Therefore, it is difficult to generalize these study results to all CTS patients. Further studies with larger sample sizes and different subject populations are needed to increase our understanding of the clinical applicability of this method. Second, we did not evaluate the CSA of median nerves. For the diagnosis of CTS, an increase in CSA of the median nerve is a characteristic feature of ultrasonography and it had been widely studied. Further study is needed to demonstrate the relationship between the CSA of the median nerve and quantitative muscle US findings in CTS.
In conclusion, quantitative muscle US has high interrater and intra-rater reliability in control subjects. Ultrasonographic findings of CTS patients significantly differed from those of the control group. EI of the APB muscle correlated with the electrodiagnostic findings of CTS. Quantitative analysis of muscle thickness, CSA, and EI could be a more objective and reliable method to detect peripheral neuropathy. Therefore, quantitative muscle US may be clinically helpful in determining the presence of CTS. Further study for other neuromuscular diseases is necessary to evaluate peripheral muscles by using quantitative muscle US.
Go to :
 XML Download