Abstract
Objective
To investigate whether motor evoked potential (MEP) amplitude ratio measurements are sufficiently objective to assess functional activities of the extremities. We also delineated the distribution between the presence or absence of MEPs and the Medical Research Council (MRC) scale for muscle strength of the extremities.
Methods
We enrolled 183 patients with first-ever unilateral hemiplegia after stroke. The MEP parameters were amplitude ratio (amplitude of affected side/amplitude of unaffected side) recorded at the first dorsal interosseous (FDI) and tibialis anterior (TA) muscles. We performed frequency analyses using the MRC scale for muscle strength and the presence or absence of evoked MEPs. Change on the MRC scale, hand function tests (HFTs), and the Modified Barthel Index (MBI) subscore were compared between the evoked MEP and absent MEP groups using the independent t-test. Receiver operating characteristic curves were used to determine the optimal cutoff scores for the MEP amplitude ratio using the HFT results and MBI subscores. Correlations between the MEP amplitude ratio and the MRC scale, HFTs, and MBI subscore were analyzed.
Results
About 10% of patients with MRC scale grades 0-2 showed evoked MEPs at the FDI muscle, and 4% of patients with MRC scale grades 3-5 did not show MEPs. About 18% of patients with MRC scale grades 0-2 showed evoked MEPs at the TA muscle, and 4% of patients with MRC scale grades 3-5 did not show MEPs. MEP amplitude increased with increasing MRC scale grade. The evoked MEP group had more significant changes on the MRC scale, HFT, and the climbing stair score on the MBI than those in the group without MEPs. Larger MEP amplitude ratios were observed in patients who had more difficulty with the HFTs and ambulation. The MEP amplitude ratio was significantly correlated with the MRC scale, HFT, and MBI subscore.
Motor impairment affects about two-thirds of patients after stroke [1,2,3]. Various clinical standards and tests are used to objectively assess these dysfunctions, which is the main target of rehabilitative therapy after stroke. Among others, an assessment of motor evoked potentials (MEPs) using transcranial magnetic stimulation (TMS) is widely used as a quantitative test to objectively evaluate the corticospinal pathway. MEPs can be used to follow-up motor function and as a clinical predictor of functional recovery by evaluating the early state of the corticospinal pathway because it is a safe and easy method to perform with acute-phase patients [4,5,6]. By predicting the prognosis through MEPs, rehabilitation strategies can be individualized for each patient [7,8].
Many studies have reported that MEP parameters (presence or absence of MEPs, MEP amplitude, onset latency, motor threshold, and central motor conduction time) indicate the functional recovery prognosis of the upper and lower limbs [8,9,10,11,12], and that the prognosis is good with positive MEP responses and poor with negative MEP responses [12,13,14,15,16,17]. Previous MEP studies have focused on predicting the prognosis of positive or negative MEPs responses in patients with stroke, and only a limited number of studies have investigated the correlation between MEP amplitude and motor function. Furthermore, current disability assessments of patients with stroke in Korea rely mostly on subjective measures, such as the manual muscle test (MMT) and the Korea version of the Modified Barthel Index (K-BMI), and only a few objective indices reflect motor function.
We performed a MEP study in patients with stroke and obtained the MEP amplitude ratio in patients with positive MEP responses during stimulation of the affected side to examine whether the MEP amplitude ratio could be used as an objective motor function index of the upper and lower extremities. We also investigated the actual distribution of muscle power on the affected side in patients with positive and negative MEP responses. The aim of this study was to determine whether MEPs could be used to predict positive or negative MEPs responses but also to investigate whether MEPs could be used as a quantitative measure of the degree of motor function in patients with stroke.
This was a retrospective study using medical records of patients who were diagnosed with stroke and hospitalized in the department of rehabilitation medicine of our hospital between June 2011 and May 2014. MEPs induced by TMS, a neurological examination, the MMT, hand function tests (HFTs), and K-BMI data were analyzed from the inpatient medical records. A total of 183 patients with hemiplegia, who met the inclusion criteria, including first-attack stroke (infarction or intracranial hemorrhage) at the acute and subacute phase with clear consciousness were selected. Exclusion criteria were recurrent stroke, double hemiplegia from lesions in bilateral hemispheres, subarachnoid hemorrhage, brain tumor, Moyamoya disease, ischemic brain injury, hydrocephalus, and missing medical records.
The MagPro X100 instrument (Medtronic Inc., Copenhagen, Denmark) with 70-mm, figure 8-shaped coils was used to stimulate the cortex. The electrodes were attached to bilateral first dorsal interosseous (FDI) and tibialis anterior (TA) muscles to stimulate the primary motor cortex. The stimulation point was set to see the lowest resting motor threshold (RMT), which was defined to produce >50 µV in at least five of 10 trials, and amplitude was measured from MEPs elicited by stimulating the primary motor cortex at 120% intensity of the RMT. The affected and unaffected hemispheres were stimulated four times each, and peak-to-peak amplitudes were selected to estimate the amplitude ratio (amplitude of the affected side/amplitude of the unaffected side).
HFTs included grip strength, the nine-hole peg test (NHPT), and the Box and Block test. The JAMAR hand dynamometer (JAMAR, Chicago, IL, USA) was used to measure maximum grip power. The Box and Block test assesses gross manual dexterity by counting the number of blocks moved from one box to another for 1 minute. The NHPT assesses fine manual dexterity by measuring the time it takes to place nine pegs one by one into nine holes and then remove them one by one.
Activities of daily living were assessed using the K-BMI, which is the sum of all scores for 10 items, including personal hygiene, bathing, feeding, toileting, stair climbing, dressing, bowel control, bladder control, ambulation or wheelchair, and chair-bed transfer.
The MMT assesses grades of finger flexion and extension, and ankle dorsiflexion strength was evaluated with the Medical Research Council (MRC) scale, which ranges from 0 to 5.
SPSS ver. 18.0 for Windows (SPSS Inc., Chicago, IL, USA) was used for statistical analyses. The positive and negative MEP responses on the MRC scale and the distribution of the MEP amplitude ratios were analyzed using cross-tabulation. The independent t-test was used to determine significant differences in the functional test scores measured at the times of hospitalization and discharge between patients with positive and negative MEP responses. Receiver operating characteristics curves were used to determine the cutoff values, and the area under the curve (AUC) was used to obtain the minimum MEP amplitude ratio for patients who performed the HFTs and were capable of ambulation and stair climbing. Spearman correlation test was used to assess the associations between the MEP amplitude ratio, MRC scale, the HFTs, and the K-MBI. The p-values less than 0.05 were considered significant.
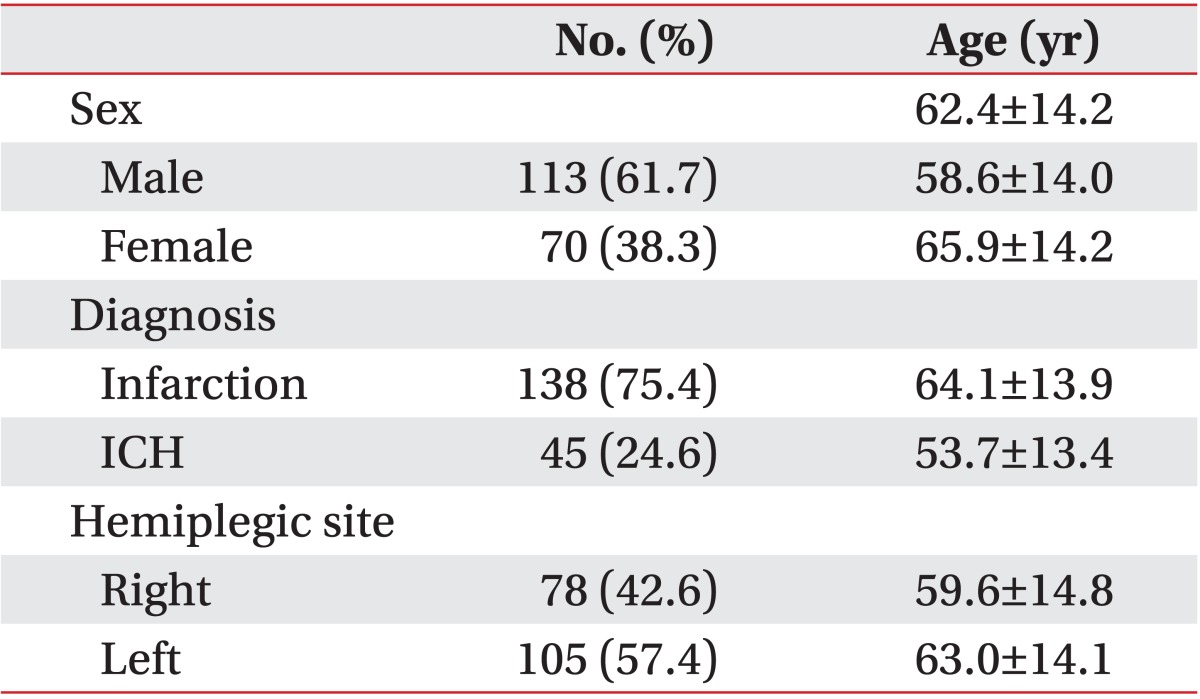
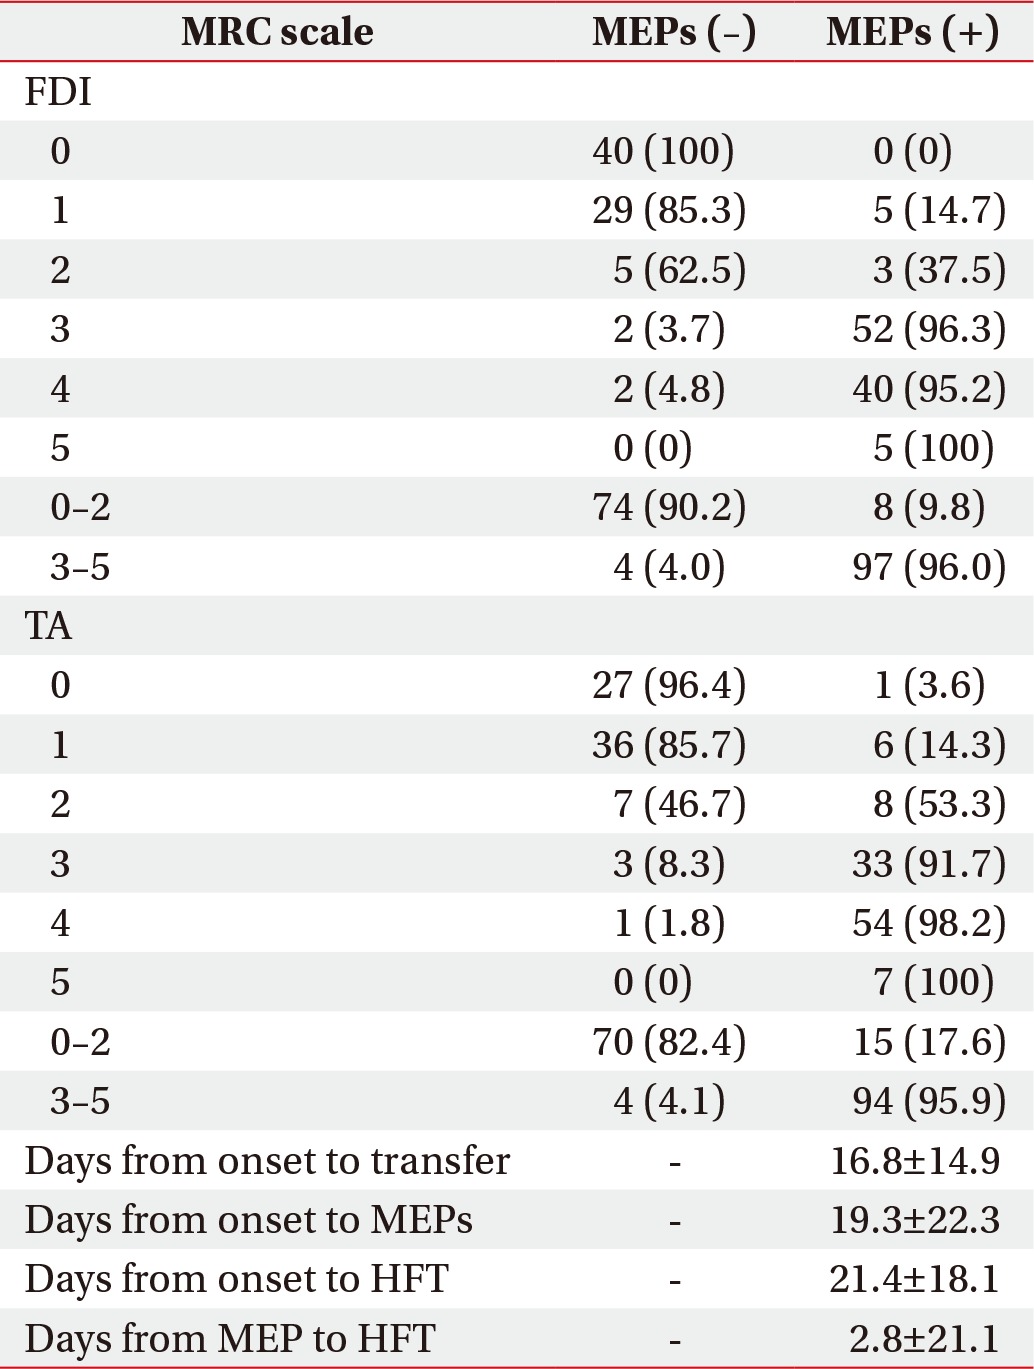
The medical records of 183 patients with stroke, acute/subacute hemiplegia, and clear consciousness were analyzed. Among the enrolled patients, 138 suffered an infarction (mean age, 64.1±13.9 years), 45 had an intracranial hemorrhage (mean age, 53.7±13.4 years), 113 were male (mean age, 58.6±14.0 years), and 70 were female (mean age, 65.9±14.2 years). Left hemiplegia was observed in 105 patients (57.4%) and right hemiplegia in 78 patients (42.6%) (Table 1). A mean of 16.8±14.9 days was needed for patients to be transferred to the department of rehabilitation after stroke onset, 19.3±22.3 days for the MEP study, and 21.4±18.1 days for the HFTs (Table 2).
MEP responses at the FDI were positive in 100% of patients with MRC grade 5 and negative in 100% with MRC grade 0. MEPs responses were positive in 95.2% and negative in 4.8% with grade 4, positive in 97.4% and negative in 3.7% with grade 3, positive in 66.7% and negative in 33.3% with grade 2, and positive in 23.1% and negative in 76.9% with grade 1. MEP responses were positive in 96.0% and negative in 4.0% with MRC grades 3-5 and positive in 9.8% and negative in 90.2% with MRC grades 0-2. MEPs responses at the TA were positive in 100% with MRC grade 5, positive in 98.2% and negative in 1.8% with grade 4, positive in 91.7% and negative in 8.3% with grade 3, positive in 53.3% and negative in 46.7% with grade 2, positive in 14.3% and negative in 85.7% with grade 1, and positive in 3.6% and negative in 96.4% with grade 0. The MEP responses were positive in 95.9% and negative in 4.1% with MRC grades 3-5 and positive in 17.6% and negative in 82.4% with MRC grades 0-2 (Table 2).
The mean MEP amplitude ratio was investigated using the MRC scale in patients with positive MEP responses. The mean MEP amplitude ratio for the FDI was 20.9%±21.5% in patients with grade 1 (n=5), 26.9%±18.8% in those with grade 2 (n=3), 32.5%±24.5% in those with grade 3 (n=52), 63.8%±35.1% in those with grade 4 (n=40), and 77.2%±38.1% in those with grade 5 (n=5). The mean MEP amplitude ratios for the TA were 34.0% (n=1), 29.4%±38.9% (n=8), 42.0%±22.2% (n=33), 65.9%±35.1% (n=55), and 94.3%±15.3% (n=6) (Fig. 1).
Changes in the MRC scale, the HFT, and K-MBI scores determined at referral and discharge were compared between the MEP-positive and MEP-negative groups. The MRC scale increased by 0.66±0.74 points for finger flexion, by 0.63±0.75 points for extension, and by 0.55±0.69 points for ankle dorsiflexion in the MEP-positive group, compared with 0.28±0.66, 0.26±0.65, and 0.31±0.72 points, respectively, in the MEP-negative group. All comparisons were significantly different between the two groups. Grip power increased by 3.01±0.81 kg and the Box and Block test score increased by 8.28±15.96 in the MEP-positive group, compared with 0.74±2.49 kg and 1.76±6.01, respectively, in the MEP-negative group. All comparisons were significantly different between the two groups. When patients in the MEP-positive group with a <10% MEP amplitude ratio were compared with patients in the MEP-negative group, the MEP-positive group showed more significant improvements on the HFTs than those in the MEP-negative group. Ambulation based on the K-MBI score improved by 3.44±3.55 points and stair climbing improved by 2.86±2.68 points in the MEP-positive group, compared with 4.00±3.57 and 1.81±2.64, respectively, in the MEP-negative group. Stair climbing, but not ambulation, was significantly different between the two groups (Table 3).
The MEP amplitude ratio of the FDI during the HFTs was 9.3% (sensitivity, 80.6%; specificity, 83.5%; AUC, 0.873) among patients whose grip strength was measurable, 10.4% (sensitivity, 80.9%; specificity, 84.3%; AUC, 0.891) among patients who could perform the Box and Block test, and 13.3% (sensitivity, 80.3%; specificity, 75%; AUC, 0.819) among patients who could perform the NHPT (Table 4, Fig. 2).
The MEP amplitude ratio of the TA for the K-MBI was 5.4% (sensitivity, 80.2%; specificity, 80.6%; AUC, 0.812) among patients with ambulation grade 3 or higher (score 8, assistance required with reaching aids), and 15.3% (sensitivity, 80.0%; specificity, 73.1%; AUC, 0.809) among patients with ambulation grade 4 or higher (score 12, independent ambulation but unable to walk 50 m without help, or supervision needed for confidence or safety in hazardous situation). The ratio was 15.6% (sensitivity, 80.7%; specificity, 71.0%; AUC, 0.798) among patients with stair climbing grade 3 or higher (score 5, able to ascend/descend but unable to carry walking aids and needs supervision and assistance), and 18.2% (sensitivity, 81.0%; specificity, 62.4%; AUC, 0.767) among patients with stair climbing grade 4 or higher (score 8, no assistance required, but supervision may be required for safety due to morning stiffness, shortness of breath, etc.) (Table 4, Fig. 2).
The MEP amplitude ratio of the FDI was significantly correlated with the MRC grades for finger flexion and extension, the HFTs, and the total K-MBI score. The MEP amplitude ratio of the TA was also significantly correlated with MRC grade for ankle dorsiflexion, stair climbing, ambulation, and chair/bed transfers on the K-MBI, and the total K-MBI score (Table 5).
We found that grip power was measurable when the MEP amplitude ratio of the FDI was at least 9.3%. The Box and Block Test and the NHPT could be performed when the ratio of each of them were at least 10.4% and 13.3%. K-BMI ambulation grade 3 (assistance required with reaching aids) was available at ≥5.4%. The MEP amplitude ratio of the TA and grade 4 (independent ambulation but unable to walk 50 m without help, or supervision needed for confidence or safety in a hazardous situation) was available at ≥15.3%. The statistical results also indicate that K-MBI stair climbing grade 3 (able to ascend/descend but unable to carry walking aids, and needs supervision and assistance) was available at ≥15.6%, and grade 4 (generally no assistance required) was available at ≥18.2%. Patients in the MEP-positive group who scored higher on the MRC scale for the FDI and TA had higher MEP amplitude ratios, excluding MRC grades 2 and 3 for the TA. In addition, when the differences in the MRC scale, the HFTs, and the K-MBI scores at hospitalization and discharge were compared between the MEP-positive and negative groups, scores on the MRC scale, the HFTs, and stair climbing on the K-MBI increased significantly in the MEP-positive group, excluding K-MBI ambulation. In particular, patients in the MEP-positive group with a <10% MEP amplitude ratio had significantly greater changes in the HFTs compared with those in the MEP-negative group.
A higher MRC scale score was more frequently associated with positive MEP responses and a lower MRC scale score was more frequently associated with negative MEPs responses, which was also true in previous studies [8,10,11,12]. However, MEPs were absent at the FDI in 4% of patients and at 4.1% of the TA in patient with MRC grades 3-5 but evoked in 9.8% and 17.6% of patients, respectively, with MRC grades 0-2. Patients with detectable muscle strength but a negative MEP response underwent MEP evaluations 10.1±5.3 days after stroke. Perilesional edema or ischemic penumbra during the acute phase of stroke may temporarily increase the excitability threshold of the corticospinal tract or induce a conduction block [4,14]. Thus, the affected hemisphere in these patients often has a higher excitability threshold upon stimulation than that of the unaffected hemisphere. TMS intensity insufficient to activate the motor neurons in the affected hemisphere may not evoke MEPs, even in patients with some muscle strength [6]. Therefore, a negative MEP response after acute/subacute stroke may yield false-negative results [15], whereas positive MEP responses at a re-examination during recovery may indicate a good prognosis [4,16]. Thus, we compared thresholds of the unaffected hemisphere between patients with muscle strength above MRC grade 3 but who were in the MEP-negative group with patients with muscle strength above MRC grade 3 in the MEP-positive group. The thresholds of the unaffected hemisphere in the MEP-negative group were 63.4±12.5% for the FDI and 77.2±17.9% for the TA, which were higher than the thresholds (FDI, 53.4±14.4%; TA, 67.8±16.1%) in the MEP-positive group. The differences were not significant between the two groups, but the results suggest that the MEP-negative group had a higher excitability threshold than that in the MEP-positive group, indicating that TMS intensity was insufficient to activate the corticospinal fibers in many cases. We also reviewed the medical records of patients with MRC grades 0-2 and positive MEP responses and identified improved muscle strength long after the MEP study, comorbidities, or causes of muscle weakness, such as general weakness, pain, and stiffness. Considering the positive MEPs responses at the lower MRC grade, clinicians should consider that a patient's condition may affect MMT results.
The MRC scale, the HFTs, and K-MBI stair climbing changed significantly in the MEP-positive group compared with those in the MEP-negative group, except for ambulation on the K-MBI. Particularly, patients in the MEP-positive group with a <10% MEP amplitude ratio had significantly greater changes on the HFTs compared with those in the MEP-negative group. Despite low cortex excitability, the excitability of the corticospinal tract by TMS was associated with better hand recovery than in the absence of excitability, suggesting that the presence or absence of the corticospinal pathway is essential for recovering hand function. In addition, the MEP amplitude ratio cutoff values among patients who could perform all of the HFTs and the K-MBI ambulation test were higher for the more sophisticated movements of the HFTs and for more difficult ambulation. These results can be combined into a hypothesis that patients with a higher MEP amplitude ratio have greater muscle strength and perform more challenging functional activities with the upper and lower limbs, and that MEPs may be an indicator of upper and lower limb function. Current disability assessments in Korean patients with stroke rely mostly on subjective measures, such as the K-MBI and MMT, but the MEP amplitude ratio appears promising as an objective parameter to reflect a patient's functional capabilities and as an indirect predictor of muscle strength and functional capabilities. The MEP amplitude ratio may also be useful as an indirect tool to predict muscle strength and functional capabilities in patients with acute/subacute stage stroke and cognitive impairment or sensory aphasia, which are difficult to assess. To this end, further studies are required with larger samples of patients with acute/subacute stroke to assess a wide variety of variables, as well as chronic patients at the time of the disability diagnosis.
The MEP amplitude ratio of the FDI was significantly correlated with finger flexion and extension, all of the HFTs, and the total K-MBI score. The MEP amplitude ratio refers to the relative difference in cortical excitability in bilateral hemispheres, representing the degree of corticospinal connectivity [5,18]. Considering the close relationship between hand function and corticospinal connectivity [5,19], the MEP amplitude ratio measured 19.3±22.3 days after stroke seemed to represent hand strength and dexterity well.
The absolute value of the MEP amplitude can vary depending on the individual, test environment, and test device [20,21,22]. In a previous study, the MEP amplitude ratio was more significantly related with the HFTs and muscle strength than the MEP amplitude [8]. Thus, we used the MEP amplitude ratio, rather than the MEP amplitude, to investigate cutoff values when the HFTs and ambulation could be performed. We also evaluated the associations between the MEP amplitude ratio and the HFT, muscle strength, and K-MBI scores.
The limitations of this study include that MEPs were measured only once at the acute/subacute stage in most patients, and no follow-up MEP assessment was performed. Further studies on MEPs and functional assessments at the time of the disability diagnosis will be required, as well as studies involving larger samples of acute/subacute and chronic patients to determine whether the MEP amplitude ratio represents upper and lower extremity function, as well as a patient's prognosis. The absolute value of the MEP amplitude can vary depending on the individual, the test environment, and the test device. This 4-year retrospective study was performed using the same test device but not the same examiners. There was also lack of control for patient age and sex, test duration, degree of cerebral infarction and hemorrhage, and the affected cerebral hemisphere. Lastly, a corticospinal tract injured by stroke may be compensated by the extra-corticospinal tract, allowing the injured corticospinal tract to appear to function better than it actually is functioning. The extent of compensation by the extra-corticospinal tract could not be elucidated in this study.
In conclusions, positive MEP responses were more frequently seen in patients with a higher MRC grade than in those with a lower MRC grade. The higher MEP amplitude ratio in the MEP-positive group was associated with the possibility of conducting more sophisticated hand movements and more difficult ambulation activities, suggesting that the MEP amplitude ratio may be useful to roughly estimate patient's functional capabilities. However, there remains a lack of studies on whether the MEP amplitude ratio represents functional capabilities of patients with stroke; thus, more long-term, detailed studies are necessary.
ACKNOWLEDGMENTS
This work was supported by the Industrial Technology Innovation Program (No. 10046741, Development of diagnosis and training system for rehabilitation of core muscle) funded by the Ministry of Trade, Industry and Energy of Korea.
References
1. Langhorne P, Coupar F, Pollock A. Motor recovery after stroke: a systematic review. Lancet Neurol. 2009; 8:741–754. PMID: 19608100.

2. Hendricks HT, van Limbeek J, Geurts AC, Zwarts MJ. Motor recovery after stroke: a systematic review of the literature. Arch Phys Med Rehabil. 2002; 83:1629–1637. PMID: 12422337.

3. Bonita R, Beaglehole R. Recovery of motor function after stroke. Stroke. 1988; 19:1497–1500. PMID: 3201508.

4. Escudero JV, Sancho J, Bautista D, Escudero M, Lopez-Trigo J. Prognostic value of motor evoked potential obtained by transcranial magnetic brain stimulation in motor function recovery in patients with acute ischemic stroke. Stroke. 1998; 29:1854–1859. PMID: 9731608.

5. Talelli P, Greenwood RJ, Rothwell JC. Arm function after stroke: neurophysiological correlates and recovery mechanisms assessed by transcranial magnetic stimulation. Clin Neurophysiol. 2006; 117:1641–1659. PMID: 16595189.

6. Trompetto C, Assini A, Buccolieri A, Marchese R, Abbruzzese G. Motor recovery following stroke: a transcranial magnetic stimulation study. Clin Neurophysiol. 2000; 111:1860–1867. PMID: 11018503.

7. van Kuijk AA, Pasman JW, Hendricks HT, Zwarts MJ, Geurts AC. Predicting hand motor recovery in severe stroke: the role of motor evoked potentials in relation to early clinical assessment. Neurorehabil Neural Repair. 2009; 23:45–51. PMID: 18794218.

8. Son SY, Park SH, Seo JH, Ko MH. Correlation of the motor evoked potentials amplitude and hand function of the affected side in stroke. J Korean Acad Rehabil Med. 2011; 35:34–41.
9. Thickbroom GW, Byrnes ML, Archer SA, Mastaglia FL. Motor outcome after subcortical stroke: MEPs correlate with hand strength but not dexterity. Clin Neurophysiol. 2002; 113:2025–2029. PMID: 12464343.

10. Lee JJ, Jung HY. The correlation of hemiplegic upper limb recovery with SEP and MEP in subjects with a stroke. J Korean Acad Rehabil Med. 2008; 32:512–517.
11. Hendricks HT, Pasman JW, van Limbeek J, Zwarts MJ. Motor evoked potentials of the lower extremity in predicting motor recovery and ambulation after stroke: a cohort study. Arch Phys Med Rehabil. 2003; 84:1373–1379. PMID: 13680577.
12. Kim C, Jeong J. The significance of motor evoked potentials as a prognostic factor in the early stage of stroke patients. J Korean Acad Rehabil Med. 1999; 23:1213–1220.
13. Lim KB, Kim JA. Activity of daily living and motor evoked potentials in the subacute stroke patients. Ann Rehabil Med. 2013; 37:82–87. PMID: 23525518.

14. Piron L, Piccione F, Tonin P, Dam M. Clinical correlation between motor evoked potentials and gait recovery in poststroke patients. Arch Phys Med Rehabil. 2005; 86:1874–1878. PMID: 16181957.

15. Pizzi A, Carrai R, Falsini C, Martini M, Verdesca S, Grippo A. Prognostic value of motor evoked potentials in motor function recovery of upper limb after stroke. J Rehabil Med. 2009; 41:654–660. PMID: 19565160.

16. Pennisi G, Rapisarda G, Bella R, Calabrese V, Maertens De Noordhout A, Delwaide PJ. Absence of response to early transcranial magnetic stimulation in ischemic stroke patients: prognostic value for hand motor recovery. Stroke. 1999; 30:2666–2670. PMID: 10582994.
17. Lee SY, Lim JY, Kang EK, Han MK, Bae HJ, Paik NJ. Prediction of good functional recovery after stroke based on combined motor and somatosensory evoked potential findings. J Rehabil Med. 2010; 42:16–20. PMID: 20111839.

18. van Hedel HJ, Murer C, Dietz V, Curt A. The amplitude of lower leg motor evoked potentials is a reliable measure when controlled for torque and motor task. J Neurol. 2007; 254:1089–1098. PMID: 17431701.

19. Jang SH. The role of the corticospinal tract in motor recovery in patients with a stroke: a review. NeuroRehabilitation. 2009; 24:285–290. PMID: 19458437.

20. Thickbroom GW, Byrnes ML, Mastaglia FL. A model of the effect of MEP amplitude variation on the accuracy of TMS mapping. Clin Neurophysiol. 1999; 110:941–943. PMID: 10400209.

21. Hess CW, Mills KR, Murray NM. Responses in small hand muscles from magnetic stimulation of the human brain. J Physiol. 1987; 388:397–419. PMID: 3079553.

22. Kiers L, Cros D, Chiappa KH, Fang J. Variability of motor potentials evoked by transcranial magnetic stimulation. Electroencephalogr Clin Neurophysiol. 1993; 89:415–423. PMID: 7507428.

Fig. 1
Amplitude ratio distribution using the Medical Research Council (MRC) scale for muscle strength for the first dorsal interosseous (FDI, A) and tibialis anterior (TA, B) muscles.
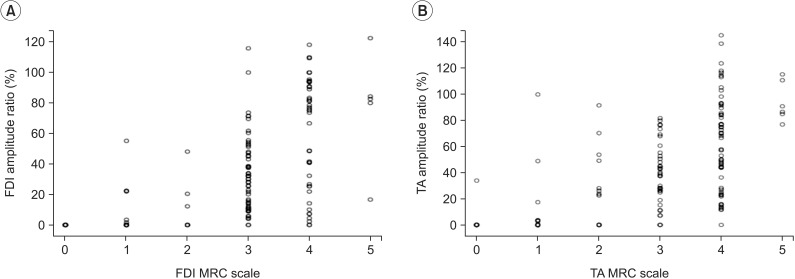
Fig. 2
Cutoff values of motor evoked potential (MEP) amplitude ratio for grip power (A), the Box and Block test (B), the nine-hole peg test (C), ambulation (D), and stair climbing (E). Larger MEP amplitude ratios indicated more difficulties with the hand function tests and the level of ambulation.
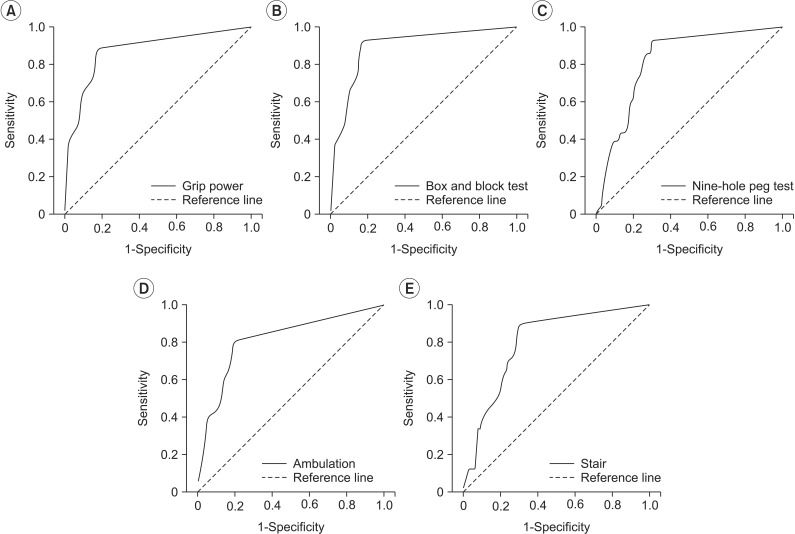
Table 3
Differences in the MRC scale and functional scores between admission and discharge in the MEPs (-) and MEPs (+) patients
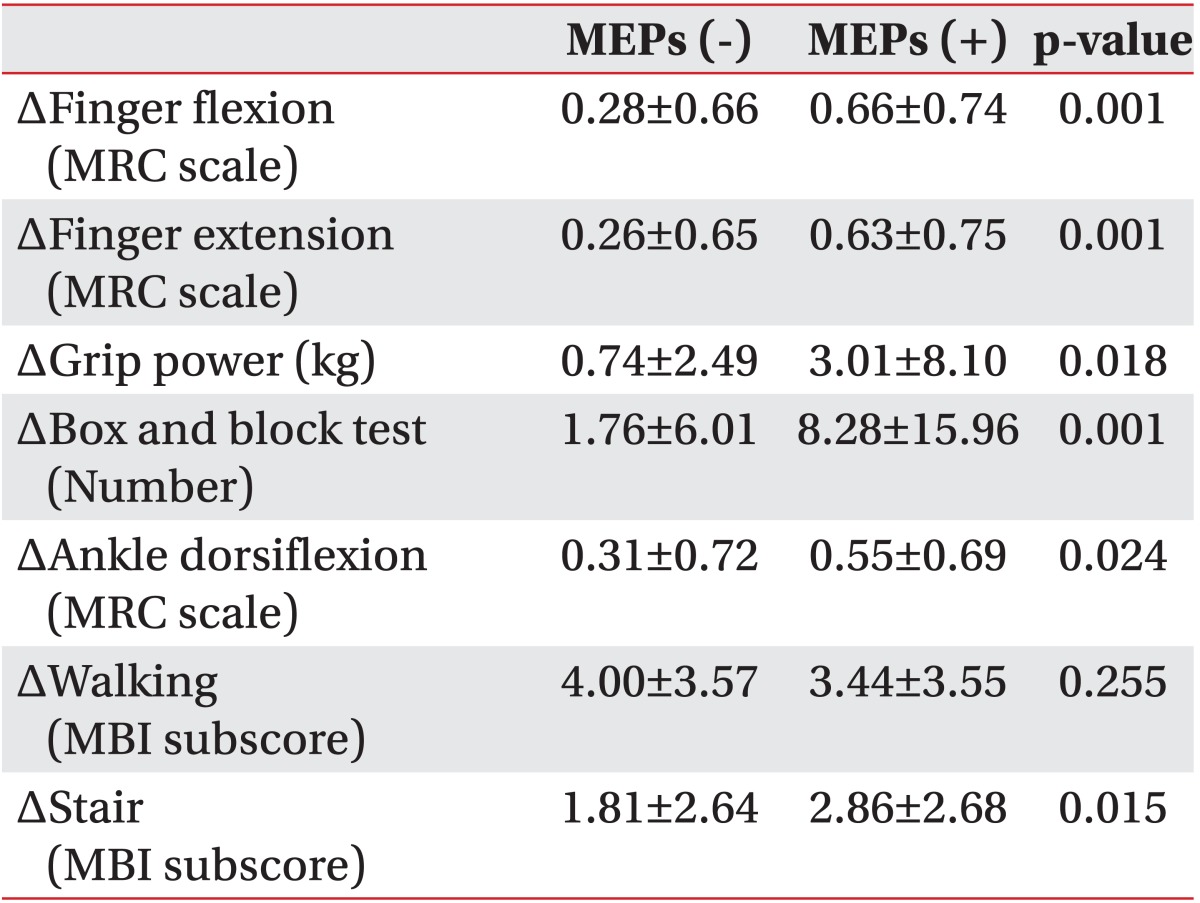
Table 4
Optimal cutoff scores for the MEP amplitude ratio when the hand function tests and MBI subscore could be determined

MEPs, motor evoked potentials; MBI, Modified Barthel Index; Amp. ratio, amplitude of affected side/amplitude of unaffected side; AUC, area under the curve; B&B test, Box and Block test; NHPG, nine-hole peg test; Ambulation(3), >grade 3 ambulation on the MBI; Ambulation(4), >grade 4 ambulation on the MBI; Stair(3), >grade 3 stair climbing on the MBI; Stair(4), >grade 4 stair climbing on the MBI; FDI, first dorsal interosseous muscle; TA, tibialis anterior muscle.


 PDF
PDF ePub
ePub Citation
 Print
Print



 XML Download