Journal List > Ann Rehabil Med > v.39(1) > 1149896

Lee, Kim, Jeong, Kwon, and Jeong: Correlation of Foot Posture Index With Plantar Pressure and Radiographic Measurements in Pediatric Flatfoot

Abstract

Objective

To investigate the correlation between the Foot Posture Index (FPI) (including talar head palpation, curvature at the lateral malleoli, inversion/eversion of the calcaneus, talonavicular bulging, congruence of the medical longitudinal arch, and abduction/adduction of the forefoot on the rare foot), plantar pressure distribution, and pediatric flatfoot radiographic findings.

Methods

Nineteen children with flatfoot (age, 9.32±2.67 years) were included as the study group. Eight segments of plantar pressure were measured with the GaitView platform pressure pad and the FPI was measured in children. The four angles were measured on foot radiographs. We analyzed the correlation between the FPI, plantar pressure characteristics, and the radiographic angles in children with flatfoot.

Results

The ratio of hallux segment pressure and the second through fifth toe segment pressure was correlated with the FPI (r=0.385, p=0.017). The FPI was correlated with the lateral talo-first metatarsal angle (r=0.422, p=0.008) and calcaneal pitch (r=-0.411, p=0.01).

Conclusion

Our results show a correlation between the FPI and plantar pressure. The FPI and pediatric flatfoot radiography are useful tools to evaluate pediatric flatfoot.

INTRODUCTION

Flatfoot is defined as collapse or disappearance of the medial longitudinal foot arch [1] and is associated with several three-dimensional foot deformities. Almost 90% of clinic visits for pediatric foot problems in school-aged children are associated with flatfoot [2]. Although neurological, muscular, traumatic, or other conditions can also cause flatfoot [3], it is difficult to define the exact cause of flatfoot [4]. Flatfoot may occur as an isolated pathology or as part of a larger clinical syndrome or entity [5], such as ligamentous laxity, neurological and muscular abnormalities, or genetic conditions and syndromes [6]. Many studies have reported that the prevalence of flatfoot is 0.6%-77.9% [5]. This wide range in prevalence is related to different diagnostic criteria and associated pathology. However, the most likely cause for the difference in prevalence is age. The number of flatfoot cases decreases with age in young children [1]. All infants are born with flatfoot, and the longitudinal arch of the foot develops during the first decade [7], but the prevalence of flatfoot is 37%-59.7% in children 2-6 years of age and 4%-19.1% in those 8-13 years of age [5,7,8]. Pediatric flatfoot appears during the first years of life but persists in only 3% of the adult population [5]. The pediatric flatfoot patient may have different pressure distribution and radiographic patterns as a result of immature gait and incomplete ossification of the feet compared to those of adults [9].
The Foot Posture Index (FPI) is a validated method for quantifying standing foot posture when assessing adult and pediatric feet. It is a relatively simple and rapid method to determine foot posture [10,11] and has good reliability [12]. However, no study has evaluated the correlation between the FPI and other diagnostic measures in children with flatfoot. Thus, we analyzed the correlation between plantar pressure patterns of pediatric flatfoot and radiographic findings and determined whether the FPI represents pediatric flatfoot characteristics and whether it could be used as a simple clinical tool to quantify pediatric foot posture.

MATERIALS AND METHODS

Design and subjects

This study was designed as a retrospective single center study. We reviewed 63 children, who visited the foot clinic for an evaluation of flatfoot between 2009 and 2013, and 19 were recruited for the study. We obtained age, sex, body weight, height, underlying disease, and other information. The flatfoot diagnosis was carefully made using radiographic parameters, footprints, and other clinical symptoms and was also assessed by the FPI. The anthropometric data of the study group are listed in Table 1.

Exclusion criteria

The following exclusion criteria were applied to the subjects: 1) structural deformities, such as congenital vertical talus or joint pathology, 2) age <5 or >12 years, 3) cerebral palsy or other neurological and musculoskeletal disorders, 4) pain associated with gait, 5) poor cooperation during the plantar pressure measurements or physical examination, and 6) cannot walk independently.

Plantar pressure measurements

The plantar pressure measurement system used in this study was the GaitView AFA-50 (alFOOTs, Seoul, Korea). This system is a type of platform pressure pad. The platform sensor has a 410×410-mm area consisting of 2,304 (48×48 mm2) force-sensitive sensors. In previous studies, this system demonstrated good to moderate reliability [13]. The system was mounted on the floor at the center of a 3-m long walkway. We used the two-step method [14,15]. A brief training session on how to walk on the platform was given to the subjects before measurements, and each subject was asked to walk on the platform once or twice. Each patient started walking approximately two steps before the platform, contacted the platform on the second step, and continued walking. All measurements were supervised by a rehabilitation doctor, and inappropriate trials were excluded and repeated. Plantar pressure was measured more than three times in each subject, and the mean value was used for analysis. After data collection, GaitView Pro ver. 1.0 software (alFOOTs) was used to analyze the time-integral mean pressure expressed in kPa. The footprint was divided automatically into eight segments by the software. A manual check was also carried out to ensure that the anatomical structure fit the segments. The segments were the hallux (T1), the second through fifth toes (T25), first metatarsal (M1), second through fourth metatarsals (M24), fifth metatarsal (M5), mid-foot (MF), medial heel (MH), and lateral heel (LH) (Fig. 1).

Foot Posture Index

The FPI is a clinical tool that quantifies the degree to which a foot is pronated or supinated [10,16]. It is a relatively simple and rapid method with good reliability [12]. The FPI was evaluated in standing children using the original protocol with the six items shown below [11] (Fig. 2): 1) talar head palpation, 2) curvature at the lateral malleoli, 3) inversion/eversion of the calcaneus, 4) talonavicular bulging, 5) congruence of the medical longitudinal arch, and 6) abduction/adduction of the forefoot on the rare-foot
Each item was scored on a scale of -2, -1, 0, +1, +2 (0 for neutral, -2 for clear signs of supination, and +2 for clear signs of pronation), and all scores were summed (Table 2). The final score ranged from -12 to +12; a larger positive value indicates a more pronated foot.

Radiographic measurements

Simple standing anteroposterior and lateral radiographs of weight-bearing feet were obtained in a digitalized manner from each subject. We measured the four angles commonly used to assess flatfoot on the lateral radiograph, including 1) lateral talo-first metatarsal angle (Meary's angle), 2) talo-calcaneal angle, 3) metatarsal angle, and 4) calcaneal pitch (Fig. 3). All measurements were made using the standardized method described by Kim et al. [17] and were conducted using the digital radiographic viewer at our clinic with the Marosis M-view program (Marotech, Seoul, Korea).

Data processing and statistical analysis

We established a new variable based on the pressure values measured to easily assess the pressure distribution. Time-integral mean plantar pressure values from GaitView Pro ver. 1.0 are expressed in kPa and no consideration was given for subject weight. We created new variables of toe, metatarsal, and heel segments to compare the plantar pressure of the medial foot with that of the lateral.
In short, the new variables were obtained using the following formulae:
  • (1) T1/T25 ratio: hallux segment pressure/second through fifth toes segment pressure

  • (2) M1/M5 ratio: first metatarsal segment pressure/fifth metatarsal segment pressure

  • (3) MH/LH ratio: medial heel segment pressure/lateral heel segment pressure

These variables were used to determine the pressure ratio of medial feet to lateral feet; a larger value indicates a more medially weighted foot. Data were statistically analyzed using the Statistical Package for Social Sciences ver. 18.00 (SPSS Inc., Chicago, IL, USA). The correlations between plantar pressure distribution, FPI, and the pediatric flatfoot radiological measurements were explored by correlation analysis. Spearman correlation matrix was used to assess the correlations between the FPI and other variables. The correlations between the plantar pressure variables and radiographic measurements were assessed with Pearson correlation matrix. A p-value <0.05 and a correlation coefficient closer to 1 or -1 indicate a strong correlation, whereas a correlation coefficient closer to 0 indicates weak or no correlation. The data were double-entered, and the results were compared.

RESULTS

Subject characteristics

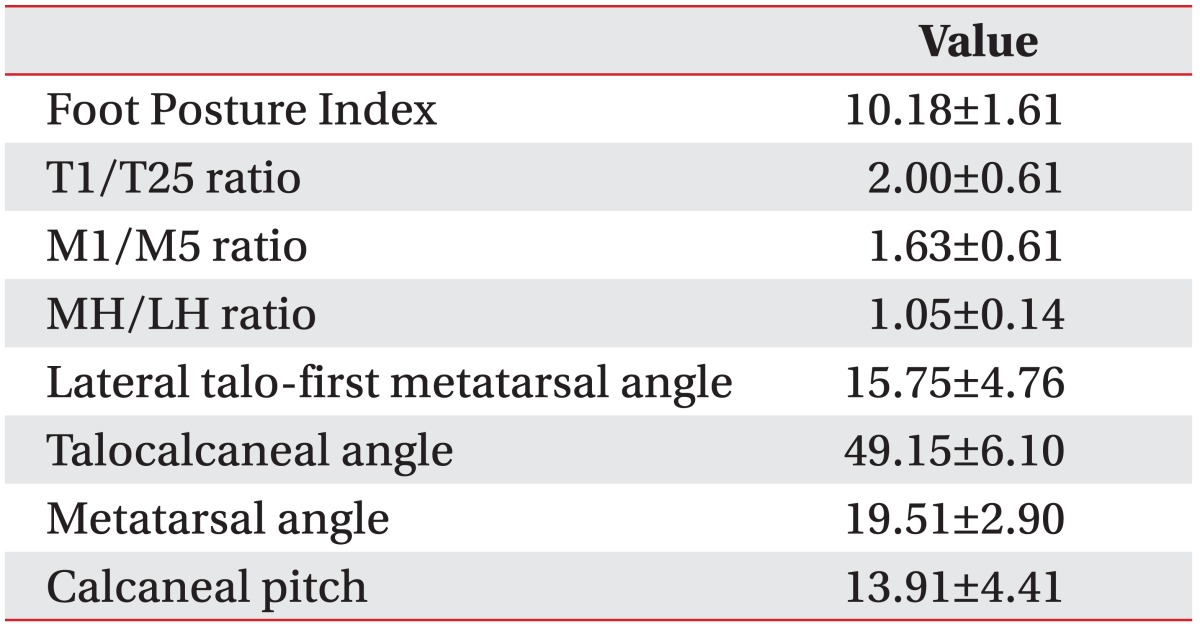
Nineteen children (10 males and 9 females) with 38 feet were included. The mean age of the children was 9.32± 2.67 years (range, 6-12 years), and mean weight was 31.95±7.89 kg. The mean FPI was 10.18±1.22. No mean differences in plantar pressure, radiographs, or the FPI were observed between right and left feet. The mean plantar pressure variable values, radiographic angles, and the FPI of the study group are listed in Table 3.

Correlation analysis

We performed a correlation analysis among each subject's T1/T25 ratio, M1/M5 ratio, MH/LH ratio, FPI, and four radiographic measurements. A significant correlation was observed between the FPI and the M1/M5 ratio (r=0.385, p=0.017). The FPI was correlated with lateral talo-first metatarsal angle (Meary's angle, r=0.422, p= 0.008) and calcaneal pitch (r=-0.411, p=0.01). No correlation was detected between the M1/M5 ratio and the radiographic measurements. The T1/T25 and MH/LH ratios were not correlated with any other variables. The results of the correlation analysis are shown in Table 4.

DISCUSSION

Many studies have evaluated the distribution of pressure in flatfeet. Some of these studies were conducted to confirm normal values [18], to evaluate foot function, or to evaluate treatment results [19,20]. Other studies have evaluated the characteristics of plantar pressure distribution [21,22] in patients with flatfoot or the correlations between plantar pressure and other clinical findings [23,24,25,26], but the subjects of these studies were mostly adults, and little is known about children. The studies targeting children did not exclude subjects with cerebral palsy or rigid foot deformities, which could affect gait pattern and foot posture [22,26]. Therefore, we excluded obstacles that could affect gait, foot posture, and plantar pressure distribution in this study.
Many assessment tools are used to evaluate flatfoot in clinics. However, the diagnostic accuracy of these tools is not well known due to the absence of a gold standard for diagnosing flatfoot. Instead, studies have assessed the correlations between each assessment tool. Sanchez-Rodriguez et al. [16] reported that the FPI predicts plantar pressure in 400 healthy adults. Coughlin and Kaz [23] published a correlation among the Harris mat, a physical examination, and Meary's angle in adults. Hatala et al. [24] reported a relationship between plantar pressure and footprint shape in adults. Kadhim et al. [26] found a correlation between radiographic and pressure measurements in subjects with cerebral palsy and a flatfoot deformity. Chen et al. [27] published a correlation between footprint and radiographic measurements in children. Our study evaluated correlations among the FPI, radiographic measurements and plantar pressure and determined whether the FPI represents the pediatric flatfoot characteristics and whether it could be used as a simple clinical tool to quantify pediatric foot posture. The results show that the M1/M5 ratio was positively correlated with the FPI (r=0.385, p=0.017), indicating that higher pressure in the medial metatarsal area resulted in a higher FPI score. We also confirmed a correlation between the FPI and the widely used Meary's angle and calcaneal pitch (FPI and Meary's angle: r=0.422, p=0.008; FPI and calcaneal pitch: r=-0.411, p=0.01).
Moon et al. [28] compared the distributions of plantar pressure in subjects with flatfoot to normal subjects and reported that flatfoot subjects characteristically showed higher dynamic plantar pressure in the midfoot and first, second, and third metatarsal areas. This may have been caused by a reduction in medial longitudinal arch. Higher pressure in these areas seems to be a characteristic feature of flatfoot, and the M1/M25 ratio was also correlated with the FPI in our study. Younger et al. [29] compared radiographic measurements in adults with flatfoot to those of controls. The talo-first metatarsal angle (Meary's angle), calcaneal angle, and medial cuneiform-fifth metatarsal height differed significantly in the lateral view between the flatfoot group and the controls. Lo at al. [30] also reported relatively high sensitivity and specificity of the talo-first metatarsal angle and calcaneal pitch in adults with flatfoot. Although there is a difference between adults and children, the talo-first metatarsal angle and calcaneal pitch well reflect the degree of flatfoot; therefore, this was the likely reason for the relatively higher correlation between talo-first metatarsal angle and calcaneal pitch in our study.
As shown above, the FPI is a useful clinical tool that represents pediatric flatfoot using plantar pressure measurements or radiographic findings. However, we did not find a correlation between plantar pressure and the radiographic measurements. Previous studies reporting a correlation between clinical findings and radiographs were performed on adults or children with cerebral palsy [26,27,31]. Kadhim et al. [26] reported that medial midfoot pressure is correlated with medial arch angle and Meary's angle. However, they targeted children with cerebral palsy, and their participants were older than ours. Chen at al. [27] reported a correlation between the subarch angle and Meary's angle, talo-horizontal angle, and arc height in children. However, our study design divided feet into eight segments and used a platform type pressure pad and a two-step method to assess the pressure distribution in children with flatfoot, which was different from other studies and could have resulted in the different outcome.
The limitation of our study was that we regarded each foot as an independent variable, according to previously published flatfoot studies, which have argued whether the kinematics of one foot affects the other. Our results may not represent the general characteristics of pediatric flatfoot due to the small sample size. However, this is the first study to reveal a correlation between the FPI and other assessment tools in children with flatfoot. The plantar pressure measurements or the FPI alone is insufficient to diagnose flatfoot, but we demonstrated a correlation between the FPI, radiographic measurements, and plantar pressure. Our results suggest that the FPI is a useful tool to evaluate pediatric flatfoot.

Notes

No potential conflict of interest relevant to this article was reported.

References

1. Chen KC, Tung LC, Yeh CJ, Yang JF, Kuo JF, Wang CH. Change in flatfoot of preschool-aged children: a 1-year follow-up study. Eur J Pediatr. 2013; 172:255–260. PMID: 23132641.
crossref
2. Fabry G. Clinical practice. Static, axial, and rotational deformities of the lower extremities in children. Eur J Pediatr. 2010; 169:529–534. PMID: 20052491.
3. Harris EJ, Vanore JV, Thomas JL, Kravitz SR, Mendelson SA, Mendicino RW, et al. Diagnosis and treatment of pediatric flatfoot. J Foot Ankle Surg. 2004; 43:341–373. PMID: 15605048.
crossref
4. Van Boerum DH, Sangeorzan BJ. Biomechanics and pathophysiology of flat foot. Foot Ankle Clin. 2003; 8:419–430. PMID: 14560896.
crossref
5. Halabchi F, Mazaheri R, Mirshahi M, Abbasian L. Pediatric flexible flatfoot; clinical aspects and algorithmic approach. Iran J Pediatr. 2013; 23:247–260. PMID: 23795246.
6. Roth S, Roth A, Jotanovic Z, Madarevic T. Navicular index for differentiation of flatfoot from normal foot. Int Orthop. 2013; 37:1107–1112. PMID: 23580031.
crossref
7. Pfeiffer M, Kotz R, Ledl T, Hauser G, Sluga M. Prevalence of flat foot in preschool-aged children. Pediatrics. 2006; 118:634–639. PMID: 16882817.
crossref
8. Evans AM, Rome K. A Cochrane review of the evidence for non-surgical interventions for flexible pediatric flat feet. Eur J Phys Rehabil Med. 2011; 47:69–89. PMID: 21448121.
9. Liu XC, Lyon R, Thometz JG, Curtin B, Tarima S, Tassone C. Insole-pressure distribution for normal children in different age groups. J Pediatr Orthop. 2011; 31:705–709. PMID: 21841449.
crossref
10. Redmond AC, Crosbie J, Ouvrier RA. Development and validation of a novel rating system for scoring standing foot posture: the Foot Posture Index. Clin Biomech (Bristol, Avon). 2006; 21:89–98.
crossref
11. Keenan AM, Redmond AC, Horton M, Conaghan PG, Tennant A. The Foot Posture Index: Rasch analysis of a novel, foot-specific outcome measure. Arch Phys Med Rehabil. 2007; 88:88–93. PMID: 17207681.
crossref
12. Morrison SC, Ferrari J. Inter-rater reliability of the Foot Posture Index (FPI-6) in the assessment of the paediatric foot. J Foot Ankle Res. 2009; 2:26. PMID: 19845961.
crossref
13. Kim YT, Lee JS. Normal pressures and reliability of the Gaitview® system in healthy adults. Prosthet Orthot Int. 2012; 36:159–164. PMID: 22282873.
crossref
14. Bryant A, Singer K, Tinley P. Comparison of the reliability of plantar pressure measurements using the two-step and midgait methods of data collection. Foot Ankle Int. 1999; 20:646–650. PMID: 10540996.
crossref
15. van der Leeden M, Dekker JH, Siemonsma PC, Lek-Westerhof SS, Steultjens MP. Reproducibility of plantar pressure measurements in patients with chronic arthritis: a comparison of one-step, two-step, and three-step protocols and an estimate of the number of measurements required. Foot Ankle Int. 2004; 25:739–744. PMID: 15566706.
crossref
16. Sanchez-Rodriguez R, Martinez-Nova A, Escamilla-Martinez E, Pedrera-Zamorano JD. Can the Foot Posture Index or their individual criteria predict dynamic plantar pressures? Gait Posture. 2012; 36:591–595. PMID: 22727718.
17. Kim SB, Yoon K, Park HS, Kwak H, Ha NJ, Park JS. Radiologic measurement of flatfoot. J Korean Acad Rehabil Med. 2000; 24:995–1001.
18. Maetzler M, Bochdansky T, Abboud RJ. Normal pressure values and repeatability of the Emed® ST2 system. Gait Posture. 2010; 32:391–394. PMID: 20663670.
crossref
19. Stolwijk NM, Louwerens JW, Nienhuis B, Duysens J, Keijsers NL. Plantar pressure with and without custom insoles in patients with common foot complaints. Foot Ankle Int. 2011; 32:57–65. PMID: 21288435.
crossref
20. Oeffinger DJ, Pectol RW Jr, Tylkowski CM. Foot pressure and radiographic outcome measures of lateral column lengthening for pes planovalgus deformity. Gait Posture. 2000; 12:189–195. PMID: 11154928.
crossref
21. Hennig EM, Staats A, Rosenbaum D. Plantar pressure distribution patterns of young school children in comparison to adults. Foot Ankle Int. 1994; 15:35–40. PMID: 7981794.
crossref
22. Pauk J, Daunoraviciene K, Ihnatouski M, Griskevicius J, Raso JV. Analysis of the plantar pressure distribution in children with foot deformities. Acta Bioeng Biomech. 2010; 12:29–34. PMID: 20653322.
23. Coughlin MJ, Kaz A. Correlation of Harris mats, physical exam, pictures, and radiographic measurements in adult flatfoot deformity. Foot Ankle Int. 2009; 30:604–612. PMID: 19589305.
crossref
24. Hatala KG, Dingwall HL, Wunderlich RE, Richmond BG. The relationship between plantar pressure and footprint shape. J Hum Evol. 2013; 65:21–28. PMID: 23725794.
crossref
25. Jonely H, Brismee JM, Sizer PS Jr, James CR. Relationships between clinical measures of static foot posture and plantar pressure during static standing and walking. Clin Biomech (Bristol, Avon). 2011; 26:873–879.
crossref
26. Kadhim M, Holmes L Jr, Miller F. Correlation of radiographic and pedobarograph measurements in planovalgus foot deformity. Gait Posture. 2012; 36:177–181. PMID: 22525421.
crossref
27. Chen CH, Huang MH, Chen TW, Weng MC, Lee CL, Wang GJ. The correlation between selected measurements from footprint and radiograph of flatfoot. Arch Phys Med Rehabil. 2006; 87:235–240. PMID: 16442978.
crossref
28. Moon JH, Lee HS, Jung KW, Park JH, Lee DS. Foot pressure distribution in normal subjects and patients with hallux valgus and pes planus. Ann Rehabil Med. 1996; 20:778–786.
29. Younger AS, Sawatzky B, Dryden P. Radiographic assessment of adult flatfoot. Foot Ankle Int. 2005; 26:820–825. PMID: 16221454.
crossref
30. Lo HC, Chu WC, Wu WK, Hsieh H, Chou CP, Sun SE, et al. Comparison of radiological measures for diagnosing flatfoot. Acta Radiol. 2012; 53:192–196. PMID: 22184677.
crossref
31. Yan GS, Yang Z, Lu M, Zhang JL, Zhu ZH, Guo Y. Relationship between symptoms and weight-bearing radiographic parameters of idiopathic flexible flatfoot in children. Chin Med J (Engl). 2013; 126:2029–2033. PMID: 23769552.
Fig. 1

The eight foot segments used by the GaitView program.

arm-39-10-g001
Fig. 2

The six items of the Foot Posture Index.

arm-39-10-g002
Fig. 3

The four angles measured on standing lateral foot radiographs.

arm-39-10-g003
Table 1

Characteristics of the participants

arm-39-10-i001

Values are presented as mean±standard deviation (range).

Table 2

Foot Posture Index scoring

arm-39-10-i002
Table 3

Mean values for the plantar pressure variables, radiographic angles, and the Foot Posture Index

arm-39-10-i003

Values are presented as mean±standard deviation (mean values of 38 feet from 19 children).

M1/M5 ratio, first metatarsal pressure/fifth metatarsal pressure; T1/T25 ratio, hallux pressure/second through fifth toes pressure; MH/LH ratio, medial heel pressure/lateral heel pressure.

Table 4

Correlation analysis results

arm-39-10-i004

Values are presented as correlation coefficient between the Foot Posture Index and other variables; Spearman correlation matrix, radiographic measurements and plantar pressure; Pearson correlation matrix.

M1/M5 ratio, first metatarsal pressure/fifth metatarsal pressure; T1/T25 ratio, hallux pressure/second through fifth toes pressure; MH/LH ratio, medial heel pressure/lateral heel pressure.

*p<0.05.

TOOLS
Similar articles