Abstract
Objective
To evaluate the clinical utility of the electrically calculated quantitative pain degree (QPD) and to correlate it with subjective assessments of pain degree including a visual analogue scale (VAS) and the McGill Pain Questionnaire (MPQ).
Methods
We recruited 25 patients with low back pain. Of them, 21 patients suffered from low back pain for more than 3 months. The QPD was calculated using the PainVision (PV, PS-2100; Nipro Co., Osaka, Japan). We applied electrodes to the medial forearm of the subjects and the electrical stimulus was amplified sequentially. Minimum perceived current (MPC) and pain equivalent current (PEC) were defined as minimum electrical stimulation that could be sensed by the subject and electrical stimulation that could trigger actual pain itself. To eliminate individual differences, we defined QPD as the following: QPD=PEC-MPC/MPC. We scored pre-treatment QPD three times at admission and post-treatment QPD once at discharge. The VAS, MPQ, and QPD were evaluated and correlations between the scales were analyzed.
Results
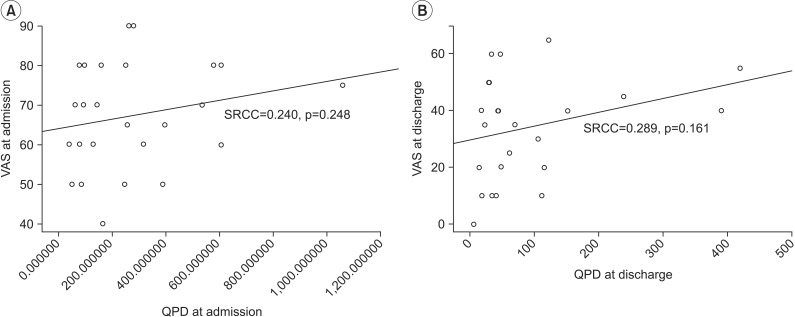
Result showed significant test-retest reliability (ICC=0.967, p<0.001) and the correlation between QDP and MPQ was significant (at admission SRCC=0.619 and p=0.001; at discharge SRCC=0.628, p=0.001). However, the correlation between QPD and VAS was not significant (at admission SRCC=0.240, p=0.248; at discharge SRCC=0.289, p=0.161).
Conclusion
Numerical values measured with PV showed consistent results with repeated calculations. Electrically measured QPD showed an excellent correlation with MPQ but not with VAS. These results demonstrate that PV is a significantly reliable device for quantifying the intensity of low back pain.
Pain, as a complex and subjective personal experience, is a major public health problem for which subjects seek the guidance of healthcare providers [1,2,3]. The American Pain Society and Joint Commission on Accreditation of Healthcare Organizations have designated pain as the 'fifth vital sign' in an effort to enhance awareness and the need for assessment [4]. Thus, understanding a patient's pain level may help rehabilitation clinicians in pain management and in determining the appropriate progression of rehabilitation. Various techniques have been developed to assess pain accurately. Many multidimensional measures are available, including the McGill Pain Questionnaire (MPQ) and Western Ontario and McMaster Universities Osteoarthritis Index. Alternatively, simpler single-item measures are available, such as a visual analogue scale (VAS) and a numeric rating scale (NRS), which are intended to measure particular qualities of pain, such as intensity or unpleasantness. Although there are several pain scales available to clinicians, the VAS and the MPQ are frequently used. The reliability and validity of the VAS and MPQ are well established [5,6,7,8]. These pain assessments rely on self-reported measures intended to quantify qualities of pain, such as intensity, sensory characteristics, affective responses, and coping [9]. However, the intensity of sensation is obviously highly subjective. Thus, it is difficult to quantitatively evaluate the degree of pain. Additionally, these pain scales are subjective evaluations by the patients themselves, so there is considerable individual variation in the evaluative criteria for pain and it is difficult to make comparison with other individuals.
From these perspectives, the PainVision (PV, PS-2100; Nipro Co., Osaka, Japan), a device capable of quantitatively assessing pain intensity by substituting pain with different sensory stimulation, has been developed and is used mainly in pain clinics [10,11,12,13]. In this method, heterogeneous perceptions and senses are aroused by electrical stimulation, and were substituted for pain as felt by a subject, and evaluated quantitatively. This method quantifies pain intensity by comparing the intensity of pain experienced as perception with the intensity of heterogeneous sensations that can be compared to pain. Ultimately, pain intensity is calculated as pain degree and the equation for calculating electrically calculated quantitative pain degree (QPD) will be explained below.
In this study, we investigated whether pain intensity can be assessed objectively with PV by a quantitative analysis of perception and pain sensation. Also, to investigate its clinical utility, we correlated QPD with subjective assessments of pain degree, including with a VAS and MPQ.
This study was approved by Hanyang University Hospital's Institutional Review Board and was performed between December 2011 and June 2012.
In total, 25 patients (10 males and 15 females; mean age 48.36±12.84 years) with low back pain caused by sprain and/or strain of the lumbar region, muscular pain syndrome, spinal stenosis, degenerative spondylosis, or lumbar radiculopathy were admitted at Hanyang University Hospital for treatment of low back pain and were included in the study. Patients with low back pain combined with sciatica were included. In these cases, low back pain itself was evaluated for assessing QPD, VAS, and MPQ. Subjects were excluded if they had a mentally disorder or unstable problems that made it impossible to understand concepts of VAS and MPQ, had any peripheral sensory neuropathy or musculoskeletal pain in the left medial forearm that could disrupt measuring QPD, and/or had polyneuropathy caused by any reason. Clinical diagnoses and neurophysiological confirmations were performed before treatment.
Of the patients, 20 suffered from low back pain for more than 3 months (Table 1). This study aimed to identify correlations between objectively assessed QPD and subjectively assessed VAS and QPD. Thus, we permitted any kind of treatment for the patients' conditions. The subject had not previously had discomfort in activities of daily living (mean duration of the hospital stay was 7.56±4.75 days), all subjects received comprehensive pain control, and a rehabilitation program. Of them, 17 patients received epidural nerve blocks.
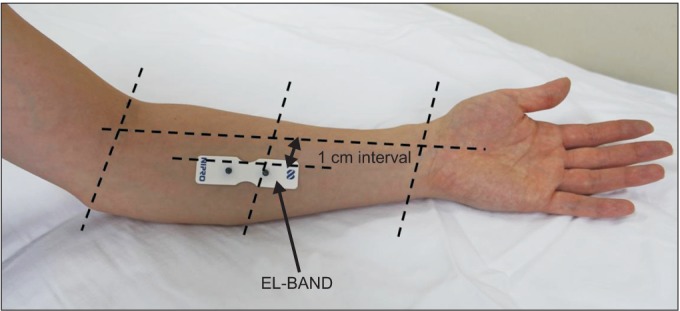
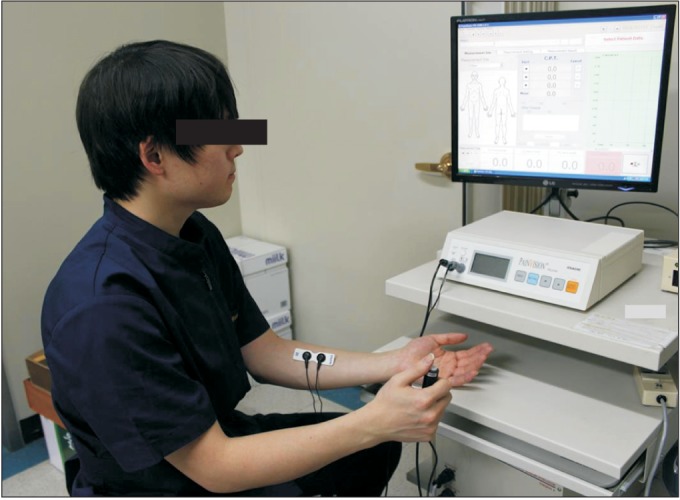
The PV system consists of the PV device, a hand switch, an electrode cable, and the EL-BAND. The EL-BAND that transmits electrical current was attached to the left medial forearm (Fig. 1) with application of electrode gel (contact resistance was about 10 kΩ). The medial forearm was selected for the EL-BAND attachment site because of the thin skin, flat surface, low distribution of sweat glands and hair follicles, and the resulting high sensitivity of electrical stimulation and good electrical conductance. It was also convenient for examiner access. The electrical stimulus amplified sequentially from low intensity current (50 Hz, 0-150 µA RMS, pulse width 0.4 ms). The pain signal travels from the periphery to the spinal cord along an Aβ-, Aδ-, or C-fibers. The myelinated Aδ-fiber carries its signal faster (5-30 m/s) than the unmyelinated C-fiber (0.5-2 m/s) [14]. Also, different frequencies of sine waveform stimuli selectively excite different subpopulations of nerve fibers, based on their different refractory periods [15]. In the frequency setting of the PV, the Aδ-fiber conducts the pain signal primarily. Thus, QPD can be calculated sensitively with less painful electrical stimulation. The subjects themselves compared the degree of sensation of electrical stimulus. We requested the subject to the press button on the hand switch at two moments (Fig. 2). The first was the time the subject perceived any subtle sensation at the EL-BAND attachment site. The second moment was the time that subject felt an equivalent degree of pain at the EL-BAND attachment site to the degree of low back pain itself. First, the current perception threshold (CPT), defined by the minimum electrical stimulation that could be sensed by the subject, was measured three times within a 5-minute interval and the mean value was used as the measurement. After current perception, the stimulating current produced by the device was increased until it could trigger pain. In sequence, the pain equivalent current (PEC), was defined by the electrical stimulation where the subject started to perceive the same strength as the ongoing low back pain. This was also measured three times within a 5-minute interval and the mean value was used as the measurement. To eliminate individual differences caused by various factors that can affect thresholds, such as contact with the EL-BAND, skin conditions, and sensory nerve distribution, we defined QPD as follows:
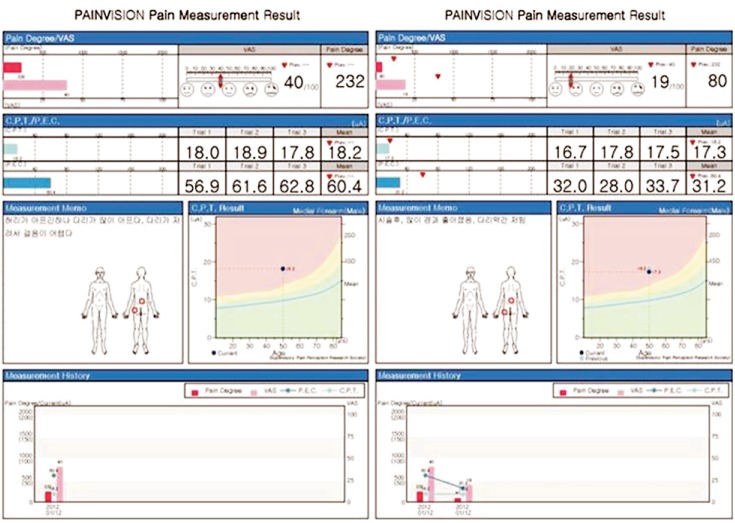
When there is no pain, the value is 0, and it increases according to the pain degree with no upper limit. Each measurement was simple and could be completed within a few minutes. The results were stored on the hard disk of a personal computer connected to the PV and recorded on a connected printer. Such numerical values were correlated with VAS and results were displayed on a monitor simultaneously. We evaluated QPD before treatment (at admission) and post treatment (at discharge). Serial changes in QPD were printed on the results print-out (Fig. 3).
The following subjective measures were also used for assessment : a VAS (range, 1-100 mm) and MPQ. We scored the pre-treatment QPD three times within a 5-minute interval at admission for evaluating internal consistency and the post-treatment MPQ once at discharge. Simultaneously with scoring MPQ, VAS was scored along the same lines.
We assessed the QPD score at admission three times to investigate the reliability of the device in terms of internal consistency. To determine test-retest reliability of QPD, intraclass correlation coefficients (ICC) were used. In sequence, we cross-correlated pain scales (VAS, MPQ, and QPD) at admission and discharge to investigate convergent validity by evaluating Spearman rank correlation coefficients (SRCC). Analyses were performed using the SPSS software ver. 11.0 for Windows (SPSS Inc., Chicago, IL, USA), and p-values≤0.5 were considered to indicate statistically significant differences.
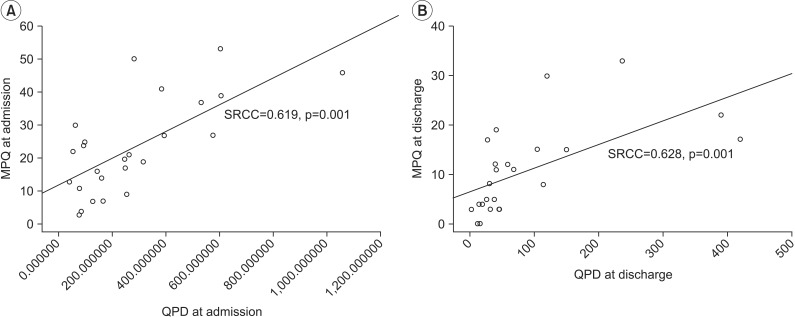
First, we assessed the reliability of PV by evaluating internal consistency of QPD. The results showed significant test-retest reliability (ICC=0.967, p<0.001). Correlation coefficients for the relationships among QPD, VAS, and MPQ were assessed. The results showed excellent positive correlations between QPD and MPQ (at admission SRCC=0.619, p=0.001; at discharge SRCC=0.628, p=0.001) (Fig. 4A, 4B). No correlation between QPD and VAS was found; it was statistically meaningless (at admission SRCC=0.240, p=0.248; at discharge SRCC=0.289, p=0.161) (Fig. 5A, 5B).
In this study we demonstrate a method that quantifies pain degree by comparing the intensity of pain and the intensity of a painless sensation with respect to painless stimulation. Current pain assessment methods include the VAS and MPQ, but both methods are subjective [5,17]. The VAS, a well-known unidimensional pain scale, was developed long ago. Because of its ease of use, the VAS became popular tool with which to quantitate pain relief and pain intensity. The VAS has been found to be a valid and reliable means of assessing pain, depression, anxiety, and mood [5].
Although popular for study purposes, unidimensional pain scales present certain problems. They were initially developed for use in experimental pain trials in which pain was limited and controlled. However, clinical pain is different in that it may become persistent, unbearable, and beyond the individual's control. It is also often associated with a strong emotional component not seen in an experimental setting [18].
The best known example of a multidimensional pain assessment is the MPQ [19]. Whereas unidimensional tools measure primarily the intensity of pain, multidimensional methods also take into account other factors that influence its perception. These include the quality and the temporal sequence of pain, the affective contributions, and the patient's belief system. Although this comprehensive approach is important, the use and interpretation of these tools are difficult because of their complexity [20]. Additionally, the length of time required to complete the evaluations usually makes them impractical in the clinical setting. In these patient-reported methods, the intensity of current pain is determined by comparing the reported pain level with a hypothetical 'pain of maximum intensity' value. However, because sensitivity to pain varies greatly among individuals, it is difficult to quantitatively compare measurements obtained by these methods. Moreover, the comparison of measurements for relatively weak pain is even less reliable.
The present study demonstrated a method that quantifies pain by comparing the intensity of pain with the intensity of a painless sensation. PV, the system for the quantitative analysis of perception and pain, has recently started to be used in pain clinics [11,12,13,21]. It gives patients an alternative painless sensory stimulation equivalent to pain, mainly by stimulating sensory nerve fibers -Aβ and Aδ-and measures the intensity of the stimulation. Because individual pain thresholds are evaluated first to provide accurate subsequent measurements with the device, pain intensity can be quantitatively compared among patients. This device has been used in studies on persistent chronic pain, such as herpes zoster-associated pain [12,13] and procedural pain, such as wound dressing removal [21]. In these studies, the reproducibility and validity of PV were confirmed.
To our knowledge, there is no previously reported study that investigated the quantitative measurement of low back pain using such electrical stimulation. We compared the responsiveness of the QPD with subjective pain measurements, such as the VAS and MPQ. QPD measured by PV showed consistent results with repeated determinations. These results demonstrate that PV is a reliable device. When we cross-correlated between QPD, VAS, and MPQ, electrically measured QPD showed excellent correlation with MPQ. However, against our expectations, the correlation between QPD and VAS was statistically meaningless.
VAS, as a unidimensional pain scale, tends to focus only on pain intensity, with an increased risk of oversimplification of the experience [22]. Furthermore, actual measurements are relative only to the individual being assessed. Identical stimuli applied to different individuals can yield markedly different scores. Thus, the numbers, although reproducible to a high degree for each individual, are simply estimates of the perception of the pain, based on past personal experience [5]. The use of unidimensional pain scales may be more appropriate in the setting of acute pain than chronic pain [22,23,24,25]. A failure rate of approximately 7% is seen in the adult population [5,22,26].
Chronic pain is usually also associated with other elements, such as degree of support and depression. The assessment of chronic pain often requires more complex evaluation tools [22]. MPQ, as a multidimensional pain scale, has shown good consistency and reliability in the evaluation acute pain as well as chronic pain [27,28]. It has also been translated into and validated in many other languages [29,30]. Although there has been some discussion between theorists and researchers, traditionally the distinction between acute and chronic pain has relied on an arbitrary interval of the time from onset; the two most commonly used markers are 3 and 6 months since the onset of pain [31]. In another study, the definition of chronic lower back pain was established by the persistence of pain beyond 3 months [32]. In our study, we recruited subject suffering from low back pain. Because we did not write the duration of low back pain into the inclusion criteria, both acute and chronic low back pain patients were mixed. However, patients who suffered from low back pain for more than 3 months represented a large proportion of the subjects.
Most low back pain does not have a clear cause [33]. Low back pain is believed to be the result of 'non-serious' muscle or skeletal issues, such as sprains or strains [34]. Additionally, obesity, smoking, weight gain during pregnancy, stress, poor physical condition, poor posture, and poor sleeping position may also contribute to low back pain [34]. Taken together, chronic low back pain is a complex medical problem. Also, considering the subject composition in our study, there may be limitations in assessing chronic low back pain using a VAS. As a result, the poor correlation between QPD and VAS and the significant correlation between QPD and VAS may be explainable.
Our results indicated favorable reproducibility of electrically measured QPD. Moreover, compared with conventional assessment methods, such as the MPQ, PV can be considered to be sensitive method, and it may enable objective quantitative assessments of complex pain situations, such as chronic low back pain.
This study has some limitations. First, the number of subjects was small. At the beginning of our study, we restricted subjects to those who had low back pain only. Later, we will include musculoskeletal pain, such as knee, shoulder and ankle pains, and it may be possible to expand the availability of electrically measured QPD. Second, we set the electrical stimulation frequency so as to conduct the 'pain' signal through the Aδ-fiber primarily. Thus, we did not evaluate pain intensity aroused through the C-fiber. Because of their higher conduction velocity, the Aδ-fibers are responsible for the sensation of quick, shallow pain that is specific to one area, termed 'first pain.' They also respond to a weaker intensity of stimulus. In contrast, C-fibers respond to stimuli that have stronger intensities and are the ones that account for the slow, but deeper and spread out over an unspecific area, 'second pain.' Given this background, evaluating pain intensity through stimulating Aδ-fibers was appropriate for our study evaluating low back pain. Also, the quantitative sensory testing (QST) has been used widely to test specific components of the nociceptive system, such as unmyelinated C-fibers [35]. Third, many patients diagnosed with lumbar radiculopathy complain of low back pain combined with sciatica. We requested patients to evaluate their low back pain alone. However, some patients could not separate low back pain and sciatica accurately. Thus, they may have evaluated low back pain and sciatica together. Fourth, acute pain patients and chronic pain patients were not segregated. Because the majority of subjects in this study had chronic low back pain, the correlation between QPD and MPQ only was confirmed. In another study that investigated the correlation between QPD and VAS in acute pain, a statistically meaningful correlation was established [21]. In future, we will subdivide subjects into acute and chronic pain groups, and not only examine the correlation between QPD and MPQ but also the correlation between QPD and VAS may be investigated.
In conclusions, the PV device was assessed with regard to the quantitative analysis of pain intensity. With this device and the frequency setting used, the Aδ-fibers were stimulated primarily. Thus, the electrically measured QPD can be calculated sensitively and less painfully. Because of the short measurement time, highly reproducible measurements, and excellent correlation with MPQ, the electrically measured QPD could provide an effective way of quantifying various kinds of pain.
ACKNOWLEDGMENTS
This study was supported by a Grant for Clinical Study 2011 from Hanyang University Hospital.
References
1. Elliott AM, Smith BH, Penny KI, Smith WC, Chambers WA. The epidemiology of chronic pain in the community. Lancet. 1999; 354:1248–1252. PMID: 10520633.

2. Verhaak PF, Kerssens JJ, Dekker J, Sorbi MJ, Bensing JM. Prevalence of chronic benign pain disorder among adults: a review of the literature. Pain. 1998; 77:231–239. PMID: 9808348.

3. Litcher-Kelly L, Martino SA, Broderick JE, Stone AA. A systematic review of measures used to assess chronic musculoskeletal pain in clinical and randomized controlled clinical trials. J Pain. 2007; 8:906–913. PMID: 17690014.

4. Gatchel RJ. Comorbidity of chronic pain and mental health disorders: the biopsychosocial perspective. Am Psychol. 2004; 59:795–805. PMID: 15554853.

5. McCormack HM, Horne DJ, Sheather S. Clinical applications of visual analogue scales: a critical review. Psychol Med. 1988; 18:1007–1019. PMID: 3078045.

6. Melzack R, Katz J. Pain measurement in persons in pain. In : Wall PD, Melzack R, editors. Textbook of pain. 4th ed. New York: Churchill Livingston;1999. p. 129–164.
8. Wewers ME, Lowe NK. A critical review of visual analogue scales in the measurement of clinical phenomena. Res Nurs Health. 1990; 13:227–236. PMID: 2197679.

10. Kato J. PainVision. Masui. 2011; 60:1059–1063. PMID: 21950038.
11. Fukada T, Iwakiri H, Ozaki M. A randomised double-blind crossover trial of the potential analgesic effect of a transdermal nicotine patch in non-smokers based on objective and subjective assessment. Eur J Anaesthesiol. 2011; 28:592–596. PMID: 21681103.

12. Kanai A, Horie T, Okamoto H. Change of the affected skin temperature in the sub-acute stage predicts the pain intensity and disability in patients with post-herpetic neuralgia. In : Proceedings of the American Society of Anesthesiologists (ASA) 2012 Annual Meeting; 2012 Oct 13-17; Washington, DC.
13. Maekawa N, Morimoto M, Morimoto M, Uchida T, Umeda T, Koga Y. Can we revaluate pain with PainVision, a device for quantitative analysis of perception and pain? A feasibility study of pain in herpes zoster patients. J Jpn Soc Clin Anesth. 2009; 29:824–828.
14. Collins WR Jr, Nulsen FE, Randt CT. Relation of peripheral nerve fiber size and sensation in man. Arch Neurol. 1960; 3:381–385. PMID: 13694775.

15. Lerner TH, Goldstein GR, Hittelman E. Quantitative sensory nerve conduction threshold (sNCT) evaluation of the trigeminal nerve at the mental foramen area. J Prosthet Dent. 2000; 84:103–107. PMID: 10898847.

16. Jensen MP, Karoly P, Braver S. The measurement of clinical pain intensity: a comparison of six methods. Pain. 1986; 27:117–126. PMID: 3785962.

17. Hicks CL, von Baeyer CL, Spafford PA, van Korlaar I, Goodenough B. The Faces Pain Scale-Revised: toward a common metric in pediatric pain measurement. Pain. 2001; 93:173–183. PMID: 11427329.
18. Ho K, Spence J, Murphy MF. Review of pain-measurement tools. Ann Emerg Med. 1996; 27:427–432. PMID: 8604852.

19. Melzack R. The McGill pain questionnaire: from description to measurement. Anesthesiology. 2005; 103:199–202. PMID: 15983473.
21. Matsumura H, Imai R, Gondo M, Watanabe K. Evaluation of pain intensity measurement during the removal of wound dressing material using 'the PainVision™ system' for quantitative analysis of perception and pain sensation in healthy subjects. Int Wound J. 2012; 9:451–455. PMID: 22264336.

22. Bonica JJ, Loeser JD, Chapman CR, Fordyce WE, Domenowske M. The management of pain. 2nd ed. Philadelphia: Lea & Febiger;1990.
23. Herr KA, Mobily PR. Comparison of selected pain assessment tools for use with the elderly. Appl Nurs Res. 1993; 6:39–46. PMID: 8439177.

24. Linton SJ, Gotestam KG. A clinical comparison of two pain scales: correlation, remembering chronic pain, and a measure of compliance. Pain. 1983; 17:57–65. PMID: 6226918.

25. Turk DC, Rudy TE, Sorkin BA. Neglected topics in chronic pain treatment outcome studies: determination of success. Pain. 1993; 53:3–16. PMID: 8316386.

26. Jensen MP, Karoly P, O'Riordan EF, Bland F Jr, Burns RS. The subjective experience of acute pain. An assessment of the utility of 10 indices. Clin J Pain. 1989; 5:153–159. PMID: 2520397.

27. Holroyd KA, Holm JE, Keefe FJ, Turner JA, Bradley LA, Murphy WD, et al. A multi-center evaluation of the McGill Pain Questionnaire: results from more than 1700 chronic pain patients. Pain. 1992; 48:301–311. PMID: 1534399.

28. Lowe NK, Walker SN, MacCallum RC. Confirming the theoretical structure of the McGill Pain Questionnaire in acute clinical pain. Pain. 1991; 46:53–60. PMID: 1896208.

29. Boureau F, Luu M, Doubrere JF. Comparative study of the validity of four French McGill Pain Questionnaire (MPQ) versions. Pain. 1992; 50:59–65. PMID: 1513604.

30. Strand LI, Wisnes AR. The development of a Norwegian pain questionnaire. Pain. 1991; 46:61–66. PMID: 1896209.

31. Debono DJ, Hoeksema LJ, Hobbs RD. Caring for patients with chronic pain: pearls and pitfalls. J Am Osteopath Assoc. 2013; 113:620–627. PMID: 23918913.

32. Rozenberg S. Chronic low back pain: definition and treatment. Rev Prat. 2008; 58:265–272. PMID: 18536200.
33. Patel AT, Ogle AA. Diagnosis and management of acute low back pain. Am Fam Physician. 2000; 61:1779–1786. 1789–1790. PMID: 10750882.
34. National Institute of Neurological Disorders and Stroke; National Institutes of Health. Low back pain fact sheet for patients and the public. J Pain Palliat Care Pharmacother. 2004; 18:95–110.
Fig. 4
Correlation between MPQ and QPD at admission (A) and at discharge (B). MPQ, McGill pain questionnaire; QPD, quantitative pain degree; SRCC, Spearman rank correlation coefficient.


 PDF
PDF ePub
ePub Citation
 Print
Print



 XML Download