

 PDF
PDF ePub
ePub Citation
 Print
Print


INTRODUCTION
Cerebral palsy is a disease that needs continuous physical therapy due to delay and abnormality of motor development, and the motor development assessment for children with cerebral palsy is very important for identifying their functions and establishing treatment goals and plans. The Gross Motor Function Measure (GMFM), one of the motor development measuring tools for children, has been widely used for evaluating motor functions of children with cerebral palsy ever since it was devised by Russell et al. [1] in 1989.
Researches for factors which influence the present gross motor function of children with cerebral palsy have been conducted long ago. Ibrahim and Hawamdeh [2] reported that orofacial dysfunction, duration of disease, distribution of paralysis, degree of spasticity, and current weight are independent predictors of GMFM. Venkateswaran and Shevell [3] reported that there is a significant association between GMFCS IV-V and dysphagia (in case of feeding via nasogastric tube or gastrostomy tube), after having analyzed relations between 4 associated impairments of children with spastic quadriplegic cerebral palsy, which are visual impairment, hearing problem, dysphagia, and seizure, with relative factors, such as gender, gestational age, microcephaly, presence of periventricular leukomalacia, neonatal asphyxia, and Gross Motor Function Classification System (GMFCS) [4]. And Palisano et al. [5] targeted 586 children aged 1 to 12 with cerebral palsy and reported that the Pearson correlation coefficient between GMFCS and GMFM is -0.91 (p<0.0001), indicating that as the GMFCS level gets higher, the GMFM value gets lower. Hidecker et al. [6] targeted 222 children aged 2 to 17 with cerebral palsy, and reported that there is a moderate correlation between Communication Function Classification System (CFCS) [7] and GMFCS. And Ross and Engsberg [8] targeted 97 children with spastic cerebral palsy and reported that there is no statistically significant association between GMFM-66 and spasticity of lower extremities.
However, most of these studies analyzed factors which are only related to the current gross motor function of subjects, and thus, few of them examined those that influence improvements of the gross motor function through physical therapy. As far as the authors know, only Gorter et al. [9] had conducted an analysis on the correlation between the changes of GMFM-66 and spasticity, and as a result, they reported that the changes of GMFM-66 associated spasticity with a small strength, but their research was limited because they only targeted below 2 years of age and did not analyze effects of other variables except for spasticity.
Therefore, the authors assumed that the periodic evaluation of the GMFM would help confirm the changes of gross motor function and treatment effects. In this study, we investigated the improvements of the gross motor function on children with spastic cerebral palsy through physical therapy by using GMFM-88, predicted the treatment outcomes through analyzing factors which influenced those improvements, and ultimately tried to help establish treatment plans.
Go to : 
MATERIALS AND METHODS
Subjects
This study retrospectively reviewed the medical records of 101 children with spastic cerebral palsy who had been admitted to the Department of Rehabilitation Medicine in our hospital from May 2008 to July 2012.
Among them, 45 children were selected as subjects excluding those who received the botulinum toxin injection, operation or other procedures within 6 months before admission or during admission, those with GMFM being omitted at the time of discharge, and those who were below 2 and over 7 years of age.
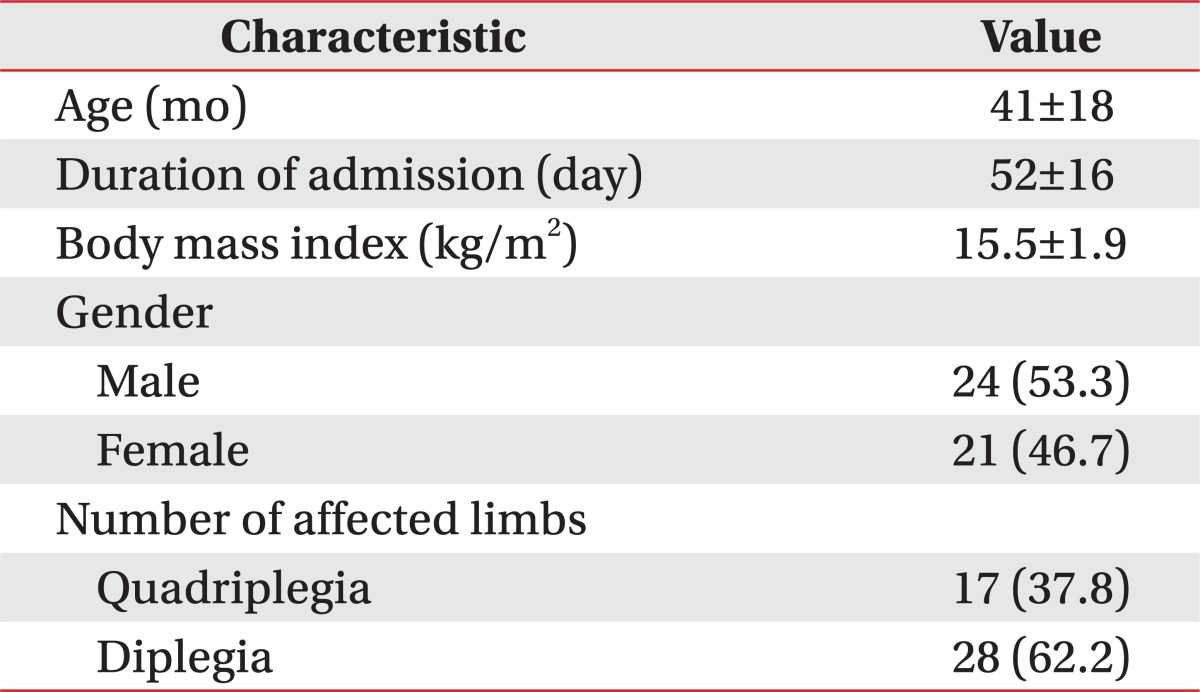
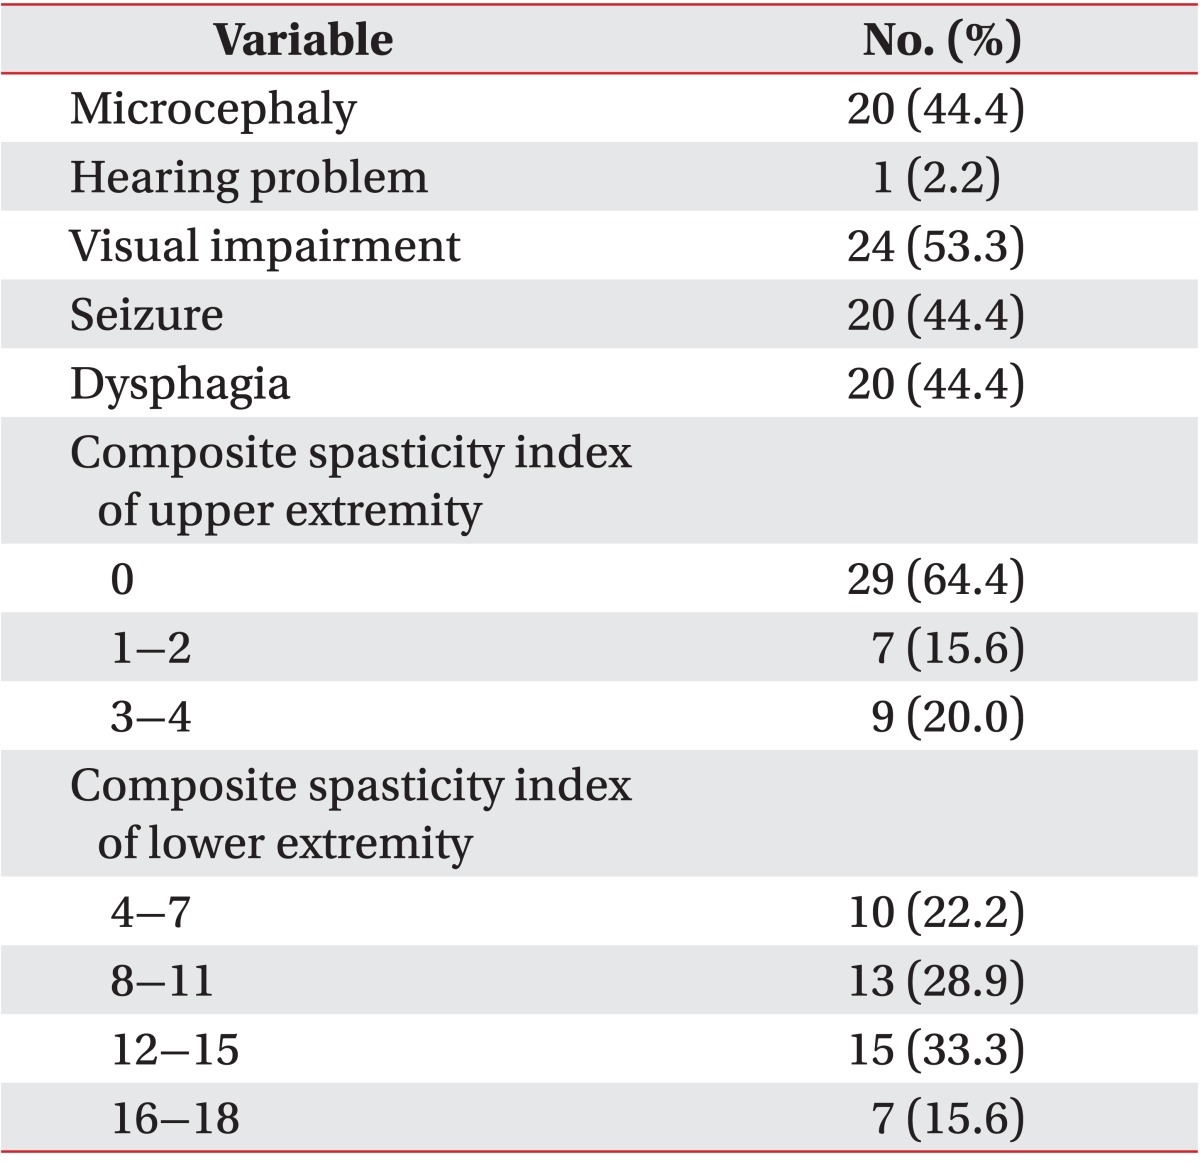
Cerebral palsy was diagnosed by integrating the motor development history of the subjects, presence of primitive reflexes, muscle tone, postures, and movement pattern on physical examination [10]. The subjects consisted of 24 males (53.3%) and 21 females (46.7%), and the age of the subjects ranged from 2 to 6 years, with the mean age being 41±18 months (Table 1).
Methods
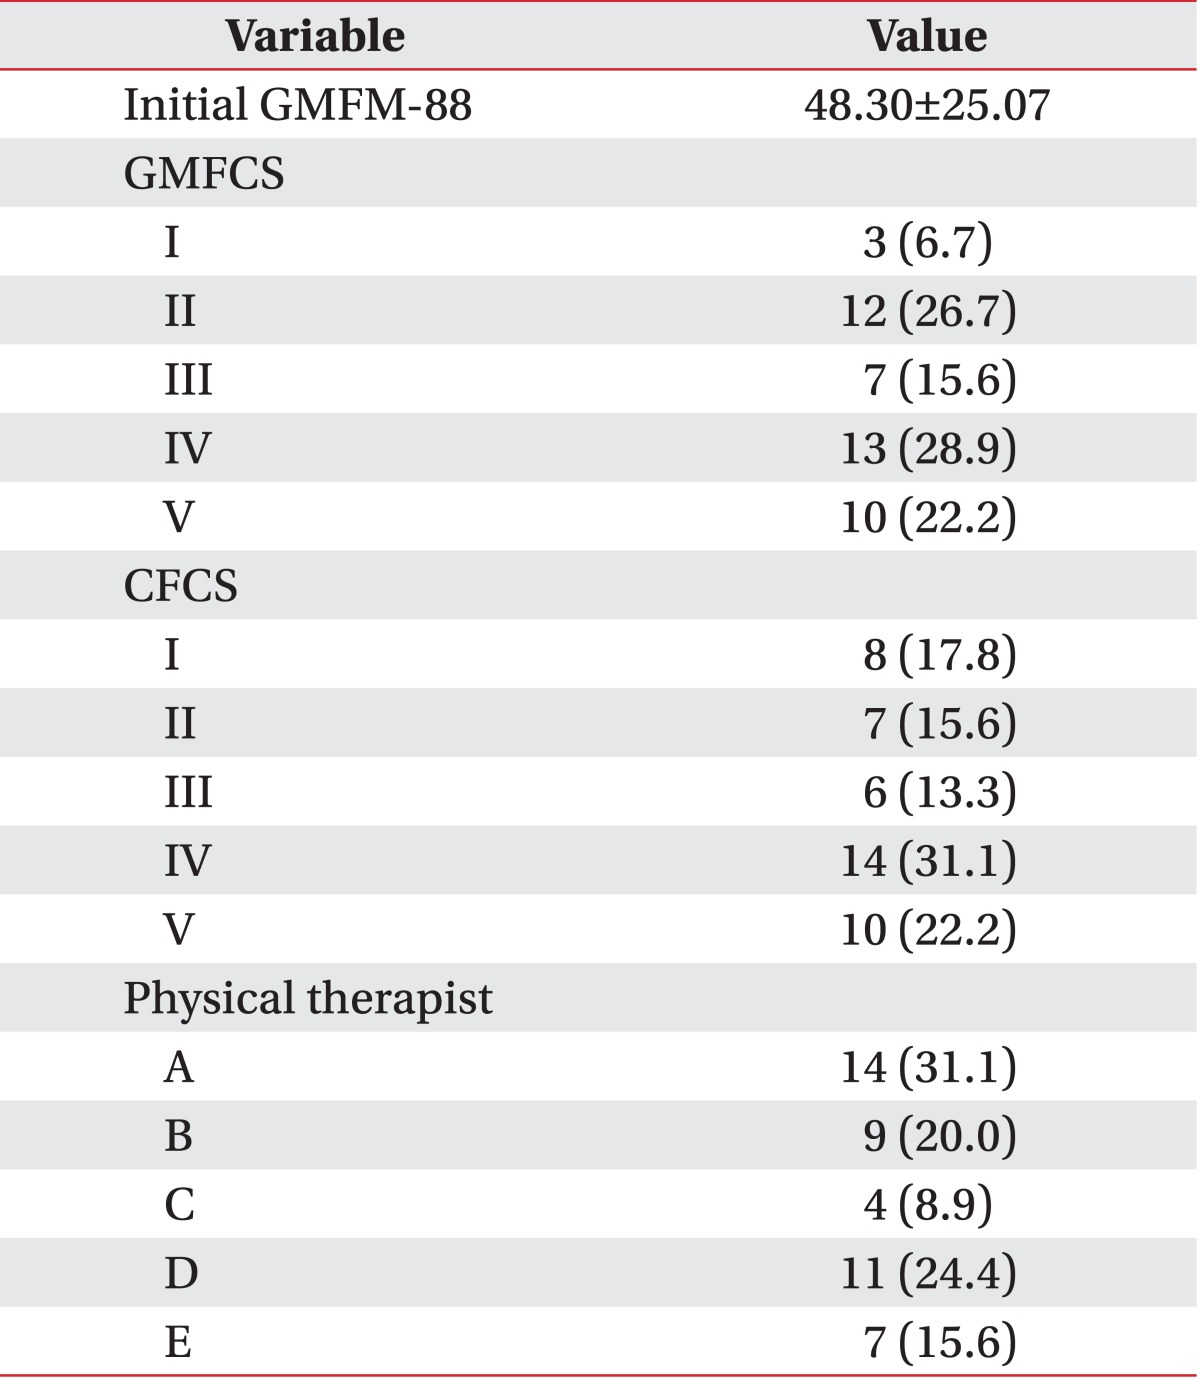
This study was conducted by reviewing the medical records retrospectively and was approved by the Institutional Review Board of our hospital. The GMFM-88 was evaluated by trained physical therapists specialized in children and used translated GMFM-88 evaluation sheets [11]. For each item, the physical therapists directed the subjects by demonstrating themselves and allowing them to follow, and then evaluated their performances. The mean duration of admission was 52±16 days, and the subjects received physical therapy from one physical therapist for 40 minutes, 2 times a day, for 5 days a week. Each of them received the GMFM-88 evaluation from the same physical therapist at the time of both admission and discharge, and improvements of the gross motor function were examined by calculating the difference between the GMFM-88 scores obtained at the time of admission and that gained at the time of discharge. The total number of the physical therapists who took charge of treating the subjects was 5, and they all had experiences of more than 2 years. The GMFCS [4] consists of 5 levels, from I to V, depending on the child's present abilities and limitations in motor function, and they were classified based on assessments of pediatric physiatrist. The CFCS [7], a commonly used tool to evaluate communication skills of patients with cerebral palsy, is also made up of 5 levels, from I to V, according to how effective they communicate with familiar or unfamiliar partners, and they were classified by pediatric physiatrist based on interviews with caregivers or evaluations from speech therapist.
Spasticity was measured on each upper extremity and lower extremity by using the composite spasticity index [12]. The Modified Ashworth Scale for spasticity is scored 0-4 with a 1+ grade, but for composite spasticity index, the scores were adjusted to give a 0-5 score range (1+ became 2, 2 became 3, and so on). For upper extremities, composite spasticity indexes of both elbow flexors were added together, which were distributed between scores 0 and 4, and they were classified into 3 groups with scores of 0 for no spasticity, with scores of 1 or 2 for minor spasticity, and with scores of 3 or 4 for moderate spasticity. For lower extremities, composite spasticity indexes of both hip adductors, knee flexors, and ankle plantar flexors were all added together [8], which were distributed between 4 and 18, and they were classified into 4 groups with scores of 4-7, 8-11, 12-15, and 16-18.
Microcephaly, hearing problem, visual impairment, seizure, and dysphagia, which are all commonly accompanied by cerebral palsy [3], were examined. Microcephaly was defined as an orbitofrontal circumference less than the 3rd percentile for corrected age and gender, which were taken from midway between the eyebrows and the hairline at the front of the head, and from around the occipital prominence at the back of the head [2,3]. Hearing problem was defined as the abnormality of auditory evoked potential, need for hearing aid, or hearing loss [3,13]. And visual impairment included both minor abnormality, such as strabismus, refractory error, amblyopia, or nystagmus, and severe abnormality, such as cortical blindness or optic atrophy, all of which are commonly associated with cerebral palsy [3]. Seizures included neonatal seizure and after neonatal seizure regardless of controlling with medication [3], and dysphagia included cases of children fed via tubes, although they could be fed orally, the duration of feeding exceeded 40 minutes, and they had oromotor dysfunction, drooling, or coughing response while eating [3,14,15].
Other than those, the initial GMFM-88 was selected as a variable to look into the effects of initial gross motor function for overall improvements after intensive physical therapy. The effects of physical developments were analyzed with age and body mass index (BMI), and in order to analyze the effects of the number of affected limbs, we separated them into quadriplegia group and diplegia group. And in order to analyze the differences of therapy progressions depending on the physical therapists, it was included in the variables. The distributions of the subjects based on these variables are shown in Tables 1-3.
Data analysis
For a statistical analysis, a regression model for changes of GMFM-88, a dependent variable, was established by using independent variables including age, duration of admission, BMI, microcephaly, hearing problem, visual impairment, seizure, dysphagia, gender, the number of affected limbs, GMFCS, initial GMFM-88, CFCS, composite spasticity index of upper extremity, composite spasticity index of lower extremity, and physical therapists. In addition, variable selection was conducted to raise the forecasting power of the model and statistically sort out important variables. Because there were too many independent variables and categorical variables, the typical forward selection, backward selection, or step-wise selection could not work effectively. In order to overcome this problem, the variable selection was conducted through group Lasso, and Bayesian information criterion (BIC) was used for the selection criterion [16,17]. For statistical reasoning, a linear regression model based on the ordinary least square (OLS) method was estimated by using the variables selected from group Lasso, and because the duration of admission among the variables are generally considered as to have a positive correlation with changes of GMFM-88, the one-tailed test was conducted by excluding the possibility of any negative correlations, and the two-tailed test was performed on the remaining variables. The statistical significance level was set at p<0.05. All analysis were performed by using the statistical package R (ver. 2.15.2, The R Foundation for Statistical Computing).
Go to :
RESULTS
The 45 children with spastic cerebral palsy aged 2-6 showed an average of 7.17±3.10 (range, 1.71 to 15.20) improvements of the GMFM-88 after 52±16 days (range, 11 to 91 days) of physical therapy.
On the variable selection through group Lasso, the duration of admission, initial GMFM-88, squared value of the initial GMFM-88, microcephaly, dysphagia, the number of affected limbs, composite spasticity index of upper extremity, composite spasticity index of lower extremity, and physical therapists were selected as variables which influence the changes of GMFM-88.
Relations between the changes of GMFM-88 and general characteristics of the subjects
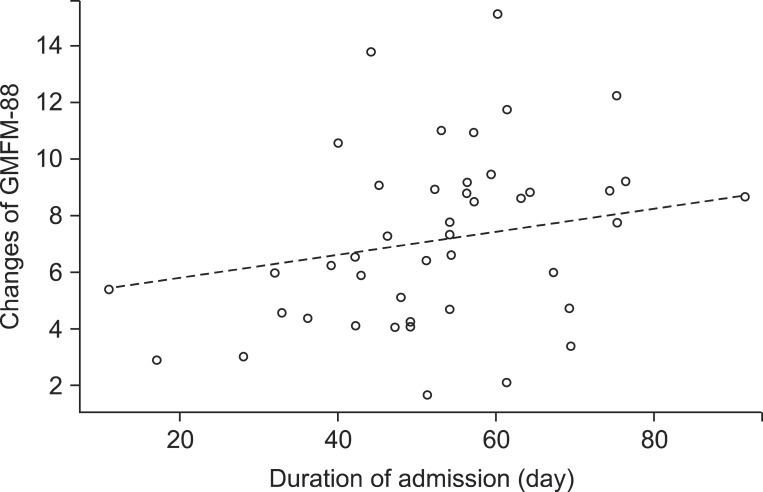
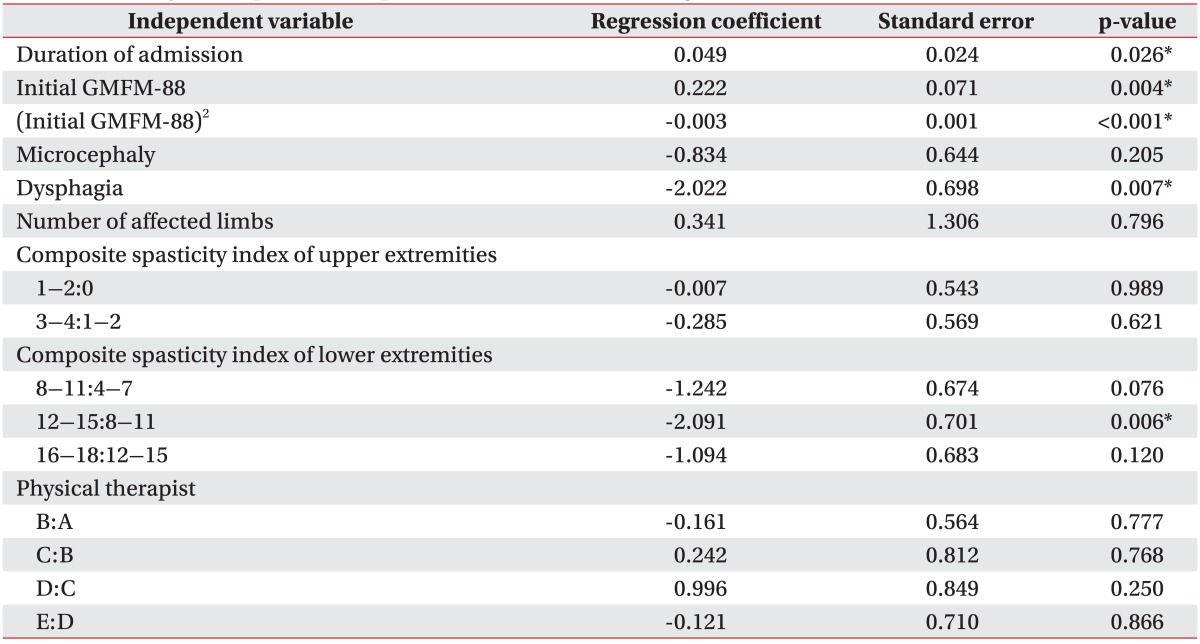
A regression coefficient of the duration of admission was 0.049, which indicates that as the duration of admission increases per day, the GMFM-88 increases by 0.049 (Table 4, Fig. 1). Although the number of affected limbs was selected as a variable which influences the changes of GMFM-88, the OLS regression coefficient was not statistically significant (Table 4). Besides, age, BMI, and gender were not selected as variables which influence the changes of GMFM-88.
Relations between the changes of GMFM-88 and associated impairments and spasticity of the subjects
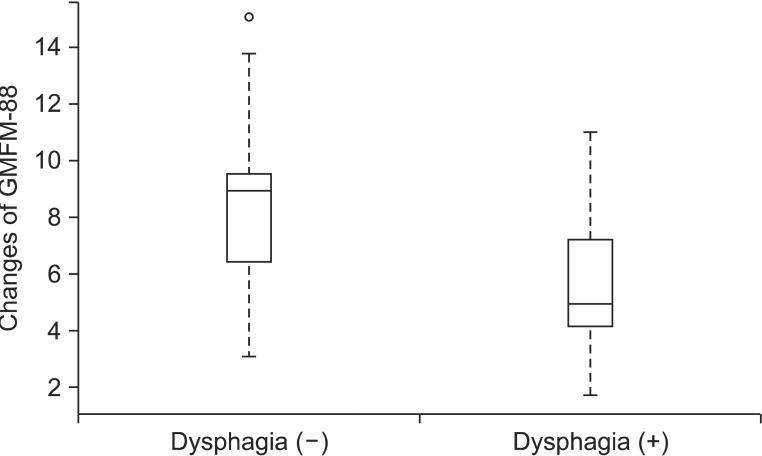
A regression coefficient of dysphagia among associated impairments was -2.022, which reveals that when other variables selected from group Lasso are equal, the change of GMFM-88 is 2.022 smaller on average in a group with dysphagia than those without dysphagia (Table 4, Fig. 2). And the regression coefficient of microcephaly was -0.834, and thereby, we could expect that the increase of GMFM-88 of a child with microcephaly would be 0.834 smaller than that of a child without microcephaly, but it was not statistically significant (Table 4). Other than those, the hearing problem, visual impairment, and seizure were not selected as variables which influence the changes of GMFM-88.
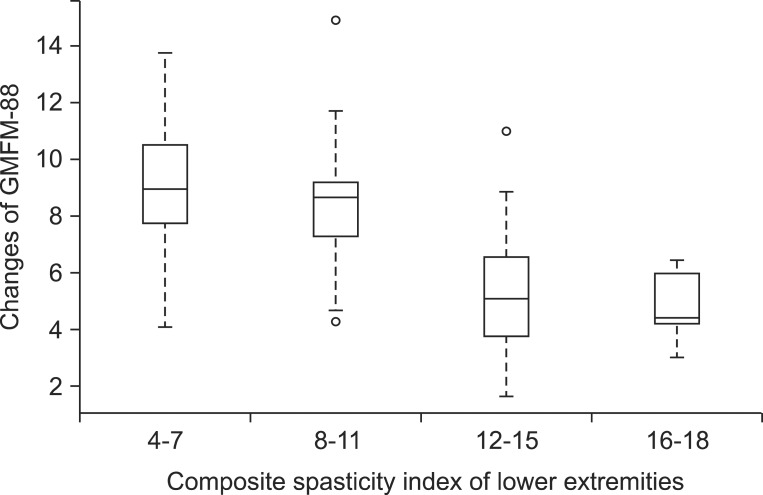
A regression coefficient of composite spasticity index of upper extremity 1-2 group to 0 group was -0.007, and 3-4 group to 1-2 group was -0.285, and thereby, we could expect that as the composite spasticity index of upper extremity gets higher, the improvements of the GMFM-88 lowers, but it was not statistically significant. In addition, when grouping the composite spasticity index of lower extremity and arranging them in ascending order, there was no significant difference between 4-7 group and 8-11 group on the first 2 levels, and there was also no significant difference between 12-15 group and 16-18 group on the last 2 levels. However, the regression coefficient of the 12-15 group to 8-11 group on the middle 2 levels was -2.091, and it was statistically significant, which indicates that when other conditions remain equal, the change of GMFM-88 for 12-15 group is 2.091 smaller than that of 8-11 group (Table 4, Fig. 3).
Relations between the changes of GMFM-88 and the initial GMFM-88, GMFCS, CFCS, and physical therapists
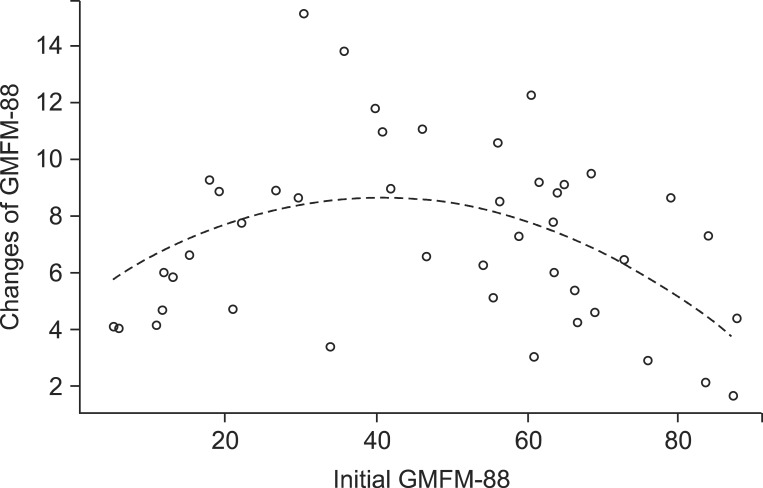
A regression coefficient of the initial GMFM-88 was 0.222, and that of the squared value of the initial GMFM-88 was -0.003, which indicates that when other variables selected from the group Lasso are equal, as the initial GMFM-88 lowers or raises, the changes of GMFM-88 diminishes as compared to middle-ranged initial GMFM-88 (Table 4, Fig. 4). The GMFCS and CFCS which are variables related to the function had no significant effect on the changes of GMFM-88, and there were also no significant difference for the changes of GMFM-88 according to physical therapists (Table 4).
Go to :
DISCUSSION
In this study, the changes of GMFM-88 for children with spastic cerebral palsy ranged from 1.71 to 15.20, showing improvements of 7.17±3.10 on average, and there was no subject with reduced GMFM-88. Duration of admission, initial GMFM-88 and squared value of the initial GMFM-88, presence of dysphagia, and degree of lower extremity spasticity turned out to be factors that have statistically significant effects on improvements of GMFM-88 that represents the gross motor function of children with cerebral palsy through physical therapy.
The authors thought that the GMFM-88 which represents motor function of cerebral palsy would be related with the physical status, duration of therapy, and associated impairments. As a result of analyzing those variables, physical status, such as gender, age, or BMI did not affect to the changes of GMFM-88. As the duration of admission increases per day, the GMFM-88 increases by 0.049 (p=0.026), and thereby, it could be expected that continuous physical therapy would increase the GMFM-88 (Table 4). One follow-up study of 8 months showed that the GMFM increases in all 3 groups of quadriplegia, diplegia, and hemiplegia [18]. Similar to this result, our study showed increased GMFM-88 in all 2 groups of spastic diplegia and quadriplegia. And, as compared to quadriplegia, the diplegia group showed more increases in GMFM-88 by 0.341, but it was not statistically significant (p=0.796) (Table 4). A previous study reported that orofacial dysfunction, duration of disease, distribution of paralysis, degree of spasticity, and current weight are related with GMFM [2]. And in this study, the subject with dysphagia, corresponding to the orofacial dysfunction, showed less improvements of GMFM-88 than those without dysphasia (regression coefficient=-2.022, p=0.007) (Table 4), which indicates that dysphagia influences not only the present gross motor function but also the improvements of the gross motor function through physical therapy. Especially, Venkateswaran and Shevell [3] reported that the odds ratio of dysphagia in GMFCS level IV and V is 8.1. And this indicates that the prevalence of dysphagia in the GMFCS IV to V group is 8.1 times higher than those of the GMFCS I to III group, which corresponds to the result of our study that the dysphagia group showed less changes of GMFM-88. Similar to previous study which reported that the hearing problem, visual impairment and seizure are not related with motor disorders in cerebral palsy [3], in this study, hearing problem, visual impairment, and seizure had no significant effect on improvements of GMFM-88 after physical therapy. However, because only one subject had hearing problem in this study, it is difficult to generalize such results.
One study reported that spasticity of hip extensor, flexor, abductor, knee flexor, and extensor has a low to fair correlations with GMFM [19]. But, because it only targeted ambulatory cerebral palsy, the effects of spasticity on GMFM with non-ambulatory cerebral palsy could not be examined. In this study, by showing that the degree of lower extremity spasticity influences the changes of total GMFM-88, not differentiating the ability of walking, found that lower extremity spasticity can influence improvements for lying, rolling, sitting, crawling, kneeling, and standing as well as walking. We separated subjects into 2 groups with more spasticity and less spasticity based on the composite spasticity index of lower extremity 12, and found that the improvements of GMFM-88 through physical therapy for those 2 groups have statistically significant differences. And, another study reported that spasticity of hip adductor, knee flexor, and ankle plantar flexor is related to the changes of GMFM-66 with small strength [9], which supports the result of this study that as the lower extremity spasticity worsen, the improvements of GMFM-88 lowers.
And, the authors considered that the improvements of gross motor function after physical therapy would vary with the initial GMFM-88, and after analyzing it, the squared value of the initial GMFM-88 turned out to have a negative correlation with changes of GMFM-88 (regression coefficient=-0.003, p<0.001), thus, indicating that when initial GMFM-88 is in the middle range, the changes of GMFM-88 are larger (Table 4). Perhaps, this is because if the initial GMFM-88 is very low, the improvement of the motor function through physical therapy is limited, and if the initial GMFM-88 is very high, the motor function is already at high levels. Harries et al. [20] conducted a follow-up study for each GMFCS group targeting 106 children with cerebral palsy and reported that GMFM-88 increased in all groups, and the changes of GMFM-88 were largest in the GMFCS III group, it would be more efficient to treat cerebral palsy with moderate impairments for longer periods. With intention to support these results, we also investigated the correlations between GMFCS and the changes of GMFM-88, but no statistically significant correlation was found. As from the described results above, children with middle range of the initial GMFM-88 more improved motor function after intensive physical therapy; this was similar to that of a previous study that GMFM-88 improved more in the GMFCS III group. But the reason why the correlation between GMFCS and the changes of GMFM-88 was not statistically significant in this study is presumed that the small numbers of 45 subjects were classified into 5 groups, from GMFCS I to V, each group was made up from small numbers of subjects such as 6 to 14, and thereby, it is necessary to conduct further studies to target large numbers of subjects. Additionally, because this study targeted young children on their growth process, such process could affect the changes of gross motor function. Therefore, an additional research on the improvements of gross motor function according to whether the subjects are on the upslope gradient or plateau of their gross motor function will be helpful.
And while a study of Hidecker et al. [6] targeting 222 children with cerebral palsy aged 2 to 17 reported that there is a moderate correlation between CFCS and GMFCS (rs=0.47, p<0.001), in this study, the changes of GMFM-88 according to the CFCS turned out to have no difference. This is presumably because learning effects through communication were limited due to younger ages of subjects in this study, from ages 2 to 6, as compared to those in the previous study. In a similar context, a study reported that 40% of cerebral palsy is accompanied by cognitive impairment, and the learning disability is milder in children with hemiplegia or diplegia than other types of cerebral palsy [13]. Therefore, we thought that the degree of accepting treatments depending on the learning ability could influence the changes of GMFM-88, but this analysis could not be performed because the subjects in this study were too young and it was difficult to evaluate cognitive function by quantifying them. And because there was a study which argued that 39.7% of cerebral palsy is associated with visual perception disorder [21]; there is the possibility that visual perception disorder among the visual impairments could affect the changes of GMFM-88 of children with cerebral palsy, but this study has limitations due to the exclusion of the visual perception evaluations, thus, it should be performed in the future. And a correlation between malnutrition due to dysphagia and the changes of GMFM-88 could not be analyzed due to omissions of serum albumin levels that represent nutritive conditions.
Both the GMFM-66 and GMFM-88 significantly reflect improvement of gross motor function through physical therapy, and one study reports that GMFM-66 has higher specificity than GMFM-88 because GMFM-66 evaluates performance probabilities depend on the levels of difficulty [22]. Thus, studies using GMFM-66 will be more helpful in the future. And, because the GMFM has limitation for reflecting qualitative changes of gross motor function, it should be complemented afterwards. This study targeted subjects in only one medical center, and thereby, the sample size was small, future studies targeting more subjects from more centers should be conducted in order to generalize better results.
Despite these limitations, this study has value in that it dealt with only homogeneous group, consisting of children with spastic cerebral palsy, thereby, it could reduce bias results from the heterogeneous types of cerebral palsy. In addition, it confirmed that the improvements of GMFM-88 through averagely 52±16 days of intensive physical therapy is 7.17±3.10 and deduced factors which influence the improvements of gross motor function. Moreover, it has a merit that enables more accurate statistical analyses by controlling various confounding factors which could not be controlled with typical statistical methods, and obtained the OLS estimator through variable selection processes by using BIC with the group Lasso method.
In conclusion, this study targeted 45 children with spastic cerebral palsy aged 2 to 6, the mean improvement of GMFM-88 is 7.17 after 52 days of physical therapy through admission. The improvement of gross motor function through intensive physical therapy gets higher if the duration of admission is longer, the initial GMFM-88 is in the middle range, there is no dysphagia, and spasticity of lower extremities is not severe. Thus, the improvement of gross motor function through physical therapy may be expected through accurate evaluations of physical conditions, associated impairments, and their function at the time of admission.
Go to :
 XML Download