

 PDF
PDF ePub
ePub Citation
 Print
Print


INTRODUCTION
With the increase in the population of sports activities, the prevalence of tendon injury is on the rise. The Achilles tendon in particular is one of the most frequently affected area [1]. The Achilles tendon receives excessive strain from repeated strenuous activities such as running, jumping, and landing, which can cause structural changes and biomechanical weakening of the tendon, and eventually can lead to rupture [2].
The rehabilitation process begins immediately after injury, thus the therapist is required to have an accurate knowledge of the pathogenesis and of performing adequate and early treatment [3]. In the case of Achilles tendon rupture, both surgical and conservative therapies should be preceded by some immobilization period [4].
The biomechanics of the tendon are determined by microstructural factors such as the content of collagen fibers, fiber orientation, and crosslink density, and the production of collagen fibers, moreover, the collagen fiber array are normally dependent on the direction of tensile force [5-9]. Therefore, the tensile force loaded during the immobilization can change the biochemical constitution and structure of the tendon. Moreover, the tensile force influences the array of collagen fibers, crosslink, extracellular matrix as well as the biomechanical properties of the tendon, and eventually the load and the strength [10-12].
Previous studies have compared the effect of the alteration of tensile forces with different extension and contraction positions of the tendon on the biomechanics of Achilles tendon during the established immobilization period [13-15]. However, the degree of Achilles tendon rupture greatly varies in the clinical setting. Furthermore, there is lack of data on comparison of biomechanical effect of different immobilization methods with severity of rupture or the impact of different immobilization angles combined with differing degrees of tensile forces on the biomechanics of tendon. In this study, we induced acute Achilles tendon injury of different degrees in rats, and compared biomechanical and histological outcomes according to various immobilization angles.
Go to : 
MATERIALS AND METHODS
Animals
Forty-two white Sprague-Dawley (SD) rats, aged 8 weeks, weighing 240 to 300 g, were used. They were bred in consistent temperatures of 24℃ to 26℃ and humidity up to 60%. The rats were given standard commercial feed.
Intervention and control group assignment
Of the 42 rats, 36 rats assigned to the intervention group were completely or partially transected their right Achilles tendons in a balanced fashion. The skin of incision site was sutured after the surgery. The 18 rats with complete transection and the other 18 with partial transection were each divided again into three groups of 6 rats according to the immobilization angle: plantarflexion (group A), neutral (group B), and dorsiflexion (group C). The 6 rats in the control group had the skin incision and closure of the hind limb and no other special intervention or immobilization was performed on the Achilles tendon.
Experimental procedure
Achilles tendon operation
The rats were injected with a mixture of 0.1 mL/100 g of Zoletil (zolazepam+tiletamine) and 0.03 mL/100 g of Rompun (xylazine). When the rats were fully anesthetized, 1-cm incision was made on the area of the right hind limb to expose the Achilles tendon and depending on the group, complete or partial transection was carried out 1 cm above the attachment of tendon to the calcaneus (Fig. 1) [16]. Subsequently, the incised skin was sutured and 6 mg of gentamycin was intramuscularly injected to prevent postoperative infection.
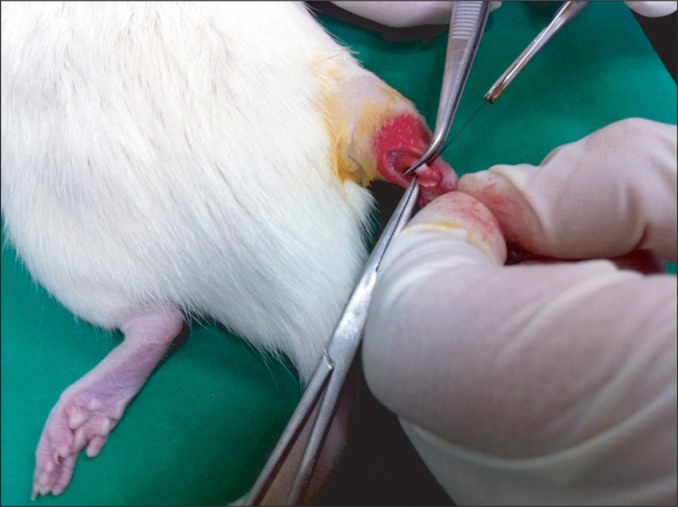 | Fig. 1The figure shows Achilles tendon tenotomy. A 1-cm longitudinal midline incision was made in the skin overlying the Achilles tendon and 1 cm proximal to the calcaneal insertion, and the tendon was separated from the surrounding tissue. Partial or total tenotomy was done at 1 cm proximal to the calcaneal insertion.
|
Hind limb immobilization angle
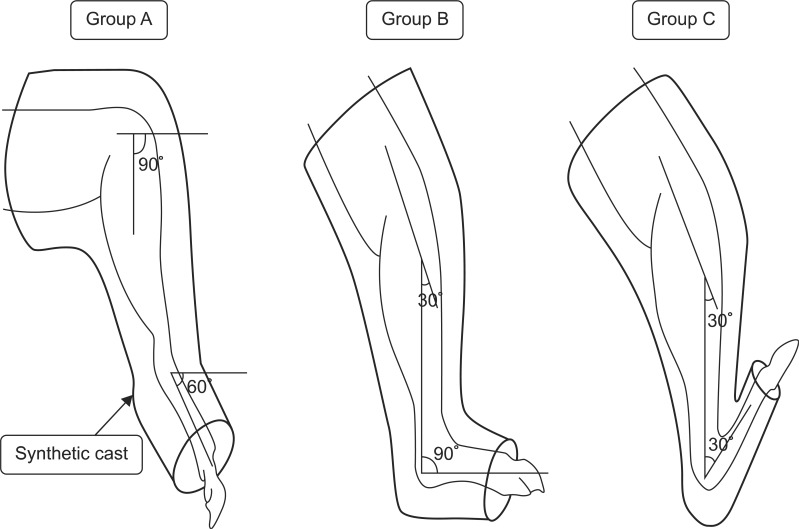
After the complete or partial transection of the right hind limb Achilles tendon, thermoplastic was used to immobilize group A at plantarflexion of 60° of ankle joint. Group B was immobilized with a neutral ankle joint position and group C was immobilized at dorsiflexion of 60° of ankle joint (Fig. 2).
Sampling the Achilles tendon
Two weeks after the immobilization, the 42 animals in the intervention groups and the control group were sacrificed via cervical dislocation, and Achilles tendons were extracted from the affected musculotendinous junction and the attachment site of calcaneus. Each end of the tendon was fixed on a depressor to prevent distortion of the specimen. Five tissue samples from each group were used for the biomechanical test and the remaining one sample was fixed in formalin for the optical microscopic observation.
Biomechanical test
Thirty tissue samples of Achilles tendons from the intervention groups and 5 from the control group were each installed in Instron-5569 universal testing machine (Instron, Boston, MA, USA) (Fig. 3). The tension test was performed at the speed of 10 mm/minutes and the start length of the Achilles tendon between the clamping jaws was recorded. The average length of the specimens in the clamping jaws was 9.5 mm. The computer connected to the machine produced the load-extension curve. Maximum force at rupture (N), extension (mm) and maximal elastic force (N) were evaluated from the curve. The stiffness (N/mm) and the energy absorption to rupture (J) were also analyzed (Fig. 4). The stiffness represents the relationship between the change in rate of Achilles tendon against tensile force (N) and the degree of Achilles tendon extension, and the stiffness was calculated as maximal elastic load/extension [13]. The energy absorption at rupture was calculated as the area under the load-extension curve to the point of complete rupture.
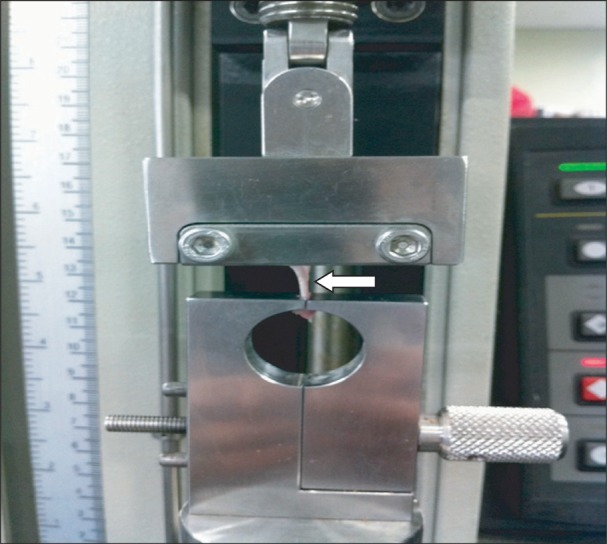 | Fig. 3The figure represents the biomechanical testing machine, Instron. Achilles tendon (arrow) was securely held with clamps and the lesion site was midway between the clamps.
|
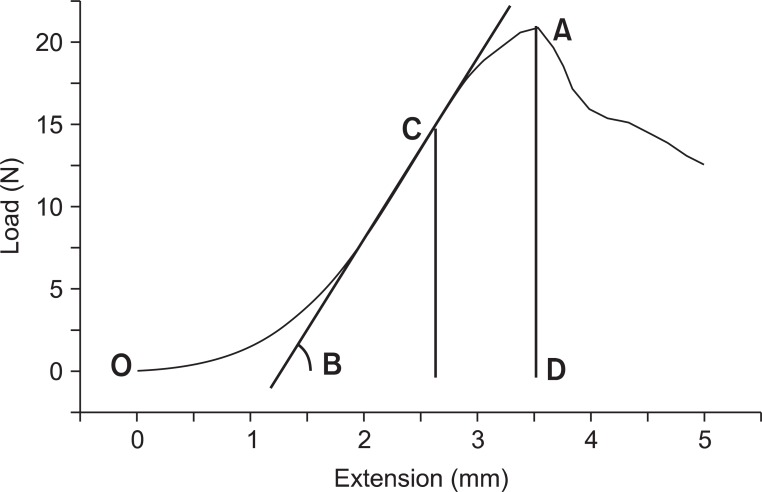 | Fig. 4The results of biomechanical data by Instron. X-axis represents tendon extension in mm, and y-axis represents load in Newton. Tendon is gradually elongated with tension until rupture. Mark A on the graph signifies the maximum force level the tendon can tolerate, in other words, the maximum force at rupture. Mark B signifies the slope of the graph, which represents the stiffness (N/mm), in other words, it means the elasticity of the tendon. Mark C signifies the maximum elastic force applied on the tendon when its elasticity is at the highest. The area bordered by O, A, and D implies the amount of absorbed energy until the tendon rupture.
|
Histological assessment
Two weeks after the surgery, tissue samples of all the groups were fixed in 10% neutral buffer of formalin. Subsequently, the samples were dehydrated and embedded in paraffin for longitudinal incision at 4-µm thickness. The incised tissues were stained with hematoxylin-eosin and the staining intensity of the collagen fibers was analyzed using a standard optical microscope. Picrosirius staining was performed simultaneously to observe the organization of collagen fibers [17]. The staining intensity and the organization of collagen fibers were semiquantitatively stratified into five stages: 1, 2, 3, 4, 5, with 5 being the closest to the normal range [18].
Statistical analysis
The results of the biomechanical analysis are presented as mean±standard deviation. The intervention group was subdivided into complete or partial transection group to compare the changes caused due to the immobilization angle among groups A, B, C and the control using one-way analysis of variance (ANOVA). A post hoc analysis was performed using Bonferroni method comparing the intervention groups with the control as well as among the intervention subgroups. Statistical significance was set as confidence interval of p<0.05. SPSS ver. 18.0 (SPSS Inc., Chicago, IL, USA) was used for statistical analysis.
Go to :
RESULTS
Biomechanical outcomes of the complete transection of Achilles tendon
After complete transaction of the right Achilles tendon, the biomechanical test was performed. The maximum force at rupture in groups A, B, and C was 17.30±1.79, 18.60±2.76, and 21.35±3.59 N, respectively, and in controls was 29.33±3.38 N. There was significant difference between all the intervention groups and the control (p=0.0001). A gradual increase in force at rupture was noted in groups A, B, and C in an orderly manner, but there were no significant differences between the intervention subgroups. However, there was significant difference between the control group and each of the intervention groups (p<0.05) (Table 1).
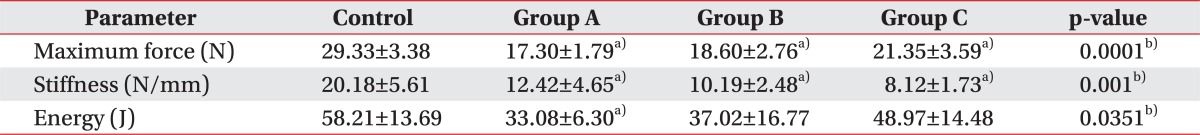
The stiffness in groups A, B, and C was 12.42±4.65, 10.19±2.48, and 8.12±1.73 N/mm, respectively, with the control group exhibiting 20.18±5.61 N/mm. There were significant differences between all the intervention groups and the control group (p=0.001). An orderly decrease in the stiffness of Achilles tendon was observed in A, B, C intervention groups, although there was no significant difference between the intervention groups. However, there was significant difference between each of the intervention groups and the control group (p<0.05) (Table 1).
The energy absorption at rupture in groups A, B, and C was 33.08±6.30, 37.02±16.77, and 48.97±14.48 J, respectively, whereas the control group exhibited 58.21±13.69 J. There were significant differences between all the intervention groups and controls (p=0.0351). The energy absorption at rupture tended to increase in A, B, and C groups in an orderly fashion; however, there was no significant difference between intervention subgroups. However, group A did show some significant difference when compared to the controls (p<0.05), whereas groups B and C did not show any significant differences with respect to the control group (Table 1).
Biomechanical outcomes of partial transection of Achilles tendon
The transection of the right hind limb Achilles tendon was followed by a biomechanical test. The maximum force at rupture in groups A, B, and C was 17.61±5.71, 18.67±3.00, and 26.03±2.58 N, respectively, with 29.33±3.38 N in the control group. There were significant differences between all the intervention groups and the controls (p=0.0004). In a subgroup comparison, the force at rupture increased in A, B, and C groups in an order and there were significant differences between group C and groups A and B (p<0.05). In addition, groups A and B showed lower maximum force at rupture when compared to the control group (p<0.05), whereas group C did not show any difference (p<0.05) (Table 2).
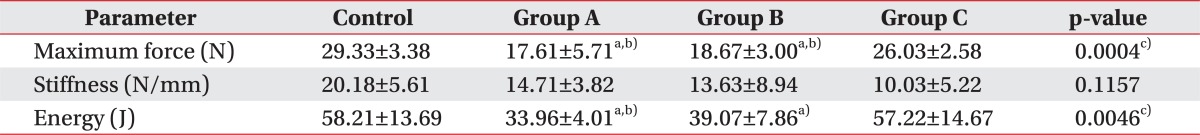
The stiffness in groups A, B, and C was 14.71±3.82, 13.63±8.94, and 10.03±5.22 N/mm, respectively, and that in the control group was 20.18±5.61 N/mm. There were no significant differences between all the intervention groups and the controls (p=0.1157). The Achilles tendon stiffness tended to make a steady decline in A, B, and C groups in an orderly manner, and there were no statistical significance among intervention subgroups as well as between the intervention groups and the control group (Table 2).
The energy absorption at rupture in groups A, B, and C was 33.96±4.01, 39.07±7.86, and 57.22±14.67 J, respectively, and that in the control group was 58.21±13.69 J. There were statistically significant differences between all of intervention groups and the controls (p=0.0046). The energy absorption at rupture was the highest in group C amongst the intervention subgroups, and there was a significant difference between group C and group A (p<0.05), but not with group B. Group A was the only intervention group, which exhibited significant difference when compared to the controls (p<0.05) (Table 2).
Histological outcomes
Histological outcomes are provided as supplementary data. The Achilles tendons of 36 rats in the intervention groups were smoothly reconnected by naked eyes two weeks after the operation. In the hematoxylin-eosin staining, both the total transection (Fig. 5) and partial transection (Fig. 6) groups were immobilized in varying positions. When the outcomes of the plantarflexion and the dorsiflexion positions were compared semiquantitatively, the intensity of staining of collagen fibers was 4 without any difference. In a semiquantitative comparison of the collagen fibers organization as per Picrosirius staining, the total transection group with plantarflexion showed a score of 1, and the dorsiflexion group showed a score of 2 (Fig. 5). The partial transection group with plantarflexion had a score of 1, whereas the dorsiflexion group exhibited a score of 3. According to the staining results, the dorsiflexion group exhibited improved organization of collagen fibers among all the intervention subgroups (Fig. 6).
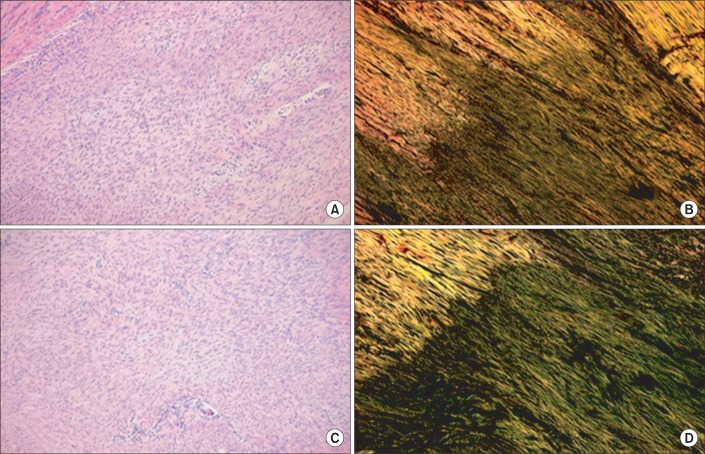 | Fig. 5(A, C) are hematoxylin-eosin (×100) staining and (C, D) are the Picrosirius (×100) staining of longitudinal sections through the rupture site of the Achilles tendon in total tenotomy. Among the total tenotomy rat tendons, (A, B) are from the plantarflexion and (C, D) are from the dorsiflexion posture of immobilization. Green fibers indicate type III collagen in (B, D). In (B, D), the alignment of tendon fibers can be seen. However, (D) of dorsiflexion posture shows denser and well aligned collagen fibers than (B).
|
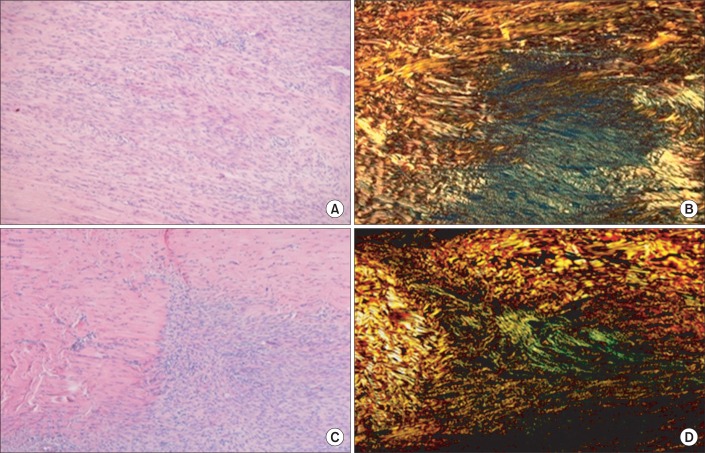 | Fig. 6(A, C) are hematoxylin-eosin (×100) staining and (B, D) are the Picrosirius (×100) staining of longitudinal sections through the rupture site of the Achilles tendon in hemitenotomy. (A, B) are from the plantarflexion and (C, D) are from the dorsiflexion posture of immobilization. Green fibers indicate type III collagen. In hemitenotomy, (D) from dorsiflexion posture also shows denser collagen fibers than (B).
|
Go to :
DISCUSSION
This study provided differing degrees of distraction force with various degrees of Achilles tendon injury and ankle joint immobilization angles, which aided in the identification of the biomechanical effect of load upon the recovery of Achilles tendon, and ultimately in assessing the impact of immobilization angle on the recovery of the Achilles tendon. In the biomechanical test, the force at rupture and the energy absorption at rupture of healed Achilles tendons increased in the complete rupture group with dorsiflexion and almost reached the level of the control group of intact Achilles tendons. In the partial transection group, dorsiflexion group withstood the significantly highest force at rupture amongst other immobilization positions. Furthermore, the energy absorption at rupture was also higher with dorsiflexion when compared to plantarflexion. The supplementary histological data revealed improvement in histological organization of collagen fibers with dorsiflexion position than plantarflexion in both complete and partial transection groups. This result indicates that dorsiflexion at immobilization induces more distraction force that accelerates the healing process.
Murrell et al. [19,20] and Best et al. [21] have reported that the regeneration of the Achilles tendon takes about 15 days in rat models. Several studies have suggested that the immobilization clinically causes degeneration and changes in the characteristics of musculoskeletal tissue [5,11,22]. Also, it has been reported that when elastic stress is induced onto the recovering tendon in order to reduce degeneration during the early immobilization after the Achilles tendon injury, the increasing migration of fibroblasts result in significant decrease in the failure of early postoperative treatment [19]. Bidder et al. [23] have reported that biomechanical load increases the synthesis of vascular endothelial growth factor to mediate angiogenesis. However, in a qualitative histologic comparison, the area of injury area in our study showed no difference in terms of extension and constitution of the granulation tissue, and the distribution of lymphocyte and fibroblast within the intervention groups.
Mass et al. [24] have hypothesized that the biomechanical load on the healing area might contribute to the organic array of deposited collagen fibers and strengthening of extracellular matrix bonding to reinforce the regenerated tissue. These fibers are arrayed parallel to the direction of induced force, which enhances them to withstand stronger tensions. The exposure to load during the postoperative rehabilitation period boosts the resistance of tissues against deformation [24]. This report is consistent with the finding in the current study suggesting that the immobilization angle of increasing load leads to better biomechanical outcomes.
The Picrosirius staining revealed that the dorsiflexion group (group C) had more clearly organized and thickened collagen fibers. This observation strongly suggests that the biomechanical load on the treated area contributes to more organic array of collagen fibers and improvement in healing process. This histological difference explains as why the group C exhibited highest biomechanical test results.
The recovery of stiffness is associated with the proliferation of collagen fibers as well as a number of other factors such as the maximum force at load or rupture related to the tension [25]. This study demonstrated a trend towards decrease in stiffness of tendon with dorsiflexion during the immobilization in both the transection groups. Several animal studies reported that the force at rupture returns to normal on 13th day after injury, but only 60% with respect to stiffness, and the tendon stiffness might be reduced regardless of the improvement in the rupture load and histological outcomes [11,21,26]. If the biomechanical test had been carried out at later stage, the results might have shown similar degree of stiffness recovery as the force at rupture and energy absorption at rupture.
This study revealed that dorsiflexion was more beneficial within the first two weeks of healing after the injury. However, the observation period was too short to examine subsequent changes in biomechanical properties and array of collagen fibers. Another limitation of this study is the small number of animals used in the biomechanical assessment. Further studies are needed to determine more effective immobilization period, selection of intervention group, and the new treatment options.
In conclusion, this study compared the biomechanical and histological outcomes of different immobilization methods for various degrees of Achilles tendon injury. In the partial transection group, dorsiflexion resulted in improved biomechanical performance and histological findings when compared to plantarflexion. In the complete transection group, biomechanical performance also seemed to improve with dorsiflexion. This might reflect the improvement in tensile strength of tendon due to more organic array of collagen fibers through consistent and repeated biomechanical strain on the affected area. It is hypothesized that this study will provide a rationale for future clinical trials on the immobilization methods of the injured Achilles tendon.
Go to :
 XML Download