

 PDF
PDF ePub
ePub Citation
 Print
Print


INTRODUCTION
MATERIALS AND METHODS
Subjects and acquisition of clinical data

18F-FDG PET/CT study and analysis
Selection methods of target muscles for BoNT-A injection
Methods of BoNT-A injection
Statistical analysis
RESULTS
The characteristics of the subjects
Findings of 18F-FDG PET/CT imaging in group 2
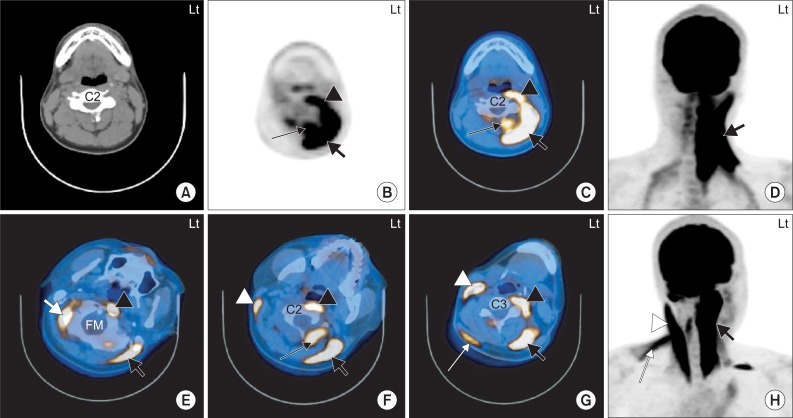 | Fig. 2The 18F-FDG PET/CT images of 2 independent subjects with left torticollis. 1. A 20-year-old man with cervical dystonia whose main symptom was left torticollis (A-D). The 18F-FDG uptake is increased at the anterior and posterior neck muscles on the left side at the level of the C2 vertebral body. The hot uptake of 18F-FDG was seen in the left LC/Lc (black arrow head), left SPC (thick black arrow) and left SSC (thin black arrow) (B-D). 2. A 38-year-old man with cervical dystonia whose main symptom was left torticollis (E-H). The 18F-FDG uptake is increased at the anterior and posterior neck muscles at the levels of foramen magnum (FM; E), C2 vertebral body (F) and C3 vertebral body (G). The hot uptake of 18F-FDG was seen in the right OCS (thick white arrow), left LC (black arrow head) and left SPC (thick black arrow) (E). Increased 18F-FDG uptake was also seen in the right SCM (white arrow head), left LC (black arrow head), left SPC (thick black arrow) and left RCPM (thin black arrow) (F). The hot uptake of 18F-FDG was showed in the right SCM (white arrow head), right uTz (thin white arrow), left LC (black arrow head) and left SPC (thick black arrow) (G). LC: Longus capitis, Lc: Longus colli, SPC: Splenius capitis, SSC: Semispinalis capitis, OCS: Obliquus capitis superior, SCM: Sternocleidomastoid, RCPM: Rectus capitis posterior major, uTz: Upper trapezius.
|
Supplement Table S1
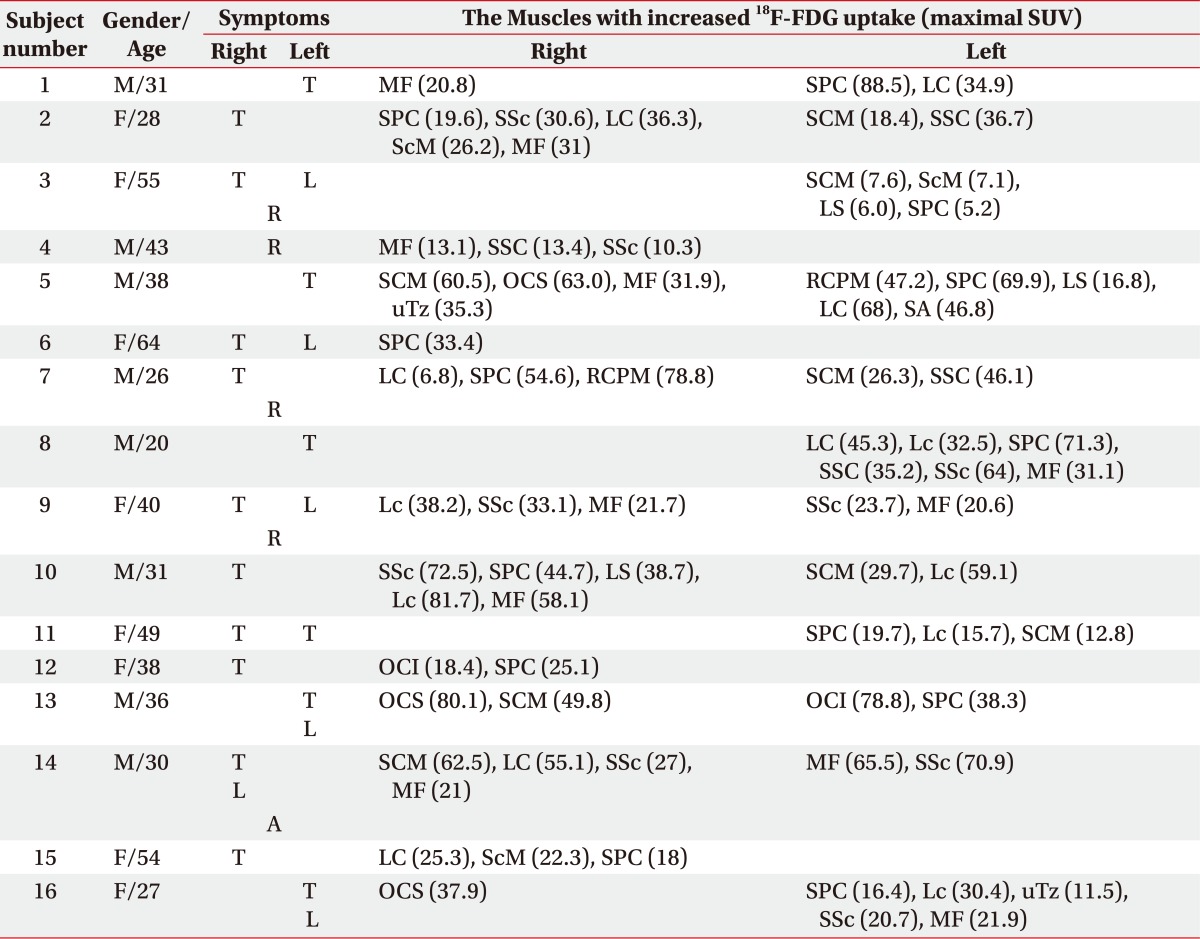
*Group 2: 18F-FDG PET/CT-assisted, clinically targeting group
SUV: Standardized uptake value, T: Toricollis, L: Laterocollis, R: Retrocollis, A: Anterocollis, MF: Multifidi, SPC: Splenius capitis, LC: Longus capitis, SSc: Semispinalis cervicis, ScM: Scalenus medius, SCM: Sternocleidomastoid, SSC: Semispinalis capitis, LS: Levator scapulae, OCS: Obliquus capitis superior, uTz: Upper trapezius, RCPM: Rectus capitis posterior major, SA: Serratus anterior, Lc: Longus colli, OCI: Obliquus capitis inferior
![]()
Comparison of the outcomes of BoNT-A injection between group 1 and 2
Table 2
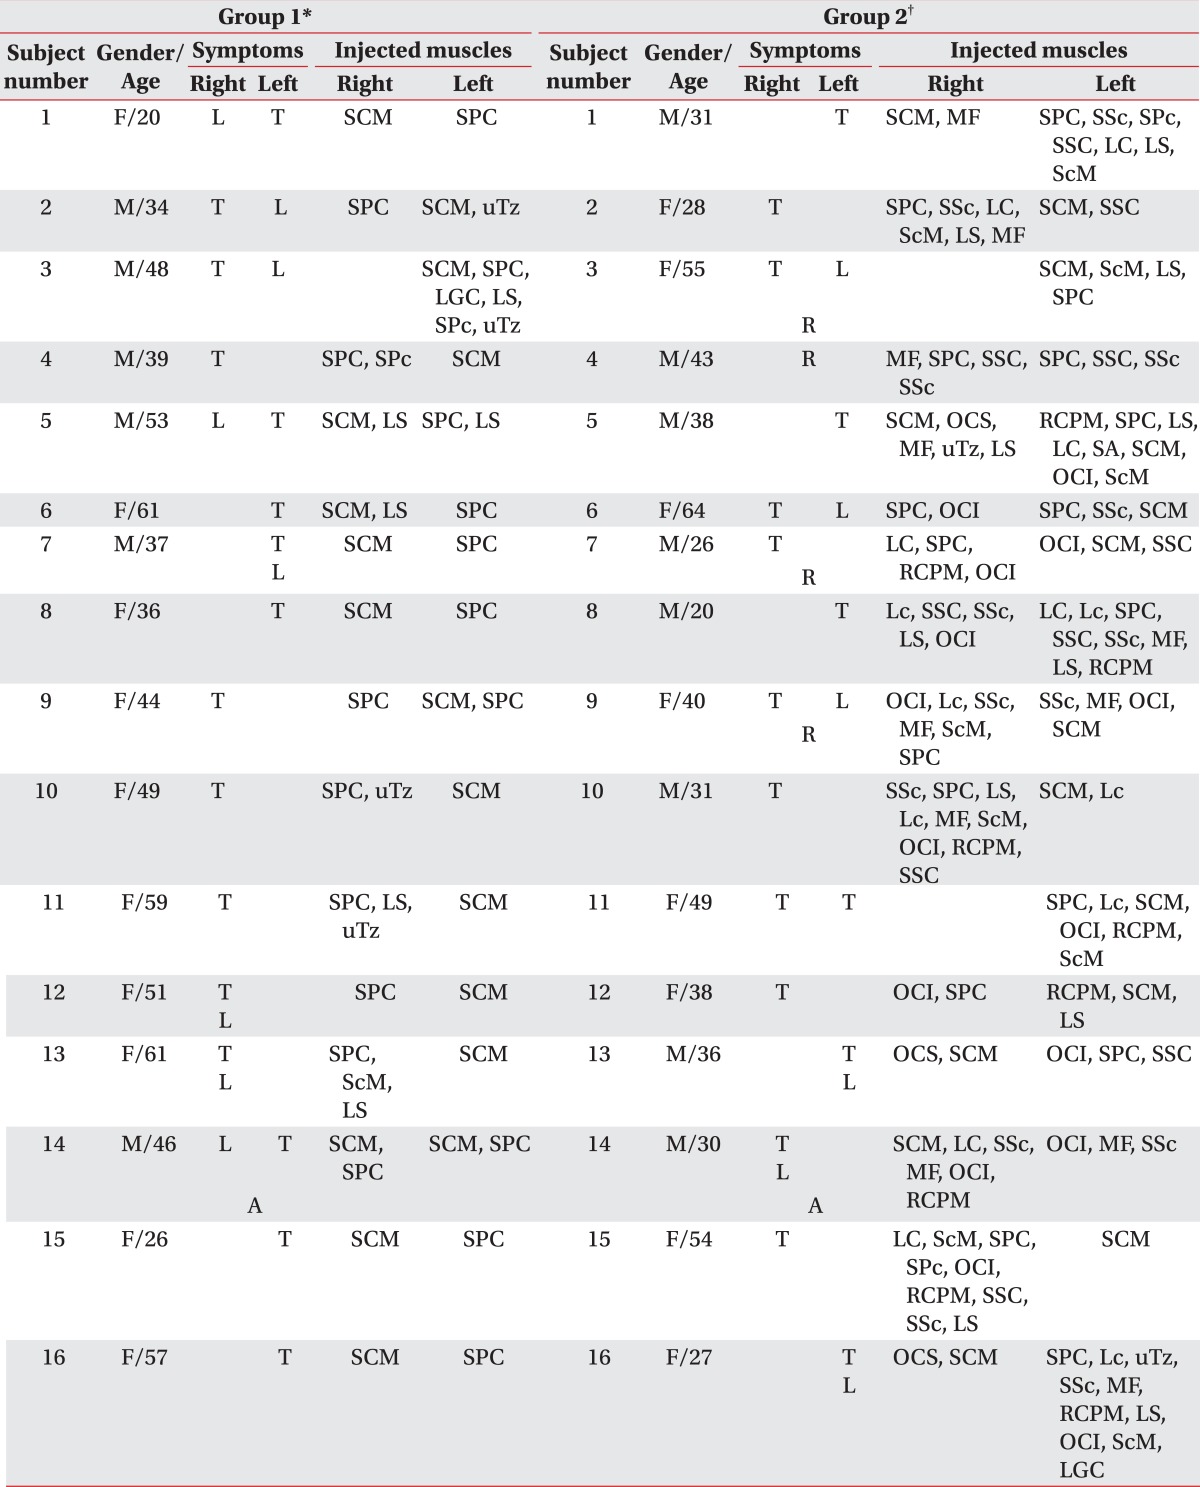
T: Toricollis, L: Laterocollis, A: Anterocollis, R: Retrocollis, SCM: Sternocleidomastoid, SPC: Splenius capitis, MF: Multifidi, SSc: Semispinalis cervicis, SPc: Splenius cervicis, SSC: Semispinalis capitis, LC: Longus capitis, LS: Levator scapulae, ScM: Scalenus medius, uTz: Upper trapezius, LGC: Longissimus capitis, OCS: Obliquus capitis superior, RCPM: Rectus capitis posterior major, SA: Serratus anterior, OCI: Obliquus capitis inferior, Lc: Longus colli
*Group 1: Clinically targeting group, †Group 2: 18F-FDG PET/CT-assisted, clinically targeting group
![]()
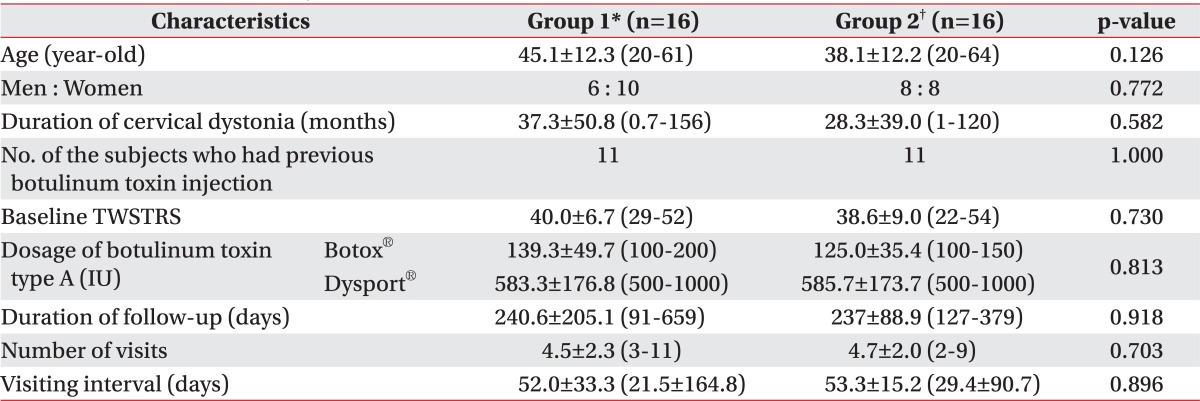
Table 3
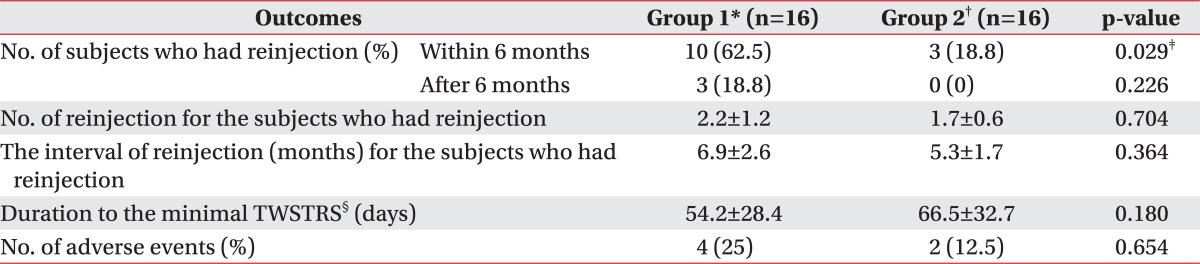
All values are expressed as means±standard deviation or numbers (%)
BoNT-A: Botulinum toxin type A, TWSTRS: Toronto Western Spasmodic Torticollis Rating Scale
*Group 1: Clinically targeting group, †Group 2: 18F-FDG PET/CT-assisted, clinically targeting group, ‡p<0.05, §The duration from the initial BoNT-A injection to the minimal TWSTRS
![]()
Comparison of reduction rate of TWSTRS ac cording to groups in reference to the duration since the initial BoNT-A Injection
Table 4
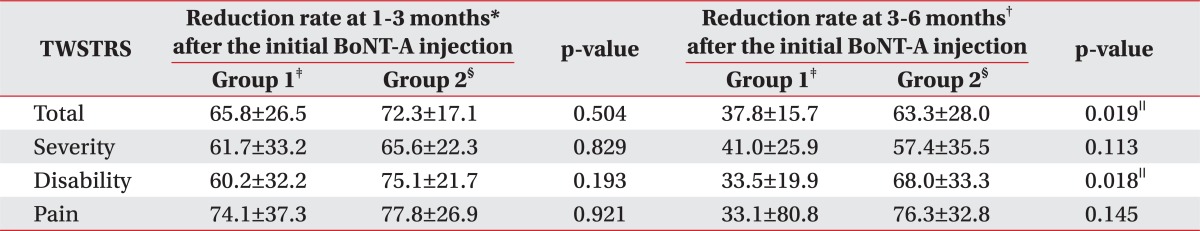
All values are expressed as means±standard deviation
TWSTRS: Toronto Western Spasmodic Torticollis Rating Scale, BoNT-A: Botulinum toxin type A
*Reduction rate at 1-3 months: Reduction rate of the TWSTRS score=(Baseline score-The follow-up score at 1-3 months)/Baseline score×100, †Reduction rate at 3-6 months: Reduction rate of the TWSTRS score=(Baseline score-The follow-up score at 3-6 months)/Baseline score×100, ‡Group 1: Clinically targeting group, §Group 2: 18F-FDG PET/CT-assisted, clinically targeting group, ∥p<0.05
![]()
The probability of reinjection-free living in both groups
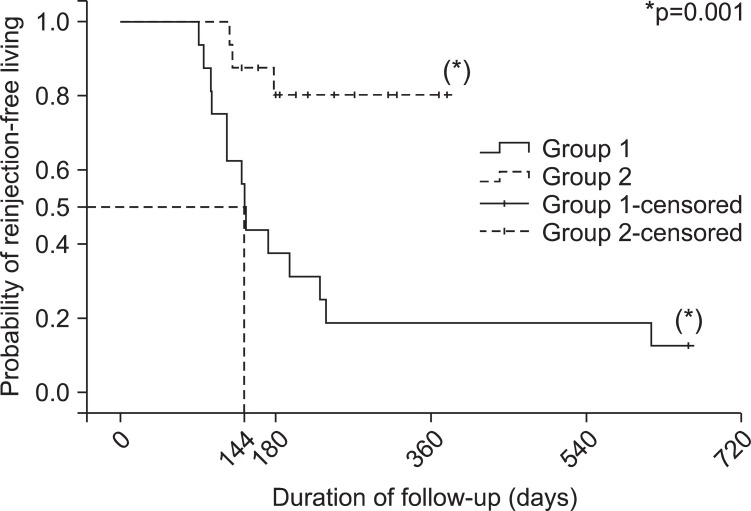 | Fig. 3The Kaplan-Meier plot showing the probability of reinjection-free living after BoNT-A injection in clinically targeting group (group 1) and the 18F-FDG PET/CT-assisted, clinically targeting group (group 2). The probability of reinjection-free living is 0.8 in group 2, while the rate is 0.19 in group 1 when the duration of follow up is one year (365 days). The duration of follow-up for group 1 was 144 days (95% confidence interval: 134.2-153.8) when the reinjection-free living rate had come to 50%.
|
 XML Download