

 PDF
PDF ePub
ePub Citation
 Print
Print


INTRODUCTION
MATERIALS AND METHODS
Subjects
Procedure and intervention
Assessment of effectiveness of injection
Statistical analysis
RESULTS
Characteristics of subjects
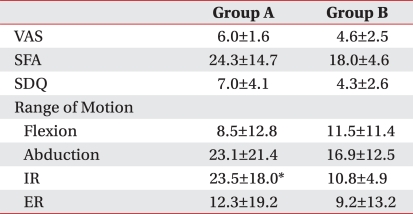
Table 1
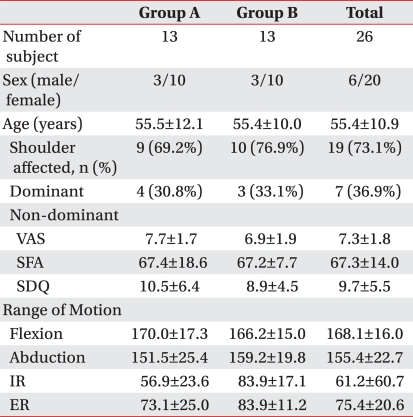
Values are mean±standard deviation
Group A: patients injected with 0.5% lidocaine 5 ml+triamcinolone 40 mg+high molecular weight sodium hyaluronate 2 ml, Group B: patients injected with 0.5% lidocaine+triamcinolone 40 mg, VAS: visual analogue scale, SFA: Shoulder function assess ment scale, SDQ: Shoulder disability question naire, IR: Internal rotation, ER: External rotation
![]()
Change of visual analogue scale (VAS)
 | Fig. 2Figure shows the changes of visual analogue scale (VAS) after 3 consecutive injections. *p<0.05 pre-injection vs 2 weeks after 3rd injection. †p<0.05 pre-injection vs 1 week after 1st injection. ‡p<0.05 1 week after 1st injection vs 1 week after 2nd injection. §p<0.05 1 week after 2nd injection vs 2 weeks after 3rd injection.
|
Table 3
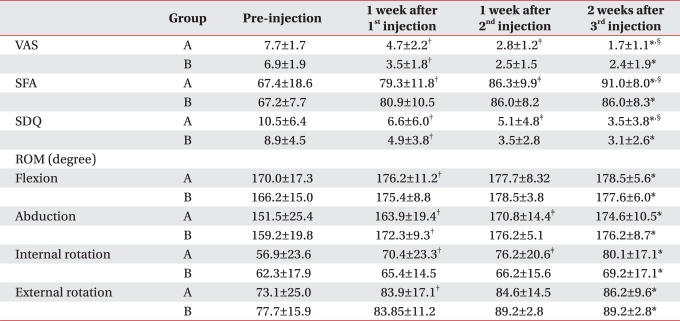
Values are mean±standard deviation
Group A: patients injected with 0.5% lidocaine 5 ml+triamcinolone 40 mg+high molecular weight sodium hyaluronate 2 ml, Group B: patients injected with 0.5% lidocaine+triamcinolone 40 mg, VAS: Visual analogue scale, SFA: Shoulder function assessment scale, SDQ: Shoulder disability questionnaire
*p<0.05 pre-injection vs 2 weeks after 3rd injection, †p<0.05 pre-injection vs 1 week after 1st injection, ‡p<0.05 1 week after 1st injection vs 1 week after 2nd injection, §p<0.05 1 week after 2nd injection vs 2 week after 3rd injection
![]()
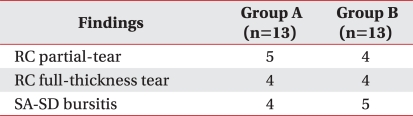
Table 4
Values are mean±standard deviation
Group A: Patients injected with 0.5% lidocaine 5 ml+triamcinolone 40 mg+high molecular weight sodium hyaluronate 2 ml, Group B: Patients injected with 0.5% lidocaine + triamcinolone 40 mg, VAS: Visual analogue scale, SFA: Shoulder function assessment scale, SDQ: Shoulder disability question naire, IR: Internal rotation, ER: External rotation
*p<0.05 steroid vs steroid plus hyaluronate
![]()
Change of SFA
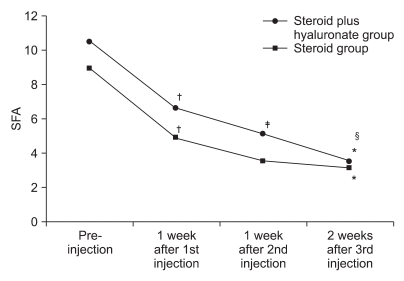 | Fig. 3Figure shows the changes of shoulder function assessment scale (SFA) after 3 consecutive injections. *p<0.05 pre-injection vs 2 weeks after 3rd injection. †p<0.05 preinjection vs 1 week after 1st injection. ‡p<0.05 1 week after 1st injection vs 1 week after 2nd injection. §p<0.05 1 week after 2nd injection vs 2 week after 3rd injection.
|
Change of SDQ
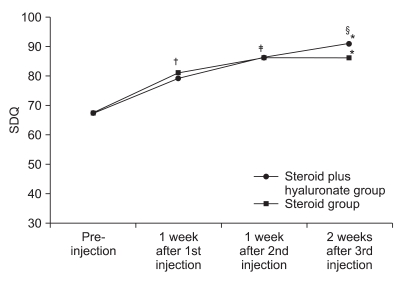 | Fig. 4Figure shows the changes of shoulder disability questionnaire (SDQ) after 3 consecutive injections. *p<0.05 pre-injection vs 2 weeks after 3rd injection. †p<0.05 pre-injection vs 1 week after 1st injection. ‡p<0.05 1 week after 1st injection vs 1 week after 2nd injection. §p<0.05 1 week after 2nd injection vs 2 weeks after 3rd injection.
|
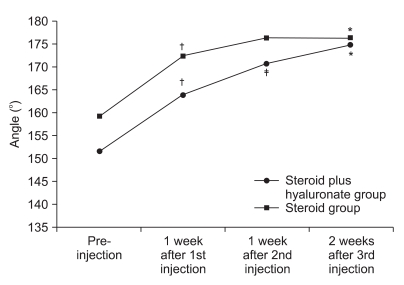
Change of active range of motion
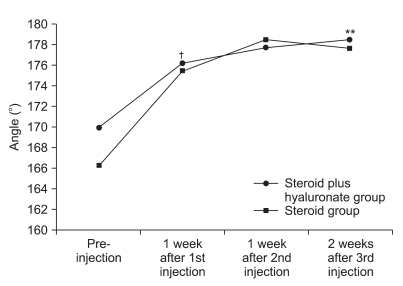 | Fig. 5Figure shows the changes of AROM of shoulder flexion after 3 consecutive injections. *p<0.05 pre-injection vs 2 weeks after 3rd injection. †p<0.05 pre-injection vs 1 week after 1st injection. ‡p<0.05 1 week after 1st injection vs 1 week after 2nd injection. §p<0.05 1 week after 2nd injection vs 2 weeks after 3rd injection.
|
 | Fig. 8Figure shows the changes of AROM of shoulder external rotation after 3 consecutive injection. *p<0.05 pre-injection vs 2 weeks after 3rd injection. †p<0.05 pre-injection vs 1 week after 1st injection. ‡p<0.05 1 week after 1st injection vs 1 week after 2nd injection. §p<0.05 1 week after 2nd injection vs 2 weeks after 3rd injection.
|


 XML Download