

 PDF
PDF Citation
 Print
Print


INTRODUCTION
Allograft rejection is regarded as one of the severe complications following liver transplantation (LT). Acute cellular rejection (ACR) after LT has decreased with the development of immunosuppressants, but it still affects 15%–25% of recipients [12]. Among those, approximately 5%–10% of recipients who had ACR can progress to severe chronic rejection [34]. Therefore, early diagnosis and proper treatment are essential for improving graft survival as well as patient prognosis [56].
In transplant recipients, liver biopsy is the gold standard for the diagnosis of acute rejection [78]. However, many studies have pointed out that it is invasive and its overall complications rate is 5%–7.1% [910]. The complications include minor complications like localized pain and mild transient hypotension to severe pain and major bleeding [11]. For these reasons, some centers do not perform a routine protocol liver biopsy without definite evidence of graft dysfunction. However, there are no definite guidelines for selecting patients for liver biopsy [12].
Noninvasive diagnostic tools, such as serum/urine biomarkers, cytological analysis, and imaging modalities were developed to avoid the complications of liver biopsy and safely predict ACR [131415161718]. However, those methods were available only at laboratory level, were not reproducible and not freely available on the market.
The neutrophil-to-lymphocyte ratio (NLR) has been considered as a strong predictor of inflammation and poor prognosis in a variety of conditions such as cancer and transplantation [1920]. ACR is the result of a complex series of interactions involving coordination between both the innate and adaptive immune system with T cells central to this process. Once recipient T cells become activated, they undergo clonal expansion, differentiation [20]. It is known that lymphocytes ultimately infiltrate the graft and circulate in the peripheral blood.
We hypothesize that the value of NLR changes in response to ACR after LT. This study aimed to evaluate the predictive value of NLR in ACR after living donor LT (LDLT).
Go to : 
METHODS
Patients
This study was a retrospective study using prospectively collected data from the electronic medical records of Seoul National University Bundang Hospital. Patients who underwent ABO-compatible (ABOc) LDLT between September 2014 to December 2017 were included. All recipients received modified right liver grafts from living donors. The following factors were excluded as they had the potential to influence the NLR after LT; (1) antibody-mediated rejection, (2) acute infection at biopsy, (3) systemic inflammatory response syndrome or sepsis at biopsy, and (4) additional administration of high-dose steroids over the routine protocol. The median follow-up of the study cohort was 55 months. This study was approved by the Institutional Review Board of Seoul National University Bundang Hospital in Seongnam, Korea, an academic hospital affiliated with Seoul National University College of Medicine (No. B-1901-516-109). Written informed consent from patients was waived due to the retrospecitve nature of this study.
Protocol liver biopsy and acute cellular rejection grading
The measurement of resistive index (RI) by Doppler ultrasonography was performed in all patients on days 1, 2, and 3. Protocol liver biopsies and CT scans were performed routinely on postoperative day 7 to check the status of the liver graft and post-LT vasculature as well as abdominal complications. The following indications were considered for liver biopsy after discharge; (1) worsening of liver function or elevation in enzymes, (2) an abnormal increase in liver enzymes after the initial decrease, (3) unexpected abnormality of liver enzymes following a treated event, and (4) follow-up to a prior biopsy.
The histologic findings were graded according to the Banff schema. For statistical analysis, the rejection activity index (RAI) score was subsequently grouped as follows: RAI score < 2, no rejection; RAI = 2, indeterminate rejection; RAI score = 3–4, mild rejection; RAI score = 5–6, moderate rejection; and RAI score > 6, severe rejection [21]. The definition of ACR used in this study was more than 3 scores of RAI.
Immunosuppression protocol and treatment of ACR
When performing ABOc LDLT, basiliximab (Simulect, Novartis, Montreal, QC, Canada) was administered as the induction therapy, 20 mg on the day of surgery and the same dose on a postoperative day 4. The triple maintenance regimen for immunosuppression consisted of tacrolimus (target level: 8–12 ng/mL for 6 months, 6–8 ng/mL between 6 and 12 months post-LT), mycophenolate mofetil (500 mg twice per day), and steroids (methylprednisolone; 1,000 mg tapering to 20 mg/day). The first-line treatment of ACR was pulsed high-dose corticosteroids combined with increased serum levels of tacrolimus with the other immunosuppressant.
Neutrophil-to-lymphocyte ratio
The value of NLR was calculated as the percentage of neutrophils divided by the percentage of lymphocytes in the peripheral blood count. NLR was obtained on 3 occasions; (1) 4 weeks prior to LT, (2) the day of LT (NLR was calculated at postoperative day), and (3) immediately prior to liver biopsy. In addition, NLR and other noninvasive markers for ACR such as the change in the liver enzymes, peripheral eosinophil count, and Doppler RI were compared in ACR group and non-ACR group.
Statistical analysis
All statistical analyses were performed using IBM SPSS Statistics ver. 22.0 (IBM Corp., Armonk, NY, USA). Patient demographics were expressed as median (range). The Mann-Whitney U-test was used for comparisons between the ABOc LDLTs. P < 0.05 was considered statistically significant. The optimal cut-off values for low NLR with sensitivity and specificity were evaluated using the receiver operating characteristic (ROC) curve analysis.
Go to :
RESULTS
Patients' demographics and outcomes
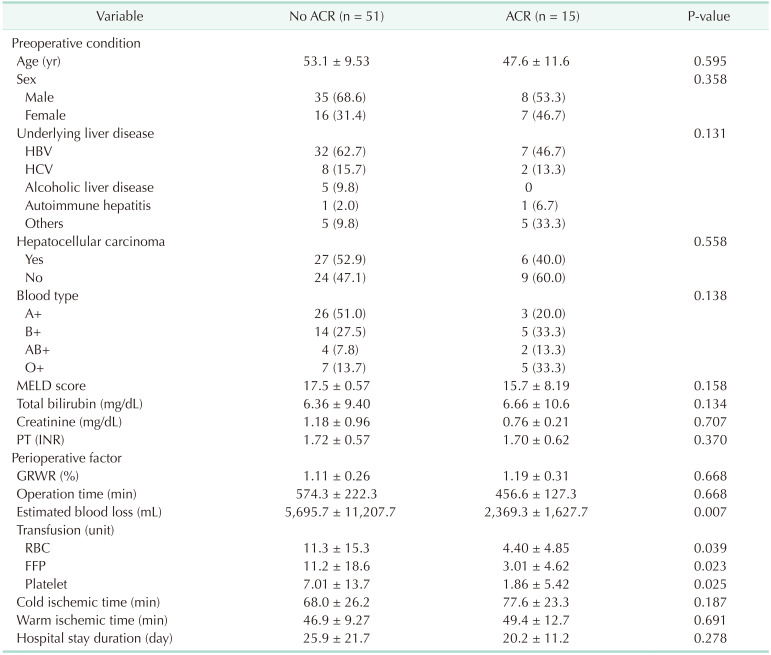
Among 66 patients who underwent ABOc LDLT, ACR was identified in 15 patients (22.7%). The demographics of recipients in both the no-ACR and ACR groups are summarized in Table 1. There was no significant difference in age, sex, underlying liver disease, and blood type between both groups. The proportion of patients with hepatocellular carcinoma was similar in both groups (52.9% vs. 40.0%, P = 0.558). The model for end-stage liver disease score (17.5 ± 0.57 vs. 15.7 ± 8.19, P = 0.158), total bilirubin (6.36 ± 9.40 mg/dL vs. 6.66 ± 10.6 mg/dL, P = 0.134), serum creatinine (1.18 ± 0.96 mg/dL vs. 0.76 ± 0.21 mg/dL, P = 0.707), and PT (international normalized ratio; 1.72 ± 0.57 vs. 1.70 ± 0.62, P = 0.370) were not significantly different in both groups. The mean graft-to-recipient body weight ratio (1.11 ± 0.26 vs. 1.19 ± 0.31, P = 0.668) and the mean operation time (574.3 ± 222.3 minutes vs. 456.6 ± 127.3 minutes, P = 0.668) were not statistically different. The estimated blood loss was significantly lower in the ACR groups compared to the non-ACR group (2,369.3 ± 1,627.7 mL vs. 5,695.7 ± 11,207.7 mL, P = 0.007). The number of patients who received transfusion were significantly higher in the non-ACR group than the ACR group (packed red blood cells, P = 0.039; fresh frozen plasma, P = 0.023; and platelet, P = 0.025). The mean cold ischemic time (68.0 ± 26.2 minutes vs. 77.6 ± 23.3 minutes, P = 0.187), the mean warm ischemic time (46.9 ± 9.27 minutes vs. 49.4 ± 12.7 minutes, P = 0.278), and the hospital stay (25.9 ± 21.7 days vs. 20.2 ± 11.2 days, P = 0.278) were not significantly different in both groups.
The interrelationship between neutrophil-to-lymphocyte ratio and acute cellular rejection
Table 2 shows the relationship between NLR and ACR. In this study, 15 patients (22.7%) developed histologically-confirmed ACR at the routine protocol liver biopsy on a postoperative day 7. These patients were subclassified into mild (RAI 3–4), moderate (RAI 5–6) and severe (RAI > 6) groups including 7 patients (46.7%), 7 patients (46.7%), and 1 patient (6.7%) respectively.
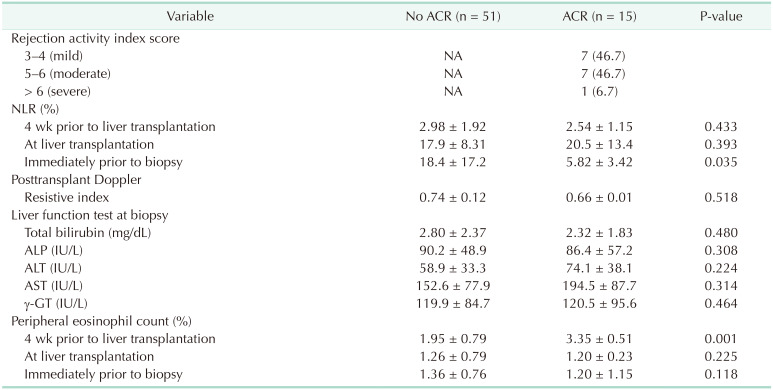
When comparing the changes of NLR between no-ACR and ACR group, there was no significant difference; 2.98 ± 1.92 vs. 2.54 ± 1.15 (P = 0.433) at 4 weeks prior to LT, 17.9 ± 8.31 vs. 20.5 ± 13.4 (P = 0.393) at the time of LT, respectively. However, NLR was significantly lower just prior to liver biopsy (5.82 ± 3.42 vs. 8.4 ± 17.2, P = 0.035) in the ACR group compared to the non-ACR group.
The mean value of RI was similar between no-ACR and ACR groups (0.74 ± 0.12 vs. 0.66 ± 0.01, P = 0.518). On analyzing liver function tests, total bilirubin (2.80 ± 2.37 mg/dL vs. 2.32 ± 1.83 mg/dL, P = 0.480), ALP (90.2 ± 48.9 IU/L vs. 86.4 ± 57.2 IU/L, P = 0.308), ALT (58.9 ± 33.3 IU/L vs. 74.1 ± 38.1 IU/L, P = 0.224), AST (152.6 ± 77.9 IU/L vs. 194.5 ± 87.7 IU/L, P = 0.314), and γ-GT (119.9 ± 84.7 IU/L vs. 120.5 ± 95.6 IU/L, P = 0.464) were similar at all 3 occasions between 2 groups. When comparing the changes of peripheral eosinophil counts between no-ACR and ACR groups, it was significantly higher in the ACR group at 4 weeks prior to LT. However, there was no significant difference at LT (1.26 ± 0.79 vs. 1.20 ± 0.23, P = 0.225) and immediatedly prior to liver biopsy (1.36 ± 0.76 vs. 1.20 ± 1.15, P = 0.118).
Fig. 1 shows the trend of serum neutrophil, lymphocyte, eosinophil, and NLR in the ACR group. NLR decreased 3.5 days before the onset of ACR. Fig. 2 shows the ROC curve of NLR for predicting the occurrence of ACR. In the ROC curve for ACR, the area under the ROC curve of NLR was 81.0%. The optimal cut-off value was 6.49, and the sensitivity and specificity of NLR were 80.4% and 73.3%, respectively.
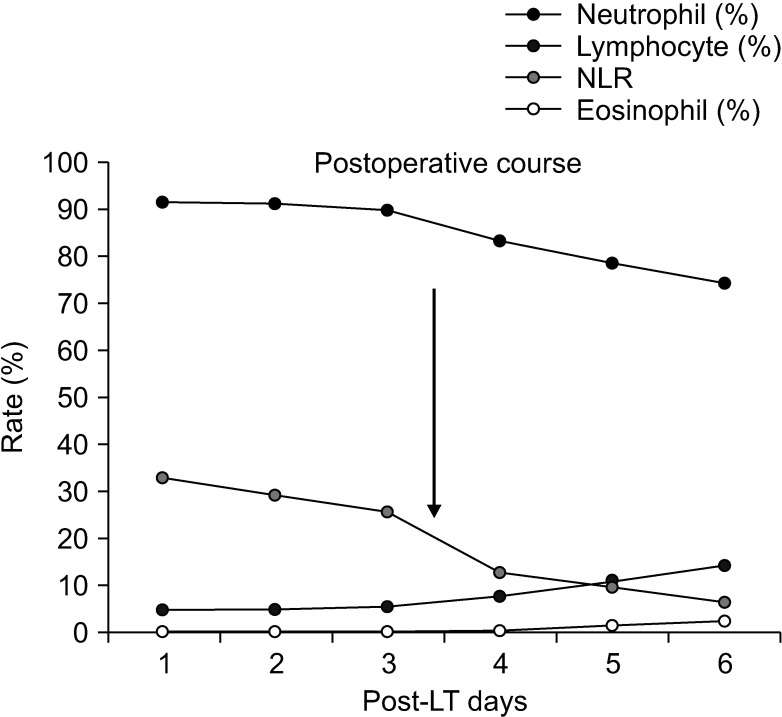 | Fig. 1It shows the trend of the percentage of serum neutrophil, lymphocyte, eosinophil, and neutrophil-to-lymphocyte ratio (NLR) according to the postoperative course in the acute cellular rejection (ACR) group. NLR tends to decrease in the 3.5 days before the onset of ACR. LT, liver transplantation.
|
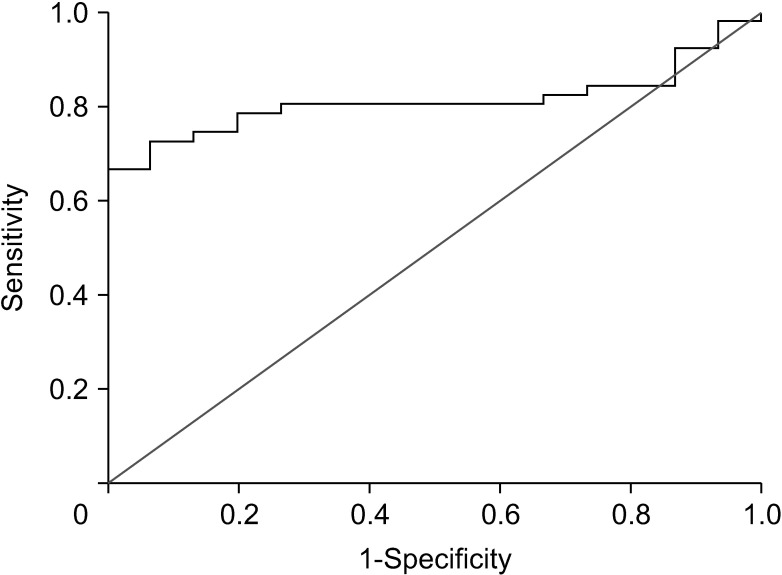 | Fig. 2The receiver operating characteristic (ROC) curve for the neutrophil-to-lymphocyte ratio (NLR) for predicting the occurrence of acute cellular rejection (ACR). In the ROC curve for ACR, the area under the ROC curve of NLR was 81.0%. The optimal cut-off value was 6.49, and the sensitivity and specificity of NLR were 80.4% and 73.3%, respectively.
|
Go to :
DISCUSSION
The ACR of the liver graft is a relatively common and well-studied phenomenon, particularly in the early posttransplant period [21]. Allograft rejection against the liver allograft activates the expression of IL-2 and other proinflammatory cytokines that stimulate T cell activation [22]. Consequently, it stimulates T cell proliferation. Therefore, our hypothesis is that the NLR will change due to T cell proliferation in patient with ACR after LDLT.
In this study, the value of NLR was lower in the ACR group than in the non-ACR group around time of ACR. The appropriate cut-off value of NLR to predict ACR development was found to be 6.49, according to the ROC curve. These results show that low levels of NLR may be closely related to the occurrence of ACR. Therefore, NLR has potential as a noninvasive predictor of early ACR who undergoes ABOc LDLT. Therefore, serial monitoring of this ratio will help identify subclinical graft dysfunction before onset of ACR in ABOc LDLT.
There are several possible noninvasive diagnostic tools for the diagnosis of ACR. However, there are few available tests commercially. Screening tests must be easily obtainable, inexpensive, and reproducible for prediction of disease. Elevation of liver enzymes after LT can be a clue to suspect ACR, but it is nonspecific and has a low sensitivity in diagnosing ACR [23]. It also was not well correlated with simultaneous liver biopsy findings [24]. We found no significant difference in liver enzymes between ACR and no-ACR groups, and its clinical significance remains doubtful. Several studies reported that absolute eosinophil count (AEC) and differential count in the peripheral blood have an association with ACR in renal, cardiac, and lung transplantation [25]. In LT, peripheral eosinophilia correlates with graft eosinophilia in ACR [15]. Using a cut-off for AEC of 400/µL and relative eosinophil count of 4%, eosinophilia has excellent specificity (83%–97%) but low sensitivity (28%–38%) for ACR [26]. In this study, no significant difference was found in eosinophil counts between the ACR group and no-ACR group.
Although there are some limitations of noninvasive tools to predict ACR after LDLT, these tools can be used easily in the clinical setting. A cut-off value of 6.49 for NLR showed a sensitivity of 80.4% and a specificity of 73.3% in patients who underwent ABOc LDLT in this study. NLR showed a lower value 3.5 days prior to liver biopsy in patients with ACR.
Protocol biopsies can identify subclinical degrees of ACR and detect the tissue change of the liver graft early [27]. For these reasons, our center performed a protocol liver biopsy on a postoperative day 7. It is helpful to detect the patient without the sign of graft dysfunction. The benefits of treatment of subclinical rejection and the clinical utility of protocol liver biopsy are controversial [28]. In our study, during follow-up, 2 patients (13.3%) developed chronic rejection without proper management because they were not shown any sign of graft dysfunction. Therefore, it is important to detect subclinical rejection using an easy tool. For these reasons, monitoring of noninvasive tools such as NLR can reduce the possibility of liver biopsy related complications and early detection for subclinical ACR.
This study has several limitations. First, we analyzed the patients who underwent ABOc LDLT; ABO-incompatible (ABOi) LDLT and deceased donor LT were excluded from the analysis. In ABOi LDLT, peripheral B cells are eradicated to prevent a posttransplant rebound rise of isoagglutinin by surgical or pharmacological intervention [27]. This depletes antigen presentation of B cells to T cells, cytokine production facilitating T-cell polarization, antibody production, and tertiary lymphoid organ generation [29]. Therefore, these continuous B-cell suppression effects may also affect T-cell proliferation required for ACR. Thus ABOi LDLT patients were excluded from our study. In patients who underwent deceased donor liver transplant, the recipient's condition, graft status, and immunologic response could be different during peritransplant period; hence, these patients were excluded from the analysis as well.
Second, the number of enrolled patients was too small; validation with a large number of patients is needed to confirm the result of this study. Third, we had the results of liver biopsy only after LDLT. Even though the values of NLR were similar between the 2 groups 4 weeks prior to LDLT and on the day of LT, pathologic findings itself were not compared at that time.
Despite these limitations of this study, NLR is an easily obtainable and noninvasive tool that can help reveal the subclinical status of the liver graft. Serial monitoring of these ratios will help to defect of subclinical rejection in ABOc LDLT before liver biopsy. However, we should be confirmed through further multicenter and prospective study in large populations to validate these observations.
Go to :
 XML Download