

 PDF
PDF Citation
 Print
Print


INTRODUCTION
Neuroblastoma (NB) stem from the adrenal glands [1] and appear as a type of extracranial solid tumors occurring in children, which constitute 15% of child deaths from cancers [23], with the incidence rate being 1/7,000–1/8,000. Multimodal therapy currently seems an effective treatment for NB, which includes operation, chemotherapy, radiotherapy and immunotherapy [45678]. Generally, children with low-risk NB have a good prognosis and seldom need intensified therapy [91011], while patients with high-risk NB are diagnosed with obvious tumor progression, showing a bad prognosis, with the long-term survival rate being 50% [1213].
Contemporarily, there are 2 major staging systems of NB—International Neuroblastoma Risk Group Staging System (INRGSS) and International Neuroblastoma Staging System (INSS). According to INRGSS put into effect in 2008, NB was classified into 4 risk groups; very low risk, low risk, intermediate risk, or high risk, based on age (months), histologic category, grade of tumor, differentiation, MYCN, 11q aberration and ploidy [141516]. INSS, used previously [17], was mainly based on the surgical treatment, not taking other factors into account. However, INRGSS and INSS were both applied solely in determining the intensity of the treatment, though they failed to assist in predicting the overall survival individually.
Fortunately, a nomogram was proposed as a predictive modelling by means of multivariate regression analysis, and it was widely accepted owing to its accuracy, objectivity, and visualization [18192021]. Due to its excellent performance in forecast, the nomogram was admitted into the National Comprehensive Cancer Network guideline [22]. Currently, the existing predictive models of survival rate of patients with NB worked on the expression of certain gene or protein [23], and statistics regarding the expression were hard to attain and costly. As we were preparing this paper, a study based on the therapeutically applicable research to generate effective treatment (TARGET) database reported a nomogram for the prognosis prediction of NB [24]. However, this study only included 3 independent prognostic factors of age, INSS, and ploidy. Consequently, we researchers took advantage of the common and easy-to-get clinicopathologic data in the Surveillance, Epidemiology, and End Results (SEER) database, constructing the predictive modelling of NB and then assessing its validity and accuracy via internal and external validation.
METHODS
Patients
In this study, the latest clinical data of NB in SEER database was extracted with the publication time ranging from 2000 to 2016. The pathological type we searched for was adolescents and young adults (AYA) site recode/WHO 2008 definition: 9.1.2 Neuroblastoma.
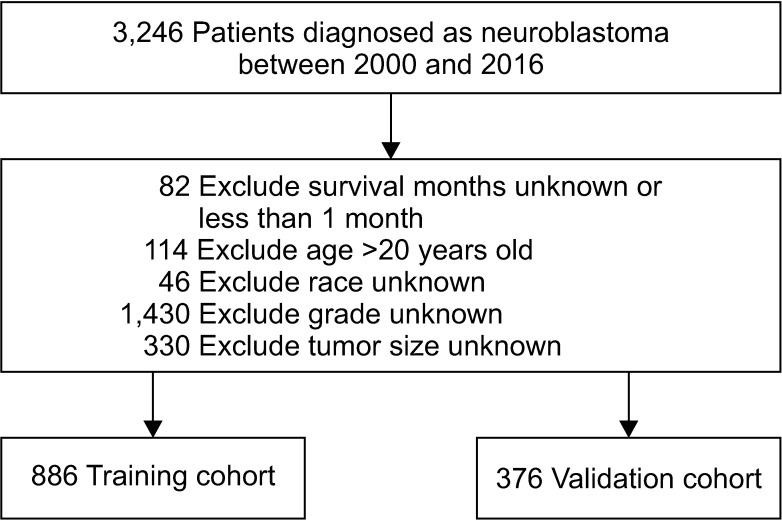
Exclusion standards was (1) patients were over 20 years-old; (2) the clinical data of patients were not recorded (including race, survival period, staging, or tumor size); (3) patients had less-than-one-month survival period. The study had been approved by the Institutional Review Board of The First Affiliated Hospital of Guangxi Medical University (approval number: 2018 (KY-E-104)). The informed consent from the subjects was exempted. The registration number we used to acquire clinical data from the SEER database was 12080-Nov2018. The cases included were randomly divided into training (70.2%) and validation cohorts (29.8%).
Variables
The variables selected for the research involved survival condition, survival time, age, sex, race, grade, radiotherapy, chemotherapy, tumor size, and tumor site. The age item consisted of two cohorts; <2 years old and 2–20 years old, which was built on INRGSS and INSS [12]. Eighteen months was used as a grading standard. The age of 2 years old was determined as a cutoff point. Races included whites, blacks, and others (American Indian/Alaskan Native, Asian/Pacific Islander). There were 4 grading levels: well differentiated (grade I); moderately differentiated (grade II); poorly differentiated (grade III); undifferentiated, anaplastic (grade IV). Tumor sites included A (adrenal gland), B (soft tissue including heart), C (retroperitoneum), D (mediastinum and other respiratory organs), and E (other). Tumor size was measured as <5 cm, 5.1–10 cm, 10.1–15 cm, and >15 cm.
Statistical analyses
The survival curves were drawn with a Kaplan-Meier estimator to investigate the influences of certain single factors on overall survival. Also, least absolute shrinkage and selection operator (LASSO) regression was applied to further select the prognostic variables for NB. LASSO regression was perceived as a well-performed method for variable selection, as it could preclude overfitting and include the optimal predictive factors into modelling [2526]. Having selected the variables, we began to construct the nomogram by Cox model to estimate the 1-, 3-, and 5-year overall survival rates. Additionally, receiver operating characteristic (ROC) curves were drawn to evaluate the predictive accuracy and calibration curves were used to determine whether the average survival rate was consistent with the predicted one. The differentiation was statistically significant if P < 0.05.
The statistical analysis was carried out with R ver. 3.6.0 (R Foundation for Statistical Computing, Vienna, Austria; http://www.r-project.org), which included foreign, survival, glmnet, caret, rms, timeROC packages [27].
RESULTS
Clinicopathological features
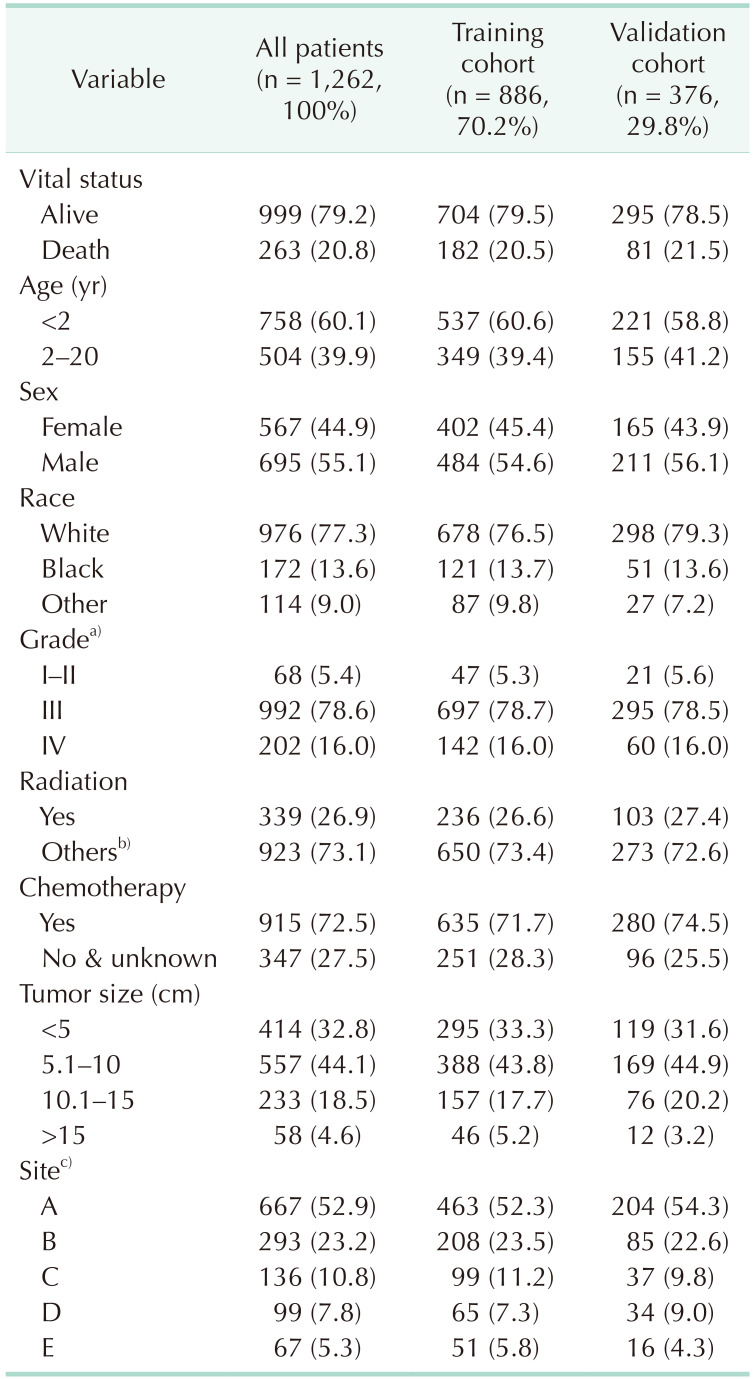
A total of 3,264 patients were extracted from the SEER database. We selected the data by the exclusion standards, and the specific selection process was shown in Fig. 1. Eventually, 1,262 patients were collected for the current research (Table 1). It was revealed that patients under 2 years represented the largest proportion, at 60.1% (758 patients). The older the children grow, the slighter the chance of suffering from NB is. Among these patients, males (695, 55.1%) outnumbered females. In terms of race, the number of whites (77.3%) was considerably higher than that of blacks (13.6%) and other races (9.0%). With respect to the grading, patients of grade III comprised the greatest percentage at 78.6%. Of these cases, 72.5% had received chemotherapy, while 26.9% had been treated with radiotherapy. The tumor size was mainly <5 cm or 5.1–10 cm, with these 2 cohorts accounting for 32.8% and 44.1%, respectively. Tumor site is mainly concentrated in the adrenal gland and soft tissue including heart, accounting for 52.9% and 23.2%, respectively.
Variable selection
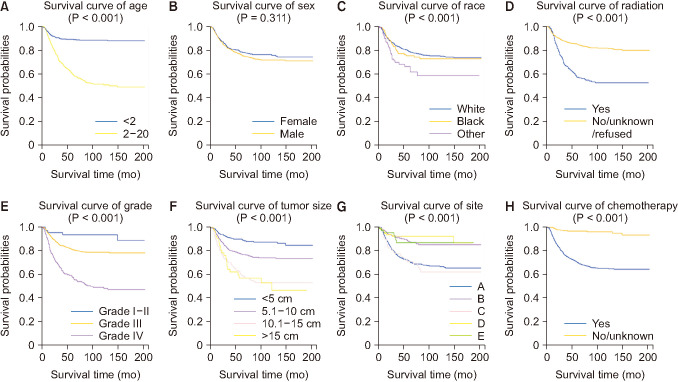
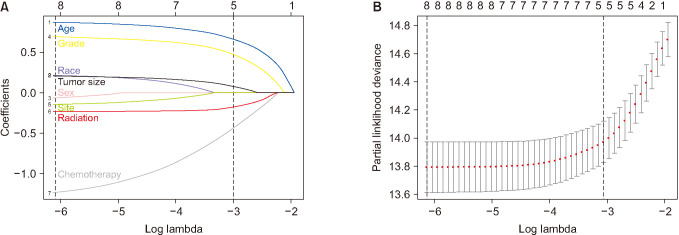
Kaplan-Meier survival analyses were conducted on the age, sex, race, tumor grade, radiotherapy, chemotherapy, tumor site, and tumor size. The findings showed that all these factors except sex (P = 0.311) exerted substantial impacts on survival time, with P < 0.05 (Fig. 2). In addition, patients under the age of 2 years had a noticeably higher overall survival rate than those from 2–20 years of age. Moreover, the overall rate of the whites was higher than that of the blacks or other races. Furthermore, the influence of sex seemed minimal. Also, patients at grade III or IV had remarkably lower overall survival, compared with those at grade I or II. Furthermore, radiotherapy and chemotherapy were related with lower overall survival rate. Finally, smaller tumor size boded well for survival and prognosis. We employed LASSO regression for further selection of prognostic variables, with each curve representing the changes of an independent variable. As the log (λ) increased, the 8 variables (nonzero coefficient) of minimum criteria (the left dotted line) included age, sex, race, tumor grade, radiotherapy, chemotherapy, tumor site, and tumor size (Fig. 3).
Construction and validation of nomogram
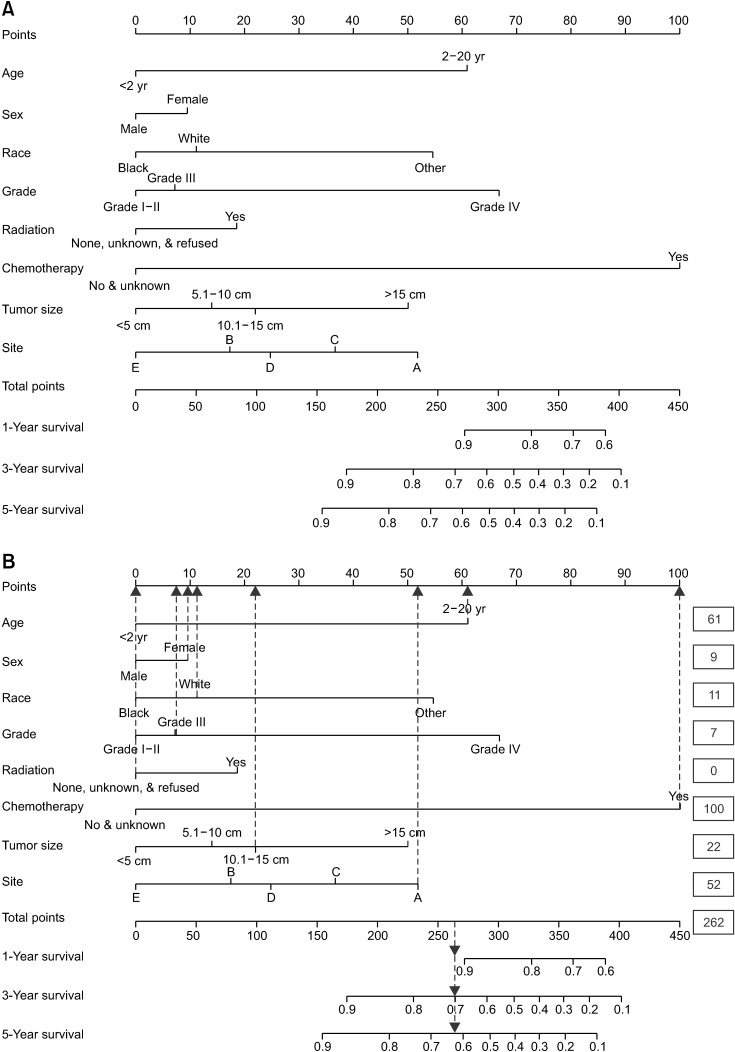
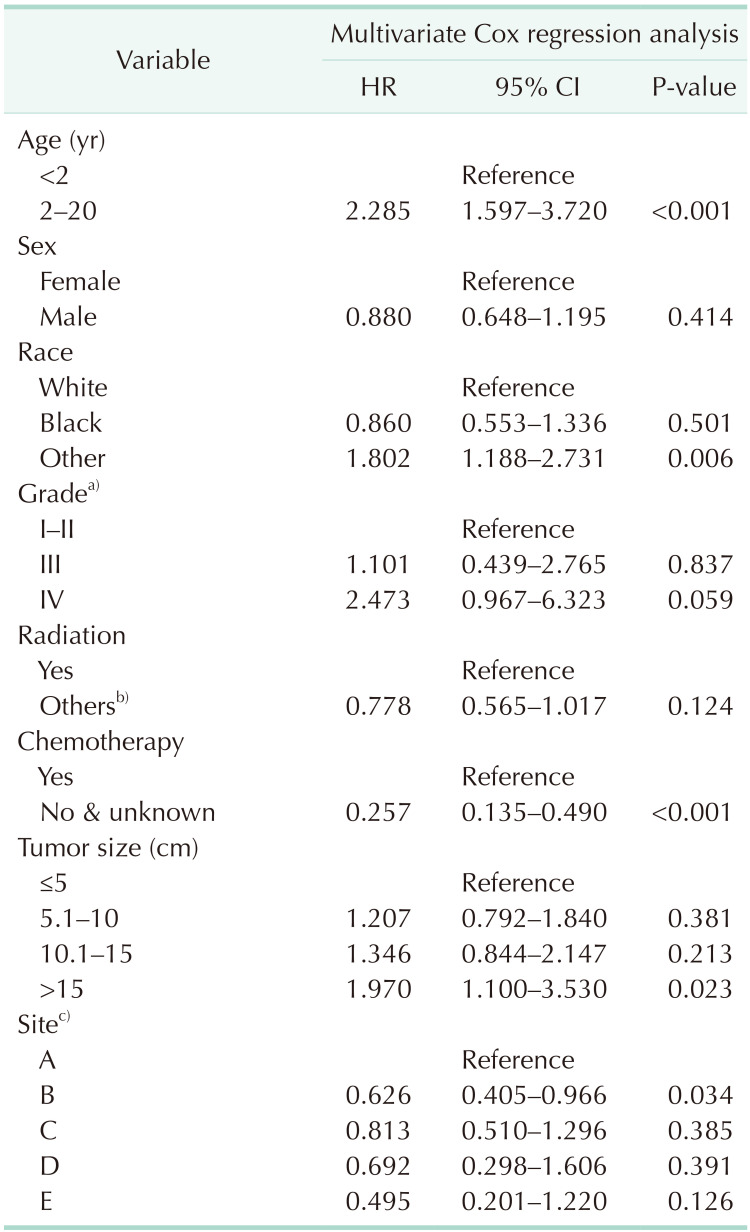
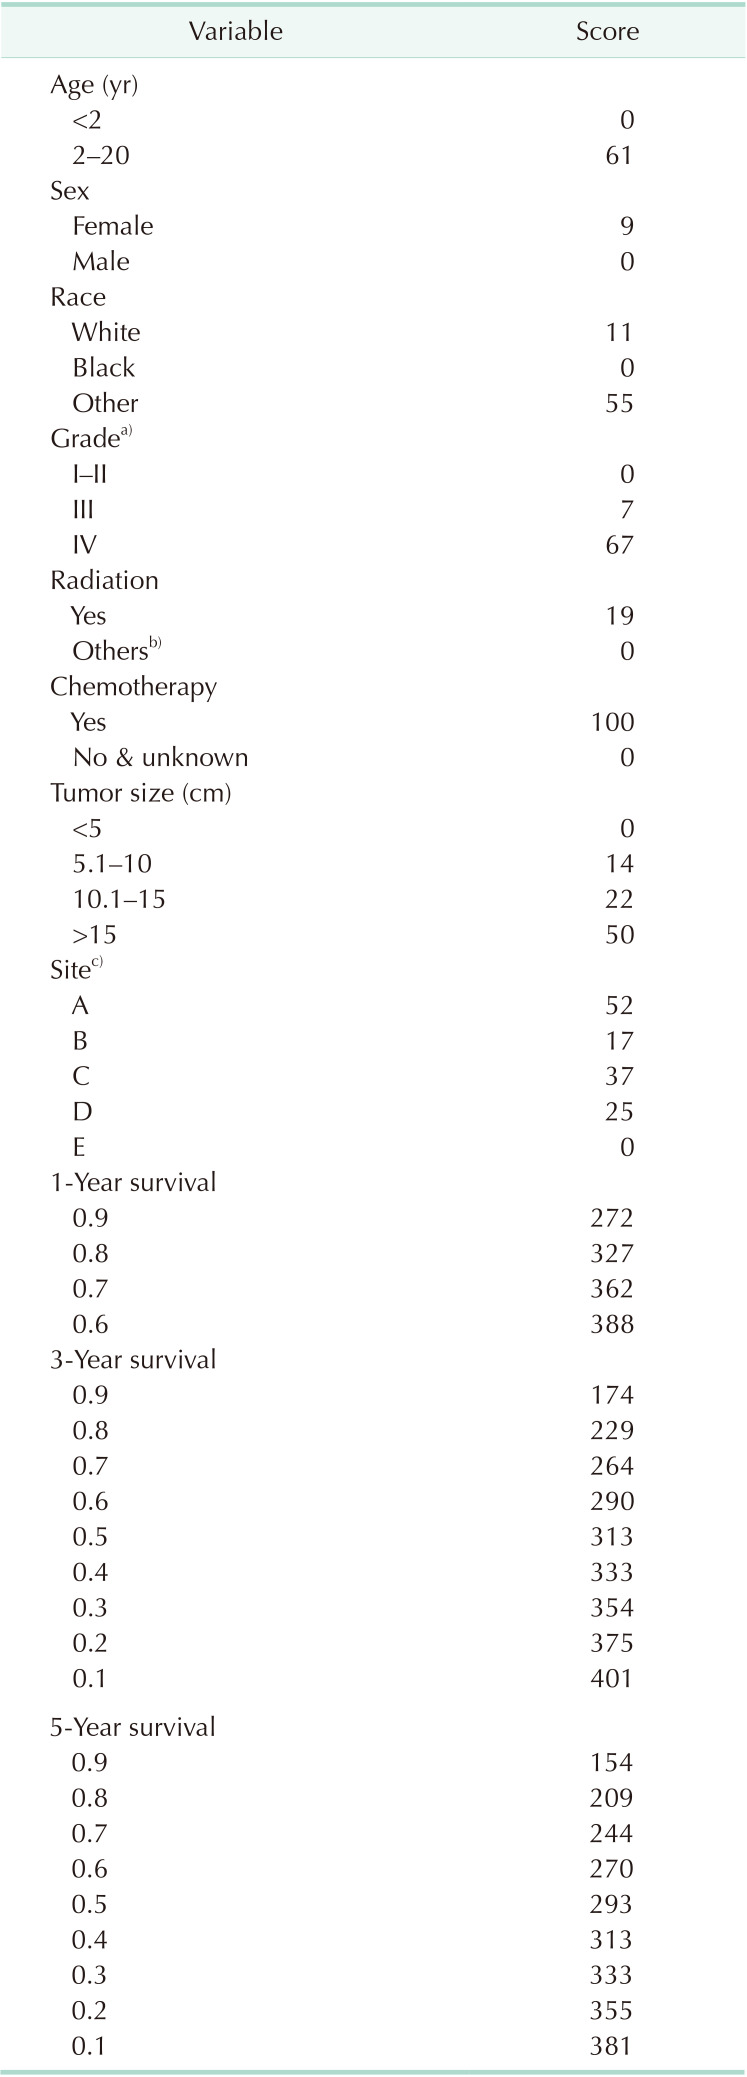
These 1,262 patients were randomly divided into training cohort (n = 886, 70.2%) and validation cohort (n = 376, 29.8%) (Table 1). Based on the 8 independent prognostic variables (including age, sex, race, tumor grade, radiotherapy, chemotherapy, tumor site, and tumor size), we constructed nomogram for prognosis of NB by using the data of training cohort (Table 2, Fig. 4). On the left were the names of variables, and each had a corresponding score on the top. The total scores of all the variables were used to estimate the 1-, 3- and 5-year overall survival. The nomogram indicated that grades III and IV played a vital role in prognosis. The scores of these variables and the corresponding survival rate were illustrated in Table 3. More specifically, the data downloaded showed that a 3-year-old white girl, diagnosed at Grade III, had no radiotherapy treatment but underwent chemotherapy, with tumor site in the adrenal gland, and tumor size being 13 cm. The total score for this patient was 262, which was calculated by adding the score of each variable (61 + 9 + 11 + 7 + 0 + 100 + 22 + 52 = 262). Thereby, the 1-, 3-, and 5-year survival rates of this patient were more than 90%, 70%, and 62%, respectively (Fig. 4B).
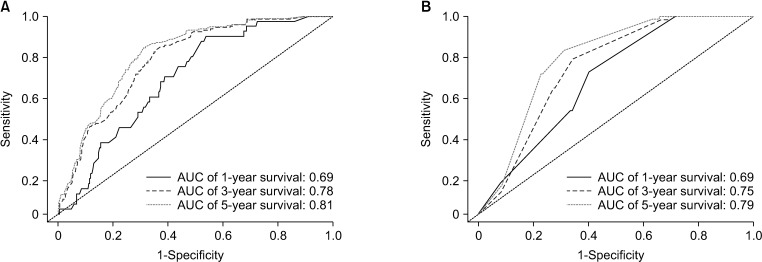
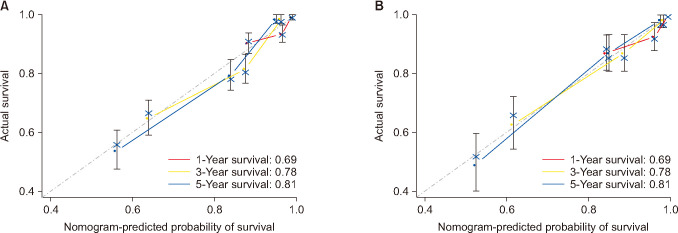
Subsequently, the nomogram was validated internally and externally. The internal validation revealed that the area under the curves (AUCs) of ROC curves of 1-, 3-, and 5-year overall survival were 0.69, 0.78, and 0.81, respectively (Fig. 5). Accordingly, the external validation showed that the AUCs of ROC curves of 1-, 3-, and 5-year overall survival were 0.69, 0.75, and 0.79, respectively. Both methods of validation demonstrated that the predictive calibration curves were consistent with standard curves, particularly in the aspect of 5-year survival rate (Fig. 6).
DISCUSSION
By mining the SEER database, we, for the first time, established and validated a nomogram that could facilitate a survival rate prediction for patients with NB. This predictive modelling involved 8 prognostic factors; age, sex, race, grade, radiotherapy, chemotherapy, tumor site, and tumor size. This nomogram could be applied to forecast 1-, 3- and 5-year survival rates for patients with NB under the age of 20 years. Additionally, ROC curves were combined with calibration curves to assess the accuracy of the predictive modelling in cohorts of training and validation. Surprisingly, AUCs of ROC curves were greater than or equal to 0.69 (Fig. 5). The calibration curves suggested that a prediction by nomogram was in accordance with the observation (Fig. 6). All these results confirmed that the nomogram had considerable prognostic potential, which was validated internally and externally. Equally important, doctors and patients could make use of it to calculate the overall survival rate, which would better the treatment and follow-up plans.
In our research, the nomogram indicated that grade remained an essential predictive factor, the score increasing with the escalating grade. This was consistent with results by Pinto et al. [12], Cohn et al. [16], and London et al. [28]. In addition, patients who needed radiotherapy and chemotherapy had higher scores, which was partly because these patients had high-grade tumor or larger tumor size, or because radiotherapy and chemotherapy would produce adverse effects [4629]. In terms of race, the number of whites (77.3%) was considerably higher than that of blacks (13.6%) and other races (9.0%) (Table 1). Thus, the influences of race on survival prognosis could be better determined if we could include more data regarding race.
Basically, the novel predictive nomogram integrated with multiple variables including age, sex, race, tumor grade, radiotherapy, chemotherapy, tumor site, and tumor size from SEER possess the potential to be a new tool in predicting the survival rate of NB patients. The nomogram we made had the following advantages. First, there were a large number of patients involved in the modelling, which could reduce the differentiations among hospitals. Second, no expensive or hard-to-get factors were included. The modelling was constructed on common clinical statistics (age, sex, race, grade, radiotherapy, chemotherapy, tumor site, and tumor size), which could make the model easy to use and acceptable to other doctors and patients. Third, the nomogram could accurately predict 1-, 3-, and 5-year overall survival of patients with NB.
However, there were some limitations in our research. For a start, it was a retrospective study, and some cases were removed due to incomplete data. Additionally, the modelling solely entailed some common clinical data, which was devoid of MYCN genes, chromosome ploidy, grading data concerning INSS and INRGSS. Therefore, we could hardly estimate the influences of these lacking factors on the prognosis, which explains why the AUC values were moderate in our research. Furthermore, all these cases were collected in the United States alone, which failed to represent the treatment and prognosis of patients with NB in other parts of the world. To improve our research, we intend to cooperate with large hospitals to collect the clinicopathological information of patients with NB. Furthermore, a revised modelling should include molecular factors like MYCN genes, chromosome ploidy, and so forth.
For the first time, we researchers established and validated a predictive modelling of NB—nomogram, based on the data collected from SEER. Doctors and patients could take advantage of the modelling to acquire an accurate prognosis, which could help doctors work out better diagnosis, treatment, and follow-up plans.
 XML Download