

 PDF
PDF Citation
 Print
Print


INTRODUCTION
Hepatocellular carcinoma (HCC) is one of the most common malignancies and leading causes of cancer-related deaths worldwide. Hepatic resection (HR) is considered the first-line treatment in patients with preserved hepatic function; however, tumor recurrence occurs frequently and unpredictably after HR [1].
We previously demonstrated that the score derived from the multiplication of α-FP, des-γ-carboxyprothrombin (DCP or proteins induced by vitamin K antagonist or absence-II), and tumor volume (TV) (α-FP-DCP-TV score or simply ADV score) is an integrated surrogate marker of postresection prognosis in solitary HCCs [2] and regarded as a quantifiable parameter reflecting tumor aggressiveness. It was also proven to be valid in patients with preoperatively treated HCCs [3].
The prognostic role of the ADV score for HCC resection has been validated in single-center and multicenter studies [234]; however, most patients in these studies belonged to a single high-volume institution where the ADV score had been originally developed. Thus, it is necessary to externally validate the clinical impact of the ADV score in high-volume multicenter cohorts.
In this study, we assessed the prognostic impact of the ADV score in patients who underwent HCC resection and were registered in the Korea Liver Cancer Registry (KLCR) database.
METHODS
Study design
The Ministry of Health and Welfare of Korea initiated a nationwide cancer registry in 1980, called the Korea Central Cancer Registry. In concordance with the Korea Central Cancer Registry, the Korean Liver Cancer Study group established the KLCR as a nationwide HCC cohort. Totally, 4,354 patients with HCC were registered in the KLCR database from January 2008 to December 2012 and were followed up with the Korea Central Cancer Registry until December 2016.
Of these patients, we selected 1,439 who underwent HR. Thereafter, we excluded patients who lack data on important clinical or laboratory parameters, including tumor size, tumor number, preoperative α-FP value, and preoperative DCP value. We also excluded those who underwent liver transplantation after HR because transplantation can change the postresection prognosis. Finally, we selected 1,390 patients as the whole study cohort.
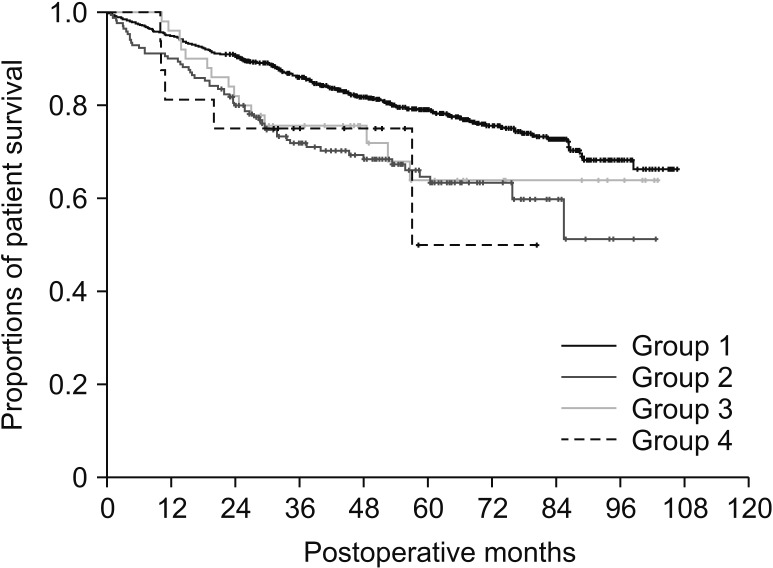
The 1,390 total patients were divided into 4 groups according to precedent HCC treatment and number of tumors on pathologic evaluation: naive single tumor group (group 1, n = 1,154), naive multiple tumor group (group 2, n = 170), treated single tumor group (group 3, n = 50), and treated multiple tumor group (group 4, n = 16). Patients who underwent locoregional HCC treatment once before HR were classified into the treated tumor groups regardless of the treatment response because such treatments change the values of the parameters of the ADV score. Patients who had received multiple sessions of locoregional HCC treatment were excluded because of their small number and complex recurrent patterns.
This study was performed in accordance with the ethical guidelines of the 1975 Declaration of Helsinki. The Institutional Review Board (IRB) of Asan Medical Center approved this study protocol (2018-1508). KLCR database was collected after obtaining approval of the IRB of all participated institutions.
The primary aim of this study was to estimate overall patient survival according to the preoperative and postoperative ADV scores, and the secondary aim was to determine the cutoff values of the ADV score for clinical application.
Treatment
Because the KLCR database does not provide information on the types and extents of HR, we simply described surgical resection of HCC as HR. Any treatment for postresection recurrence, including various locoregional treatments and systemic chemotherapy but excluding liver transplantation, was permissible. The general principles of treatment for recurrent HCC are described elsewhere [15].
ADV score
The values of α-FP and DCP measured before HR were used. TV was calculated from the maximal tumor diameter under an assumption that the tumor is spherical. Multiplication of α-FP (ng/mL), DCP (mAU/mL), and TV (mL) yields the ADV score, which is expressed in the logarithmic scale (log10 is simply presented as log) [2].
Postoperative TV was calculated by the information described at the pathology report, which was used for calculation of postoperative ADV score. In addition, the preoperative TV was calculated with the preoperative imaging findings, which was used for calculation of preoperative ADV score. If there were multiple HCC tumors, total TV was estimated as the TV of the largest tumor multiplied by the number of tumors. This TV weighted by the number of tumors is greater than the actual total TV, thus providing some weighted prognostic value from the number of tumors.
Data collection
Clinical parameters were collected, including age, sex, presence of chronic illness such as hypertension or diabetes mellitus, suspected etiologies of HCC such as viral hepatitis or heavy alcohol intake, Child-Pugh score and classification, model for end-stage liver disease score, Barcelona Clinic Liver Cancer (BCLC) stage at the time of HR, and TNM stage based on preoperative imaging and pathologic findings. Collected laboratory parameters included platelet, serum sodium, albumin, total bilirubin, creatinine, alanine aminotransferase, α-FP, and DCP levels and international normalized ratio. Other clinical or laboratory parameters were excluded owing to insufficient data in the registry.
Statistical analysis
Numerical data are presented as means with standard deviations or as medians with ranges. Continuous variables were compared using Student t-test, and incidence variables were compared using the chi-square test or Fisher exact test. Overall survival period was computed from the day of HR until the most recent follow-up or death. Survival time and rate were estimated using the Kaplan-Meier method; differences between groups were assessed using the log-rank test. A P-value of <0.05 was considered statistically significant. Statistical analyses were performed using IBM SPSS Statistics ver. 22.0 (IBM Co., Armonk, NY, USA).
RESULTS
Patient demographics
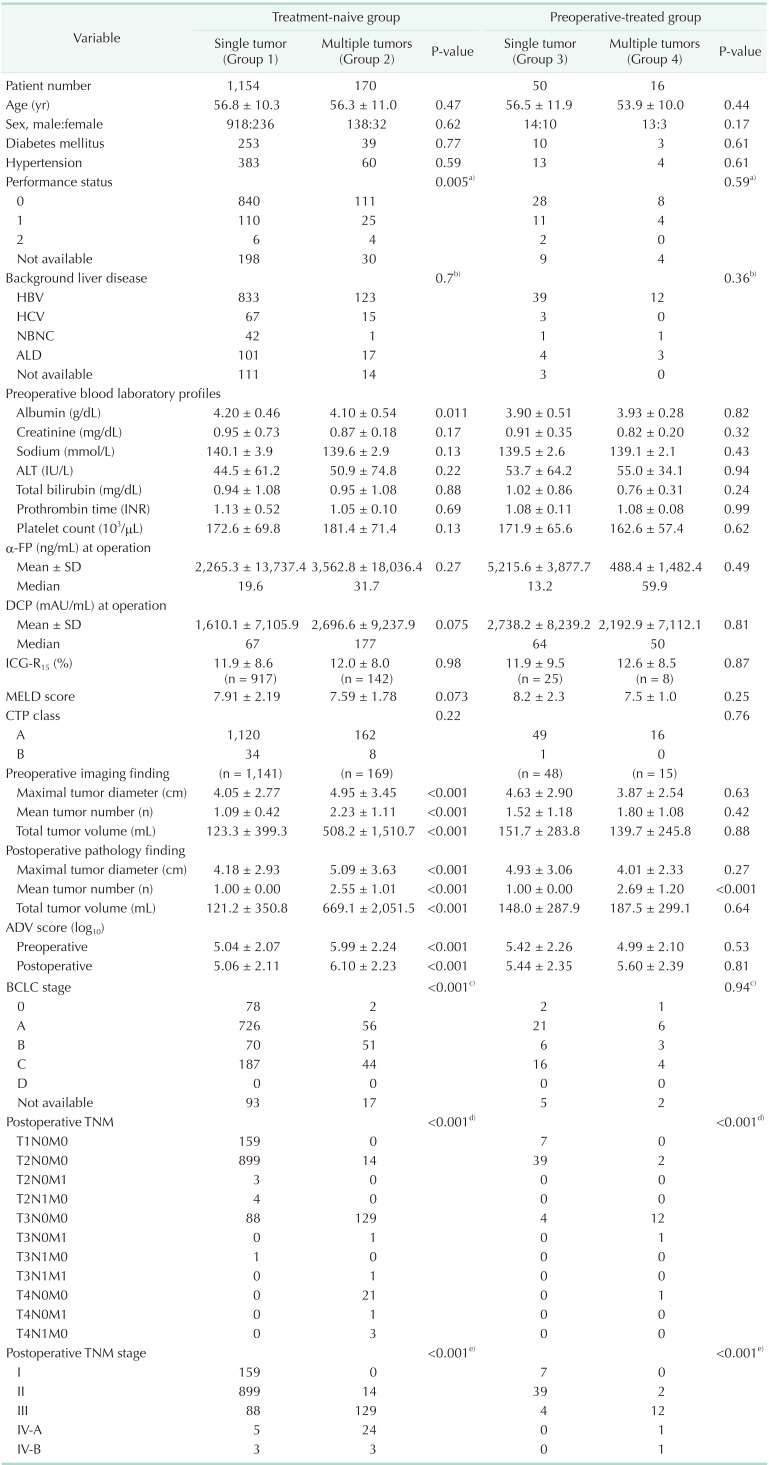
All 1,390 patients were classified according to the number of tumors and preoperative HCC treatment; their clinicopathologic features are summarized in Table 1.
The primary liver diseases were HBV infection in 1,007 patients (72.4%), HCV infection in 85 (6.1%), non-HBV non-HCV in 45 (3.2%), alcoholic liver disease in 125 (9.0%), and unknown (missing data) in 128 (9.2%).
In patients belonging to the single treatment-naive tumor group (group 1), the preoperative imaging diagnosis (n = 1,141) was a single tumor in 1,069 patients (93.7%), 2 tumors in 57 (5.0%), and 3 or more tumors in 15 (1.3%).
Patients in the preoperative-treated tumor groups (groups 3 and 4) underwent HR 164.7 ± 276.1 days (median, 54 days) after HCC treatment (radiofrequency ablation in 9, transarterial chemoembolization in 55, and transarterial radioembolization in 2).
During the follow-up period of 50.0 ± 24.9 months (median, 47.1 months), 315 of 1,390 patients (22.7%) died of HCC recurrence (n = 292, 92.7%) and other causes (n = 23, 7.3%). Overall patient survival curves of the 4 groups are presented in Fig. 1. The survival rate in group 1 was higher than that in the other 3 groups (P < 0.001); however, it was similar among the other 3 groups (P = 0.85).
Relationship between tumor size and tumor markers
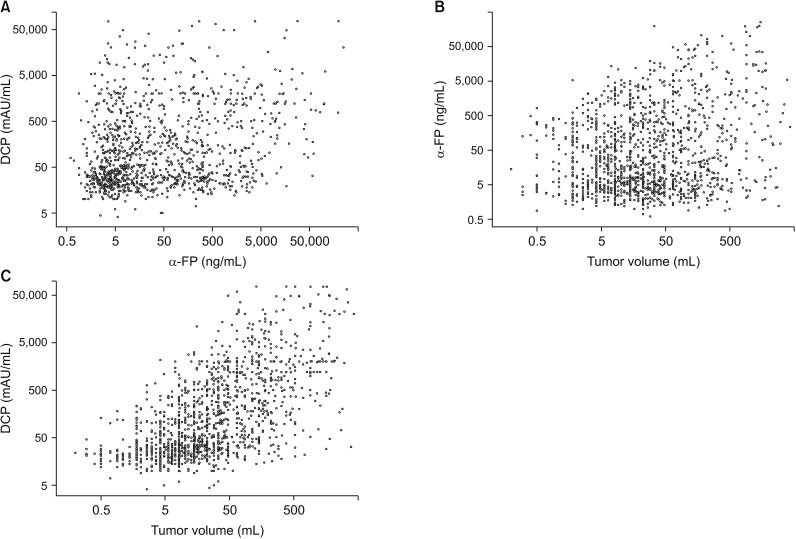
In 1 154 patients belonging to the treatment-naive single tumor group (group 1), the association of α-FP, DCP, and TV is presented in 2-dimensional scatter plots (Fig. 2). There was no significant correlation between the following combinations: α-FP and DCP (r2 = 0.040, r = 0.200, P < 0.001), TV and α-FP (r2 = 0.016, r = 0.126, P < 0.001), and TV and DCP (r2 = 0.037, r = 0.192, P < 0.001). These results indicate that α-FP, DCP, and TV are independent parameters.
Patient survival according to postoperative ADV score in patients with a single treatment-naive HCC
Of 1,154 patients with single treatment-naive tumor in group 1, 239 (20.7%) died during the mean follow-up period of 51.3 ± 24.8 months (median, 48.2 months). Their 1-, 2-, 3-, and 5-year overall survival rates were 94.9%, 90.6%, 86.0%, and 79.0%, respectively (Fig. 1).
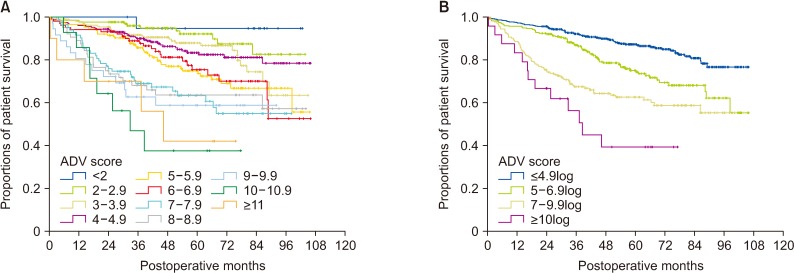
The postoperative ADV scores were stratified by an interval of 1log (10-fold). The distribution of ADV scores was as follows: <2log in 26 (2.3%), 2–2.9log in 129 (11.2%), 3–3.9log in 248 (21.5%), 4–4.9log in 243 (21.1%), 5–5.9log in 168 (14.6%), 6–6.9log in 117 (10.1%), 7–7.9log in 84 (7.3%), 8–8.9log in 68 (5.9%), 9–9.9log in 48 (4.2%), 10–10.9log in 12 (1.0%), and ≥11log in 11 patients (1.0%).
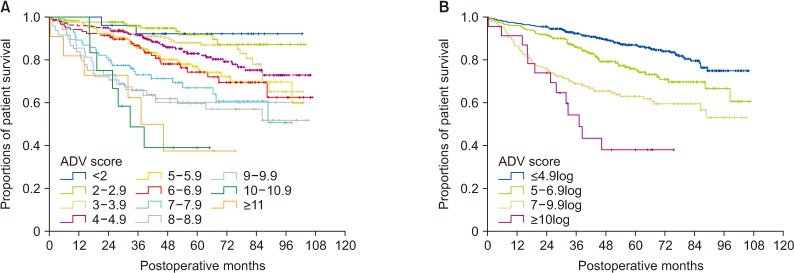
The overall patient survival rate in each group was closely correlated with the ADV score (P < 0.001), in which the 5-year survival rates were 92.1% in ADV <2log, 91.9% in ADV 2–2.9log, 87.9% in ADV 3–3.9log, 83.0% in ADV 4–4.9log, 76.8% in ADV 5–5.9log, 74.3% in ADV 6–6.9log, 66.9% in 7–7.9log, 59.6% in ADV 8–8.9log, 60.1% in ADV 9–9.9log, 38.9% in ADV 10–10.9log, and 37.4% in ADV ≥11log (Fig. 3A).
Through cluster analysis, the postoperative ADV scores were stratified as ADV ≤4.9log, ADV 5–6.9log, ADV 7–9.9log, and ADV ≥10log, showing great prognostic contrast (P < 0.001) (Fig. 3B).
Patient survival according to postoperative ADV score in patients with multiple treatment-naive HCCs
In 170 patients with multiple treatment-naive tumors in group 2, 56 (32.9%) died during the mean follow-up period of 43.0 ± 23.9 months (median, 40.8 months). Their 1-, 2-, 3-, and 5-year overall survival rates were 94.9%, 90.6%, 86.0%, and 79.0%, respectively (Fig. 1).
The overall patient survival rate in each group was crudely correlated with the postoperative ADV score (P < 0.001), in which their 5-year survival rates were 100% in ADV 2–2.9log (n = 5), 100% in ADV 3–3.9log (n = 17), 67.3% in ADV 4–4.9log (n = 35), 64.0% in ADV 5–5.9log (n = 41), 40.93% in ADV 6–6.9log (n = 19), 66.0% in 7–7.9log (n = 21), 50.0% in ADV 8–8.9log (n = 12), 80.0% in ADV 9–9.9log (n = 5), 50.0% in ADV 10–10.9log (n = 5), and 25.0% in ADV ≥11log (n = 10) (Fig. 4A).
Through cluster analysis, the postoperative ADV scores were stratified as ADV ≤ 4.9log, ADV 5–6.9log, ADV 7–9.9log, and ADV ≥ 10log, showing a noticeable prognostic contrast (P = 0.001) (Fig. 4B).
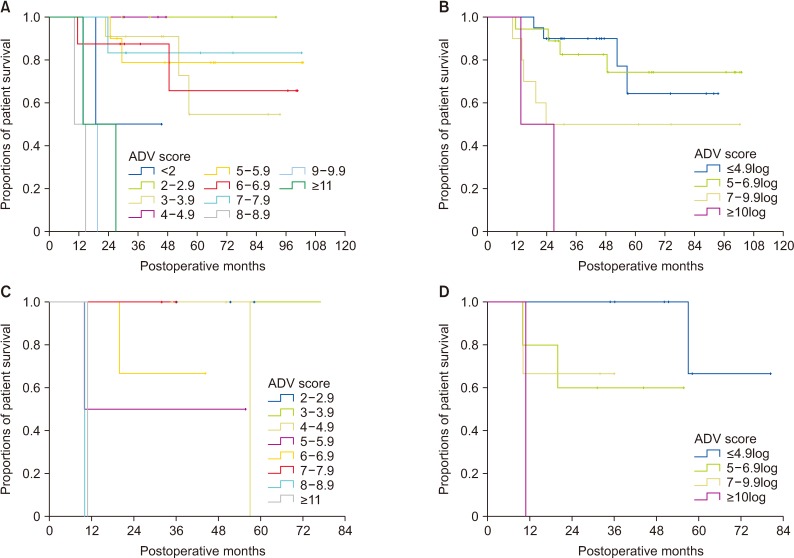
Patient survival according to postoperative ADV score in patients with preoperative-treated HCCs
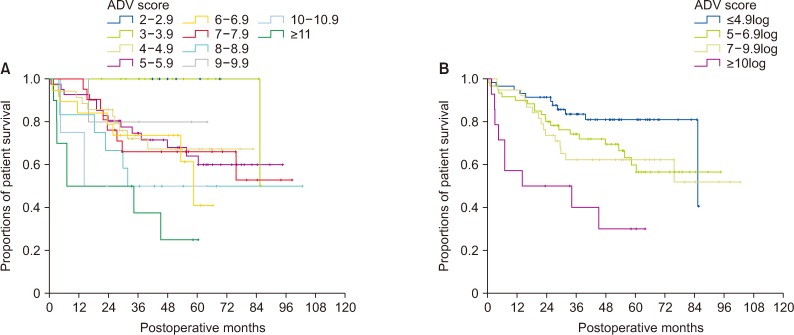
In 50 patients with a single preoperative-treated tumor in group 3, 15 (30.0%) died during the mean follow-up period of 48.5 ± 28.5 months (median, 44.1 months). Their 1-, 2-, 3-, and 5-year overall survival rates were 96.0%, 82.0%, 75.6%, and 63.9%, respectively (Fig. 1). The overall patient survival rate in each group was crudely correlated with the postoperative ADV score (P = 0.003) (Fig. 5A). Through cluster analysis, the postoperative ADV scores were stratified as ADV ≤ 4.9log, ADV 5–6.9log, ADV 7–9.9log, and ADV ≥ 10log, showing a significant prognostic contrast (P = 0.007) (Fig. 5B).
In 16 patients with multiple preoperative-treated tumors in group 4, 5 (31.3%) died during the mean follow-up period of 38.6 ± 20.0 months (median, 36.0 months). Their 1-, 2-, 3-, and 5-year overall survival rates were 81.3%, 75.0%, 75.0%, and 50.0%, respectively (Fig. 1). The overall patient survival rate in each group was crudely correlated with the postoperative ADV score (P = 0.017) (Fig. 5C). Through cluster analysis, the postoperative ADV scores were stratified as ADV ≤ 4.9log, ADV 5–6.9log, ADV 7–9.9log, and ADV ≥ 10log, showing a significant prognostic contrast (P = 0.031) (Fig. 5D).
Prediction of patient survival using the preoperative ADV score based on the preoperative finding in patients diagnosed as having single treatment-naive HCC
Of 1,106 patients diagnosed as having single treatment-naive tumor in the preoperative imaging study, 227 (20.5%) died during the mean follow-up period of 50.9 ± 24.5 months (median, 47.5 months). Their 1-, 2-, 3-, and 5-year overall survival rates were 95.1%, 90.7%, 85.9%, and 79.0%, respectively.
The preoperative ADV scores were stratified by an interval of 1log (10-fold). The distribution of the ADV scores was as follows: <2log in 20 (1.8%), 2–2.9log in 133 (12.0%), 3–3.9log in 238 (21.5%), 4–4.9log in 230 (20.8%), 5–5.9log in 176 (15.9%), 6–6.9log in 102 (9.2%), 7–7.9log in 83 (7.5%), 8–8.9log in 64 (5.8%), 9–9.9log in 36 (3.3%), 10–10.9log in 14 (1.3%), and ≥11log in 10 patients (0.9%).
The overall patient survival rate in each group was closely correlated with the preoperative ADV score (P < 0.001), in which the 5-year survival rates were 94.7% in ADV < 2log, 92.1% in ADV 2–2.9log, 87.9% in ADV 3–3.9log, 83.4% in ADV 4–4.9log, 74.9% in ADV 5–5.9log, 75.4% in ADV 6–6.9log, 63.3% in 7–7.9log, 63.6% in ADV 8–8.9log, 58.8% in ADV 9–9.9log, 37.5% in ADV 10–10.9log, and 42.0% in ADV ≥11log (Fig. 6A).
Through cluster analysis, the preoperative ADV scores were stratified as ADV ≤ 4.9log, ADV 5–6.9log, ADV 7–9.9log and ADV ≥ 10log, showing a high prognostic contrast (P < 0.001) (Fig. 6B).
Survival analysis with postoperative TNM stage and BCLC stage in patients diagnosed as having naive HCC
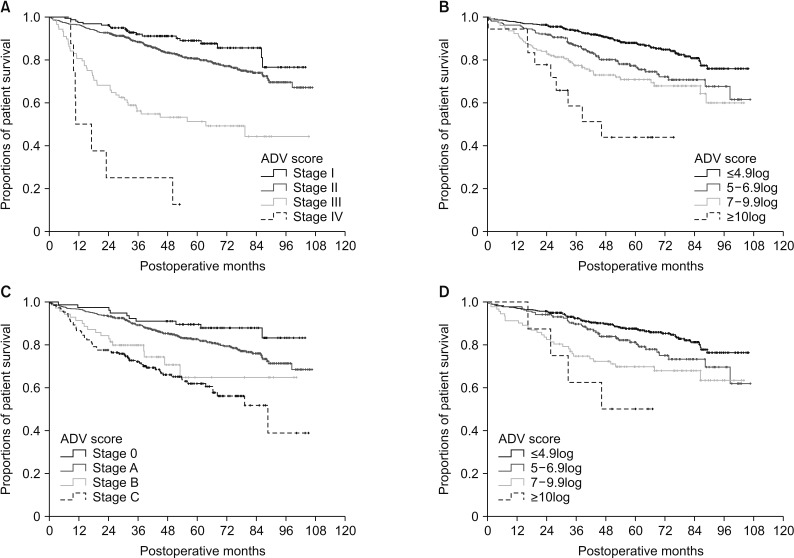
In 1,324 patients belonging to groups 1 and 2, survival analysis with the postoperative TNM stage showed a highly noticeable prognostic contrast (P < 0.001) (Fig. 7A). However, 1,072 of 1,324 patients (81.0%) had TNM stage I and II diseases; there was a relatively low prognostic difference between stages I and II (P = 0.034). When confining to the 1,058 patients belonging to TNM stages I and II, stratification with the postoperative ADV score increased the prognostic contrast (P < 0.001) (Fig. 7B).
In 1,324 patients belonging to groups 1 and 2, survival analysis with the BCLC stage also showed a highly noticeable prognostic contrast (P < 0.001) (Fig. 7C). However, 862 of 1,324 patients (65.1%) had BCLC stage 0 and A disease, and there was a marginal prognostic difference between stage 0 and A (P = 0.074). When confining to the 862 patients belonging to BCLC stage 0 and A, stratification with the postoperative ADV score increased the prognostic contrast (P < 0.001) (Fig. 7D).
DISCUSSION
It is difficult to predict postresection prognosis in patients with HCC because carcinogenesis and tumor biology in these patients are highly complex and heterogeneous. There are several clinically important individual predictors that can be used before HR (e.g., tumor size, tumor markers, and 18-fluorodeoxyglucose PET findings) and after HR (microvascular invasion [MVI]), as well various tumor staging systems for HCC [567891011].
The HCC tumor size has been accepted for a long time as one of the most important prognostic factors [11213]. The expression of tumor markers, such as α-FP and DCP, is highly variable in HCC, as this study shows. Thus, to enhance the prognostic impact of tumor markers, multiple tumor markers need to be integrated in a single score, such as the sum of the number of positive tumor markers or multiplication of α-FP and DCP with different cutoff values [1415161718]. However, the prognostic impact of these tumor markers is still not sufficiently high. Some specific imaging findings of gadoxetic acid-enhanced MRI and 18-fluoro-deoxyglucose PET indicate poor prognosis, but their prognostic impact is still debated.
MVI has been considered one of the most important prognostic parameters; however, because it is a pathologic finding, it is difficult to predict the status of MVI before HR. Many studies have predicted MVI using imaging findings (liver dynamic CT, gadoxetic acid-enhanced MRI, and 18-fluorodeoxyglucose PET), tumor markers (α-FP, DCP, and nextgeneration DCP), and their combination [1415161718192021222324]. The ADV score was also used for predicting MVI in a previous study, in which the area under the receiver-operating characteristic curve was as high as 0.788 [2]. These preoperative diagnostic approaches resulted in a significant increase in the discriminatory power for predicting MVI; however, their role is limited in clinical practice.
To overcome the demerits of individual prognostic parameters, we developed the ADV score as an integrated surrogate marker for postresection prognosis in HCC and as a quantifiable parameter reflecting tumor aggressiveness [2]. ADV score-dependent prognostic stratification was validated in 1 single-center study and 1 multicenter study [34], in which the ADV score was highly correlated with the postresection prognosis. The present study also demonstrated that the ADV score was proportionally correlated with patient survival. Considering that 92.7% of mortality cases were directly associated with HCC recurrence in this study, the ADV score must be proportionally correlated with tumor recurrence, as shown in previous studies [23425].
The ADV score was originally developed for patients with single treatment-naive HCC. To our knowledge, this is the first study to evaluate the prognostic impact of the ADV score in patients with multiple HCCs. Although the number of patients with multiple tumors was not large in this study, we believe that the ADV score is reliably correlated with the postresection prognosis. To apply the ADV score to multiple HCCs, the total TV was estimated as the TV of the largest tumor multiplied by the number of tumors. This calculation method results in a significantly larger total TV than the arithmetical summation of the TVs of individual tumors. We believe that the ADV score calculated using a TV weighted by the number of tumors can partially compensate for the high prognostic impact of tumor multiplicity. The prognosis of patients with multiple treatment-naive HCCs with ADV score < 4log was comparable to that of patients with single treatment-naive tumor; however, outcomes worsened rapidly along the stepwise increase in the ADV score beyond 4log. Thus, the calculation of total TV in multiple tumors requires further refinement.
The value of the ADV score can be significantly disturbed by preoperative locoregional treatment. We previously studied the prognostic impact of the ADV score in patients with downstaged or recurrent HCCs after preoperative locoregional treatment [3]. Unless complete radiologic or pathologic response occurs, some viable tumor portions remain, thus enabling the calculation of the ADV score before and after HR. Our previous study demonstrated that the ADV score was still valid for preoperative-treated single HCCs [3]. In contrast, the prognostic impact of preoperative locoregional treatment cannot be simply estimated because it can change the tumor biology. We previously reported that transarterial chemoembolization for small single HCCs adversely affects the postresection prognosis irrespective of the pathologic response up to 95% necrosis, and even the prognostic benefit from complete tumor necrosis is limited to the downstaging effect [2627]. Such adverse effects may be associated with residual tumor cells with worsened tumor biology [32728].
The ADV score enables predicting the postresection prognosis quantitatively. However, ADV scores with tenths-place value or 1log-interval stratification have too many and too narrow zones to allow physicians and surgeons to intuitively estimate the prognosis. Thus, some cutoff values are needed to apply the ADV score in clinical practice.
We previously reported that the reliable ADV score cutoff in single treatment-naive HCC was 4log for tumor recurrence and 5log for patient survival [23]. In this study, we adopted 3 cutoffs (5log, 7log, and 10log), by which our patients were stratified into 4 groups. We believe that patients with ADV ≤ 5log gain the most benefit from HR and those with ADV ≥ 10log gain the least benefit. Thus, we suggest using these 2 ADV cutoffs (5log and 10log) for patient survival.
The KLCR database provides preoperative imaging findings on tumor size and number, which enabled us to calculate the preoperative ADV score based on the preoperative finding. The ADV score-based results in patients with single treatment-naive tumor on preoperative imaging were comparable to those from the postoperative ADV score. This is not surprising because the diagnostic accuracy for tumor size and number is high enough with the combination of dynamic computed tomography and contrast-enhanced magnetic resonance imaging [29]. Such preoperative prognostic prediction is often helpful to decide the plan for HR, especially with respect to the extent of resection. We previously showed that anatomical HR is superior to nonanatomical HR in patients with an ADV score ≤ 4log for tumor recurrence and in patients with an ADV score ≤ 5log for patient survival regardless of preoperative treatment. Thus, even an HCC with a lower ADV score is eligible for aggressive surgical resection [34].
There are various tumor staging systems for HCC; each system has its unique merits and limitations. In groups 1 and 2 in this study, the TNM staging system showed a highly noticeable prognostic contrast; however, 81% of the patients belonged to stages I and II, and there was no prognostic difference between these 2 stages. Such a low power of discrepancy is less helpful in clinical practice. In contrast, additional application of the ADV score resulted in noticeable enhancement of prognostic contrast. This ADV score-derived enhancement was repeatedly seen in patients with BCLC stage 0 and A. We also showed that the ADV score combined with MVI, 18-fluoro-deoxyglucose PET findings, or gene signature test can enhance the prognostic predictive power of individual parameters [2425]. These findings indicate that the ADV score can be an additional predictive parameter combined with various HCC staging systems or other individual risk factors.
This study has limitations of note. This is a retrospective single-country cohort study in a HBV-endemic area. It is necessary to validate the ADV score in other geographic regions before our results can be extended to patients with HCC of various causes. Another major limitation is the lack of recurrence analysis because detailed information on tumor recurrence is not obtainable from the KLCR database. However, the survival status of all patients was followed up completely together with the government-led Korea Central Cancer Registry.
In conclusion, this external validation study strongly suggests that both the preoperative and postoperative ADV scores are integrated surrogate markers for postresection prognosis in patients with HCC. We believe that the ADV score is primarily applicable to patients with a single treatment-naive HCC and can be expanded to those with multiple or preoperative-treated HCCs.
 XML Download