

 PDF
PDF Citation
 Print
Print


INTRODUCTION
Gallbladder cancer (GBC) is the most common malignant disease in the biliary tract, accounting for 80%–95% of biliary tract cancer (BTC) [1]. Although the only curative treatment of GBC is complete surgical resection, only 10% of patients are candidates for the surgery at diagnosis because most GBC are found in locally advanced or metastatic status [2]. Therefore, it is important to detect GBC at an early stage, thereby allowing for the performance of curative-intent surgical resection and better survival outcomes. However, the detection of GBC at an earlier stage is still challenging because the clinical symptoms are lacking or vague, or many symptoms manifest in advanced GBC [3]. A gold standard screening test for the diagnosis of GBC has not yet been established.
Tumor biomarkers are often investigated to diagnose malignant disease and to detect disease progression or recurrence [4]. Many studies have already revealed the clinical usefulness of CEA and CA 19-9 in terms of pancreatic cancer [5]. These 2 biomarkers have been utilized in BTC, and some previous studies have evaluated the clinical usefulness of these 2 biomarkers for the diagnosis of BTC with sensitivity of 50%–70% and specificity of 50%–85% [67]. However, these studies were small-scale, and not specific for GBC. Therefore, the current study aimed to investigate the diagnostic performance of serum CEA and CA 19-9 levels in large-scaled cohorts and to demonstrate the clinical implications of these 2 biomarkers in terms of GBC.
METHODS
Patients
This was a retrospective cohort study utilizing a prospectively collected medical database. Between January 2000 and March 2020, patients who underwent surgical resection had pathologically proven GBC were included in the cancer group. The control group included patients who underwent cholecystectomy for benign gallbladder diseases such as asymptomatic gallbladder stone, gallbladder fundal adenomyomatosis, benign gallbladder polyp, or acute cholecystitis between January 2000 and December 2015. Patients who underwent neoadjuvant chemotherapy or radiotherapy were excluded. Patients who did not have detailed pathologic and laboratory findings were excluded. All patients underwent preoperative pancreatobiliary protocol CT to investigate the tumor extent, regional lymph node (LN) enlargement, distant metastasis, and detection of other suspicious malignancies.
This study was approved by the Institutional Review Board of Seoul National University Hospital (No. 1812-002-989) and informed consent was obtained.
The classification of early GBC
Tumor-node-metastasis stages were unified with the 7th edition of the American Joint Committee on Cancer (AJCC) stage for GBC. Early GBC was classified as a Tis or T1 tumor without regional LN metastasis or distant metastasis. T1 GBC patients who did not need to undergo lymphadenectomy because of no suspicious LN metastases in the preoperative CT image were considered early GBC patients.
Quantitative measurement of serum CEA and CA 19-9 level
All patients included in this study had serum CEA and CA 19-9 levels measured within 2 weeks before surgery. Serum CEA levels were measured using immunoradiometric assay (IRMA) kits, a 1-step noncompetitive sandwich method (Shin Jin Medics, Ilsan, Korea). Serum CA 19-9 concentrations were measured using CA 19-9 [125I] IRMA kits based on the use of the 1116NS19-9 antibody (Institute of Isotopes [IZOTOP], Budapest, Hungary).
Statistical analysis
Serum CEA and CA 19-9 levels were described as medians along with interquartile ranges (IQRs, i.e., first-third quartiles). Due to the skewed distribution of serum CEA and CA 19-9 levels, log-transformation was performed and comparisons between tumor markers and categorical variables (GBC vs. normal control, early vs. advanced GBC) were performed using Student t-test or Mann-Whitney U-test, as appropriate. Receiver operating characteristic (ROC) curves were obtained to determine the optimal cutoff values of serum CEA and CA 19-9 levels and to evaluate the sensitivity and specificity of these 2 biomarkers.
RESULTS
Clinicopathologic findings between the gallbladder cancer group and the control group
A total of 751 and 2,310 patients were included in the GBC group and the control group, respectively (Table 1). Median CEA was 1.9 ng/mL (IQR, 1.2–3.1 ng/mL) and 1.4 ng/mL (IQR, 1.0–2.0 ng/mL) in the GBC group and the control group, respectively. Median CA 19-9 was 16 IU/mL (IQR, 6–46 IU/mL) and 7.5 IU/mL (IQR, 2.8–15.6 IU/mL) in the GBC group and the control group, respectively. In the GBC group, 636 patients (84.7%) were pathologically diagnosed with adenocarcinoma, followed by 54 with intracholecystic papillary neoplasm (7.2%), and 16 with adenosquamous carcinoma (2.1%); 35 patients (4.7%) were in stage 0, 117 patients (15.6%) were in stage I, 255 patients (34.0%) were in stage II, 227 patients (30.2%) were in stage III, and 117 patients (15.6%) were in stage IV. Of the control group, 1,787 patients (77.4%) underwent surgery for gallbladder stones, 269 patients (11.6%) for benign polyps, and 112 patients (4.8%) for cholecystitis.
Performance of serum CEA and CA 19-9 levels with regard to the diagnosis of gallbladder cancer
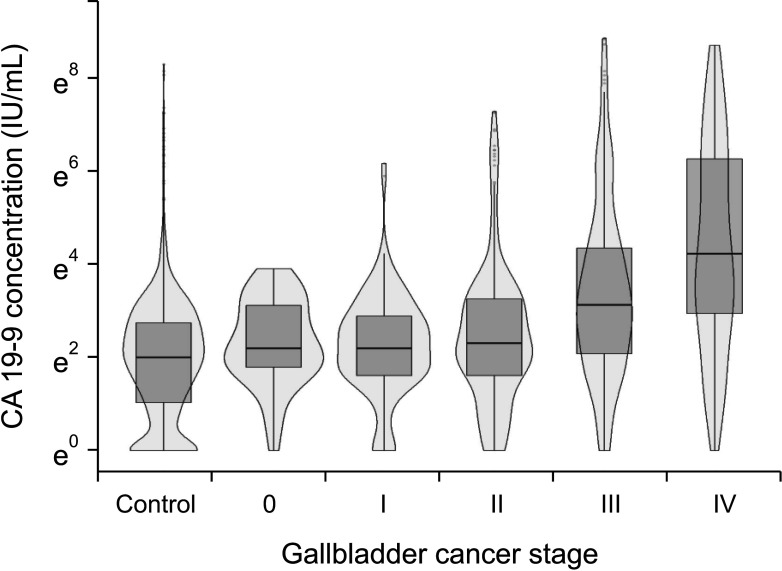
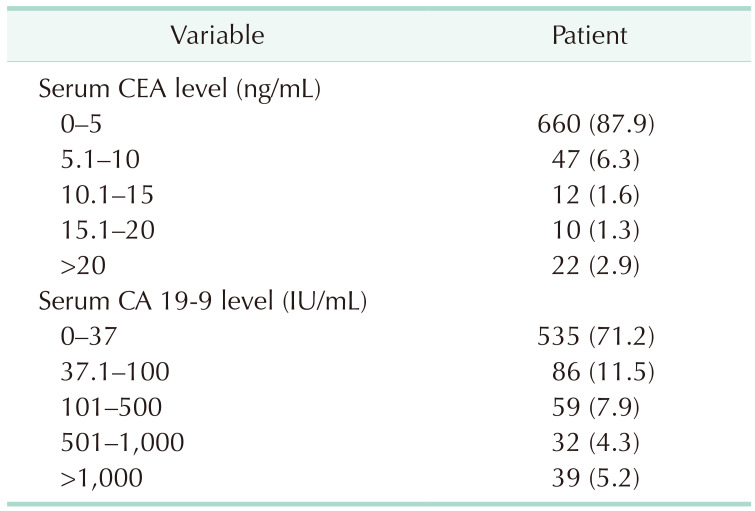
A total of 660 patients (87.9%) had a serum CEA level of 5 ng/mL or less and 535 patients (71.2%) had a serum CA 19-9 level of 37 IU/mL or less (Table 2). Fig. 1 shows the distribution of log-transformed serum CEA levels (Fig. 1A) and log-transformed serum CA 19-9 levels (Fig. 1B); the levels of both these biomarkers were higher in the GBC group than in the control group. However, when classified with the AJCC 7th stage, the overall distributions of log-transformed serum CA 19-9 levels were comparable among the control, stage 0, I, and II GBC groups (Fig. 2) and the median serum CA 19-9 levels were 7.5 IU/mL for control, 13.4 IU/mL for stage 0, 10.7 IU/mL for stage I, and 11 IU/mL for stage II cancer patients. Patients in stages III and IV showed a higher distribution of serum CA 19-9 levels than the stage I and II groups (median, 34 IU/mL vs. 11 IU/mL; Supplementary Fig. 1A), and the group with distant metastasis showed higher serum CA 19-9 levels than those without metastasis (median, 80 IU/mL vs. 15 IU/mL; Supplementary Fig. 1B).
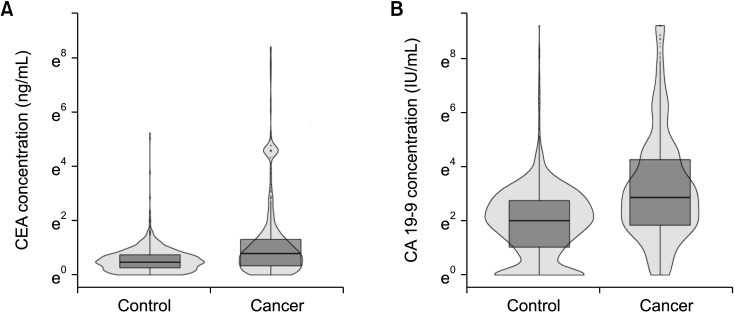
Fig. 1
Distribution of serum biomarkers at the preoperative period. (A) Log-transformed CEA level. (B) Log-transformed serum CA 19-9 level.
![]()
Diagnostic performance of serum CEA and CA 19-9 level for diagnosing gallbladder cancer
When the cutoff values of serum CEA and CA 19-9 levels were set to 5 ng/mL and 37 IU/mL for differentiating GBC from the normal control, the sensitivity and specificity of CEA were 12.1% and 99.1%, respectively, and those of CA 19-9 were 28.7% and 94.5%, respectively (Table 3). When the same cutoff value was applied to differentiate early GBC (stage 0 and I) from the normal control, the sensitivity and specificity of CEA were 22.2% and 94.0%, respectively, and those of CA 19-9 were 10.6% and 94.1%, respectively.
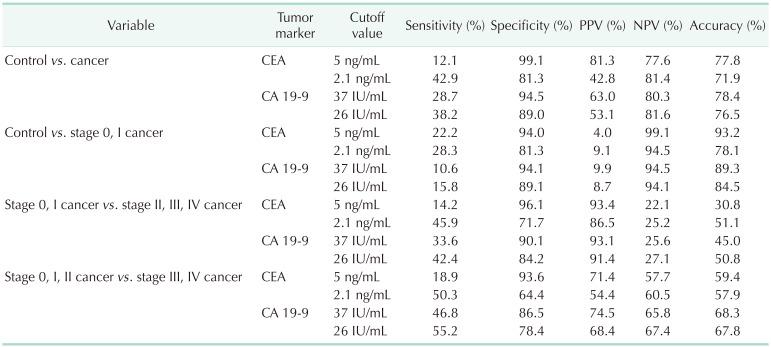
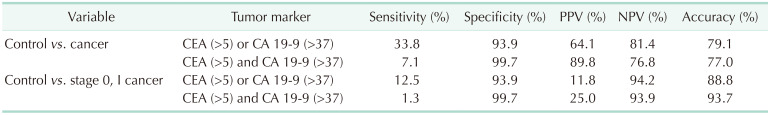
And then, the diagnostic performance of the composition of CEA and CA 19-9 were evaluated (Table 4). In regards to the diagnosis of all stage GBC, the sensitivity became higher than that of each biomarker, although the positive predictive value became lower. The sensitivity of diagnosis of early GBC remained less than 30%.
Diagnostic performance of serum CEA and CA 19-9 levels for differentiating gallbladder cancer stage
When the cutoff value was set to 5 ng/mL of serum CEA and 37 IU/mL of serum CA 19-9 for differentiating early GBC from advanced tumors, the sensitivity and specificity of CEA were 14.2% and 96.1%, respectively, and those of CA 19-9 were 11.6% and 94.6%, respectively (Table 3). When the same cutoff values were applied to differentiate stage 0, I, and II cancer from stage III and IV cancer, the sensitivity and specificity of CEA were 18.9% and 93.6%, respectively; and those of CA 19-9 were 46.8% and 86.5%, respectively.
Setting of optimal cutoff values of serum CEA and CA 19-9 levels via receiver operating characteristic curve analysis
Fig. 3 shows the ROC curves of serum CEA levels and serum CA 19-9 levels for the diagnosis of GBC. Overall, the optimal cutoff value for differentiating GBC from the controls was 2.1 ng/mL of CEA (Fig. 3A) and 26 IU/mL of CA 19-9 (Fig. 3B), and the sensitivity and specificity at these cutoff values were 42.9% and 81.3%, respectively, for serum CEA and 38.2% and 89.0%, respectively, for serum CA 19-9 (Table 3). When diagnosing early GBC (stage 0 and I) from the control group, the sensitivities of serum CEA and CA 19-9 at these cutoff values were 28.3% and 15.8%, respectively. The sensitivity of serum CEA and CA 19-9 for differentiating stage 0, I, and II cancer from stage III and IV cancer was higher when the cutoff values for CEA and CA 19-9 were changed from 5.0 to 2.1 ng/mL and from 37 to 26 IU/mL, respectively.
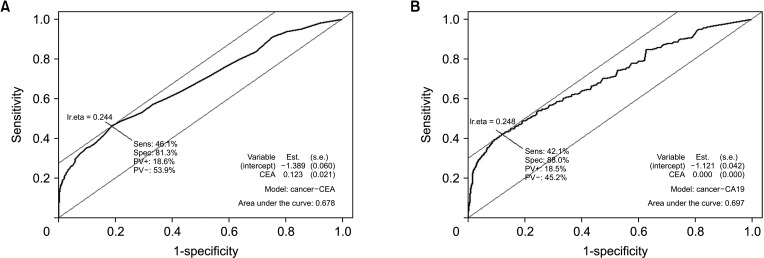
Fig. 3
Receiver operating characteristics (ROC) curve of 2 tumor markers for diagnostic gallbladder cancer. The optimal cutoff value was determined at the point on the ROC curve with the highest vertical distance from the 45° diagonal line. The optimal cutoff value was 2.1 ng/mL of CEA (A) and 26 IU/mL of CA 19-9 (B).
![]()
DISCUSSION
Since GBC manifests as vague or with no symptoms, it cannot be diagnosed by clinical symptoms alone and objective and noninvasive tools are necessary to accurately diagnose GBC. Therefore, novel diagnostic biomarkers with high sensitivity that can detect the disease in a screening population without symptoms [8], and can detect the disease specifically and noninvasively are needed [9]. Many tumor biomarkers have been utilized to detect malignant disease; for example, CA 125 for ovarian cancer [10], or prothrombin in vitamin K absence-II and alpha-fetoprotein for hepatocellular carcinoma [11]. Although some biomarkers, such as cytokeratin 19 fragments, matrix metalloproteinase-7, or osteopontin were proposed as potential diagnostic biomarkers for BTC, these biomarkers were investigated with small-scaled studies, and were only utilized in limited situations [12131415]. Although serum CA 19-9 and CEA levels have been considered as diagnostic biomarkers for BTC, their diagnostic performance for BTC remains controversial. Some previous studies have investigated the diagnostic performance of serum CA 19-9 and CEA in terms of BTC, but they were small-scale and not specific to GBC [16]. Although the incidence of BTC is relatively high in Chile, South America, India, and Eastern Asia, few studies on BTC can be found in these countries [17]. This study evaluated the diagnostic performance of these 2 biomarkers with a large number of GBC patients and a control group in a high-incidence country and demonstrated their clinical usefulness as a screening program for GBC.
Age, body mass index (BMI), or sex could affect preoperative CEA and CA 19-9 level. Therefore, the propensity score matching analysis was performed and the ranges of preoperative CEA and CA 19-9 level were compared before and after propensity score matching. Because age (65.3 years vs. 54.3 years, P < 0.001) and BMI (23.9 kg/m2
vs. 24.3 kg/m2, P = 0.017) were significantly different between the GBC and normal control group, the propensity score matching with age and sex was performed and the median and IQR of CEA and CA 19-9 were similar before and after propensity score matching. Therefore, age, sex, and BMI might not affect the preoperative serum CEA and CA 19-9 level. Finally, we analyzed all the data collected.
Conventionally, the cutoff value for determining benign and malignant disease at diagnosis is 5 ng/mL of serum CEA and 37 IU/mL of serum CA 19-9. However, these cutoff values were based on the results from colorectal cancer (CEA, 5 ng/mL) and pancreatic cancer (CA 19-9, 37 IU/mL) [18], and no studies existed in regards to the GBC. In the present study, 87.9% of GBC patients had CEA levels of ≤5 ng/mL and 71.2% of patients had CA 19-9 levels of ≤37 IU/mL (Table 2). Most patients with GBC had these 2 biomarkers within the conventional cutoff values. Therefore, these cutoff values were not suitable for diagnosing GBC and new criteria would be needed to screen for GBC.
CA 19-9 is a tumor-associated antigen, initially isolated as a colorectal cancer antigen, but also presented in epithelial cells of the gallbladder, biliary tract, pancreas, and stomach [19]. Serum CA 19-9 level is elevated in patients with not only malignant disease, but also liver cirrhosis, jaundice, or inflammatory conditions [1920]. In contrast, serum CA 19-9 was undetectable in some patients with Lewis-antigen negative phenotype [21]. The median sensitivity of CA 19-9 for the diagnosis of pancreatic cancer was reported as 79% [22]. However, in the present study, the sensitivity of CA 19-9 for the diagnosis of GBC did not exceed 30% at the conventional cutoff values (37 IU/mL) (Table 3). Therefore, the 37 IU/mL is not a reliable cutoff value of serum CA 19-9 for the diagnosis of GBC without reliable sensitivity as the screening test.
CEA is a glycoprotein involved in cell adhesion and is normally produced during fetal development; however, its production stops before birth [23]. While serum CEA is elevated in patients with colorectal cancer, it can also be elevated in smokers, and in cases of ulcerative colitis, liver cirrhosis, and chronic bronchitis [24]. The sensitivity of CEA for diagnosis was reported to be low, with a sensitivity of 50% in pancreatic cancer [25], and 33% in BTC [6]. In this study, the sensitivity of CEA was 12.1% for diagnosing GBC and 22.2% for diagnosing early GBC when the cutoff value was 5 ng/mL (Table 3). Current cutoff values of CEA and CA 19-9 are not suitable for the diagnosis of entire GBC and that of early-stage GBC. Therefore, new cutoff values suitable for the diagnosis of GBC are needed.
In this study, the ROC curves of serum CEA and CA 19-9 levels were evaluated using the database of 751 GBC patients and 2,310 normal controls (Fig. 3A). The optimal cutoff value of CEA was set to 2.1 ng/mL (Fig. 3A) and that of CA 19-9 was set to 26 IU/mL (Fig. 3B). The sensitivity of the proposed cutoff value was higher than that with the previous cutoff value that the sensitivity of CEA and CA 19-9 for the diagnosis of GBC rose to about 40% (Table 3). However, a sensitivity of 40% is not sufficient for a novel diagnostic tool. Furthermore, the sensitivity of CEA and CA 19-9 did not exceed 30% when these biomarkers were utilized to diagnose early GBC, and that of the composition of 2 biomarkers remained less than 30%. Therefore, these 2 biomarkers would not be suitable for detecting early GBC.
In regards to the disease severity, the sensitivity of the 2 biomarkers exceeded 50% when they were utilized to differentiate stage III and IV cancers from stage 0, I, and II cancers. Furthermore, the stage III and IV groups showed a higher distribution of serum CA 19-9 levels than did the stage I and II groups (median, 34 IU/mL vs. 11 IU/mL; Supplementary Fig. 1A). Considering that both biomarkers had high specificity for diagnosis and reliable sensitivity for differentiating cancer stage, these 2 biomarkers would be useful for the evaluation of disease severity, but not as a screening tool.
Radiologic modalities are the gold standard tools for diagnosing GBC. Ultrasonography is widely utilized for screening due to its noninvasiveness and real-time evaluation. Although ultrasonography has good performance for diagnosing gallbladder polyps, it is still difficult to differentiate neoplastic polyps from non-neoplastic polyps [26]. In particular, the sensitivity of CT images was reported to be 54% when the gallbladder lesion was T1 with only a thickened wall [27]. Because the ultrasonography results depend on the practitioner, new diagnostic biomarkers with higher sensitivity and objectivity should be included in the screening programs for GBC. If GBC can be diagnosed at an early stage, minimally invasive surgery such as laparoscopic or robotic cholecystectomy can be the appropriate treatment with comparable perioperative outcomes [28].
Although this study had some limitations related to a retrospective cohort study, this study evaluated more than 700 surgically resected GBC patients and over 2,000 normal controls. Considering that most previous studies on GBC analyzed a small number of patients in Western countries, this study was conducted in the Republic of Korea, in which the prevalence of GBC is much higher than that in other Western countries [29]. One study reported a high incidence of specific genomic mutations in Korea, which was not frequently found in other Western countries [30]. Therefore, if these researchers investigate new biomarkers for GBC, they should consider the difference in prevalence related to geographic variation.
In conclusion, serum CEA and CA 19-9 had low sensitivity and high specificity for diagnosing GBC, especially for the early GBC, thereby making them unsuitable for screening GBC patients from the normal control group. New biomarkers with high sensitivity for the diagnosis of GBC should be explored.
 XML Download