

 PDF
PDF Citation
 Print
Print


INTRODUCTION
Early diagnosis of any cancer is effective to improve survival rate and prognosis [1]. It is especially significant for pancreatic ductal adenocarcinoma (PDAC), one of the most lethal cancers with 5-year survival rates of 2%–9% [2]. About 80%–85% of PDAC is unresectable at the time of diagnosis without any curative treatment modalities [3]. There are a number of challenges for early diagnosis of pancreatic cancer. Pancreatic cancer does not usually show specific symptoms at earlier stages, resulting in late diagnosis and advanced stages. It also lacks noninvasive diagnostic tests such as blood-based biomarkers. The current diagnostic modalities are CT- or MRI-based or endoscopic ultrasound biopsy [4], which are not cost-effective nor noninvasive.
Although considerable advances have been made in diagnosis and management of PDAC to increase overall survival, there is no effective screening test or treatment other than surgical resection which is the only possible cure for PDAC so far. Therefore, it is important to develop a screening test for the general population for early detection of PDAC so that diagnosed patients stand a better chance of survival after surgical resection of the tumor. This screening test should ideally be a cost-effective, fast, and less invasive diagnostic modality.
Biomarkers or tumor markers detected in a simple blood test have provided increasing opportunities for screening, early diagnosis, prognosis, and monitoring therapy response for cancers [5,6]. Although many ‘potential biomarkers’ for PDAC have been discovered [7], the CA 19-9 is the only one approved by the United States Food and Drug Administration (FDA) for pancreatic cancer so far. However, CA 19-9 has a sensitivity of 70%–80% and a specificity of 82%–90% for PDAC [8,9], and is absent in asymptomatic patients [10], 10%–13% of pancreatic cancer patients [10,11] and is not tumor-specific [9]. These numbers are not high enough to be effective for early detection of PDAC. In line with this, there have been increasing efforts to combine some biomarkers to find a multi-marker panel with improved accuracy and higher sensitivity than one with only CA 19-9 [12,13,14,15].
Despite effort to identify tumor-specific biomarkers, translation of these novel biomarkers into clinical practice has been very limited. To successfully bridge the gap between the laboratory and clinic, we need precise proteomic quantitative technologies and good analytical performance of the quantitation [16,17]. There are some assays that had been approved by the FDA for certain cancers [18], but none of these were introduced for pancreatic cancer except for CA 19-9. Recently, 2 studies developed a serum multi-biomarker microarray for the early detection of PDAC that went through external validation on a large cohort [19,20]. However, they were still missing some requirements for an ideal screening test, such as cost-effectiveness and simplified usage.
Therefore, in this study, we developed an automated triple-marker enzyme-linked immunosorbent assay (ELISA) kit for simple usage and the diagnostic model, which can achieve high diagnostic performance to predict the risk of pancreatic cancer.
METHODS
Overview of study design
The automated multi-biomarker ELISA kit was developed using 3 potential biomarkers, leucine-rich alpha-2-glycoprotein (LRG1), transthyretin (TTR), and CA 19-9, which were discovered in the previous study [19]. Park et al. [19] identified them using multiple reaction monitoring-mass spectrometry (MRM-MS), and for which external validation was done at multiple centers. The triple-marker panel demonstrated better performance than that for CA 19-9 alone for distinguishing PDAC from normal, other cancers (breast, thyroid, and colorectal cancers), and benign pancreatic disease.
We first had to verify the consistency of the dataset between the automated multi-panel ELISA kit and the individual-marker ELISA panels of the previous study. The correlation between the 2 datasets was analyzed with the Pearson correlation method. Afterward, a prediction model was developed using logistic regression (LR) models. The entire data was divided into a 7:3 ratio of training dataset (n = 511) and test dataset (n = 217) by random sampling. Normal and PDAC data were randomly divided into the training and test datasets in the same ratio.
From the LR diagnostic model, 3 risk groups were classified using thresholds. The conditions for finding the optimal combination of 2 thresholds were evaluated by introducing 4 measures, negative predictive values (NPV), positive predictive values (PPV), sensitivity (Sen), and specificity (Spe).
This study was approved by the Institutional Review Boards of all participating institutions (SNUH surgery H-0901-010-267, SNUH internal medicine H-0412-138-005 and H-0412-138-006, SNUH HSGC H-1305-573-489 and C-1301-095-458, YSH 4-2013-0725, NCC NCCNCS13818, SMC 2008-07-065, and AMC 2013-1061) and biospecimens were collected from participants who provided informed consent.
Study population
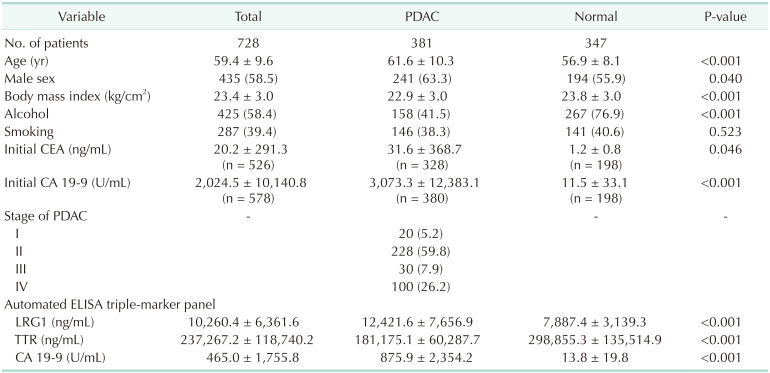
A total of 728 samples were collected between January 2011 and December 2013, including 347 normal and 381 PDAC from multiple centers in Korea (Seoul National University Hospital or Seoul National University Hospital Healthcare System Gangnam Center, National Cancer Center, Asan Medical Center, Samsung Medical Center, and Yonsei Severance Hospital). The normal samples were defined by participants who were healthy or those with gallstones or cholecystitis without severe inflammation. They did not possess any malignancies or other serious health conditions. Age, sex, body mass index (BMI), smoking, and alcohol history were considered for all samples. All stages of PDAC were included and the stage of the disease was classified as per the 7th edition of American Joint Committee on Cancer. The demographics are listed in Table 1.
Automated ELISA kit and consistency between individual vs. multi-marker panel datasets
ELISA was used for quantitative analysis of proteins in serum samples. We first developed an automated multi-panel ELISA kit that included LRG1, TTR, and CA 19-9 panels in 1 ELISA microwell plate. Instead of generating 3 panels individually in different ELISA kits and combining the results in an additional process, 1 microwell could have the functionality to screen for all 3 biomarkers at once and make the test faster. This kit was tested for all 728 plasma samples (Human Pancreatic Cancer Trio ELISA kit, Abfrontier, Seoul, Korea) using the Dynex-DS2 (Dynex Tech. Inc., Chantilly, VA, USA). Dynex-DS2 is an automated ELISA machine that includes transfer, dispensing, washer, incubator, reader, and analysis systems, all in 1 machine. The test was performed according to the manufacturer's recommendations. Briefly, LRG1, CA 19-9, and TTR were diluted 2,000-, 4-, and 10,000-fold, respectively, using the designated solutions. The standard, control reagents, and plasma samples (each 100 µL) were loaded onto assigned wells. The standard and control reagents were duplicated. The wells were incubated at room temperature for 2 hours. After the wells were washed 3 times, the conjugate (100 µL) was added and incubated for 1 hour at room temperature. Again, after the wells were washed 3 times, the substrate solution (100 µL) was added and incubated at room temperature for 30 minutes. The stop solution (100 µL) was added to cease the reaction. The optical density was measured at 540 or 570 nm. The concentration was obtained by 4-parameter logistic curve fit, multiplied by the dilution factors.
The triple-marker ELISA test results were compared with the individual ELISA test results based on the 3 markers, LRG1, TTR, and CA 19-9, generated in the previous study [19]. At this time, only common data from the same patient were used to check the experimental consistency between the single-panel and multi-panel ELISA kits (Supplementary Table 1). The Pearson and Spearman correlation coefficients were calculated for checking consistency between 2 ELISA datasets. The log-transformed observed values of each marker were investigated first and then the values predicted by the prediction model were considered.
Classification of low-, intermediate-, and high-risk groups
The diagnostic or risk prediction model was developed using the LR model. Based on the predicted probability of developing pancreatic cancer from the LR model, the patients were classified into low-, intermediate-, and high-risk groups by 2 thresholds δ1 and δ2. In order to choose the values of δ1 and δ2 systematically, we considered 4 measures: NPV, PPV, Sen, and Spe. Note that from normal and PDAC groups, the classification model results in 3 risk groups (low, intermediate, and high). For simplicity, we used modified versions of NPV, PPV, Sen, and Spe by considering only the high- and low-risk groups. For normal group, let n11 represent the count of predicted probability smaller than δ1, n12 the count between δ1 and δ2, and n13 the count larger than δ2 For PDAC, let n21, n22, and n23 be the corresponding counts, respectively. The 4 modified measures are calculated without the intermediate-risk group as follows:

In order to choose the optimal values of δ1 and δ2, we changed these values from 0.01 to 0.99 by 0.01. We found the optimal combinations which yielded the highest average for the 4 measures under the conditions that all 4 measures exceeded the cutoff values such as 85%, 90%, and 95%, respectively. Since 4 measures are calculated excluding the intermediate-risk group, performance is highly dependent on the count of the intermediate-risk group.
Statistical analysis
The demographic analysis and graphical work was performed using R ver. 3.6.2 (R Foundation for Statistical Computing, Vienna, Austria). Categorical variables of the normal and PDAC groups were compared via the chi-square test. The continuous variables were summarized using the means and standard deviations and compared via the Student t-test. Two-sided P-values of <0.05 were considered to be significant.
RESULTS
Clinical characteristics of patients
Clinical characteristics of PDAC patients and normal controls are shown in Table 1. Age and levels of initial CEA and initial CA 19-9 were significantly higher in PDAC group, whereas BMI was significantly lower in PDAC than normal group, all of which were consistent with the characteristics of PDAC. The rate of drinking alcohol was significantly lower in PDAC group. Also, the levels of automated ELISA kit of each markers were significantly higher in PDAC group than normal group, which well-discriminated the pancreatic cancer and normal. The levels of CA 19-9 and LRG 1 by the automated ELISA kit increased, and TTR decreased in PDAC group (Supplementary Fig. 1).
Consistency of multi-marker ELISA panel to individual-marker ELISA panel dataset
Consistency was confirmed along with the comparison between the individual biomarker ELISA kit data identified in the previous study [19] and the multi-panel ELISA kit data in this study. Pearson correlation of predicted values for PDAC by LR as the prediction model showed a high correlation of 0.865 between the 2 datasets (Fig. 1 and Supplementary Table 2). In the scatter plot of predicted values using the individual panel and multi-panel ELISA kit datasets, the distribution of predicted values for PDAC was divided into 3 groups, and any 2 threshold values for dividing them can be identified. Moreover, correlations of log-transformed 3-marker LRG1, CA 19-9, and TTR to individual and multi-marker data set were also high as predicted value (Fig. 1B–D).
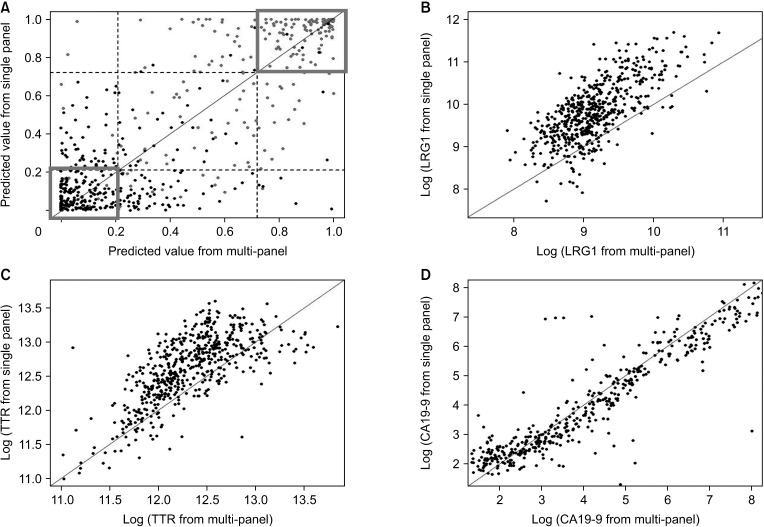
Fig. 1
The relationship between individual panels and multi-panel enzyme-linked immunosorbent assay (ELISA) kit datasets. (A) The scatter plot of predication values from the individual panels and multi-panel ELISA kit datasets. The red box indicated common regions of low- and high-risk groups using 2 thresholds. The level of log-transformed (B) LRG1, (C) TTR, and (D) CA 19-9 were measured by individual and multi-panel ELISA kits. LRG1, leucine-rich alpha 2 glycoprotein; TTR, transthyretin.
![]()
Diagnostic model development
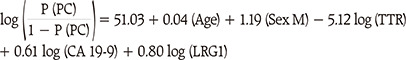
The diagnostic model for PDAC was developed using LR based on the multi-panel ELISA kit for 2 categories of normal/PDAC. A total of 5 variables including covariates, sex and age, and 3 biomarkers, CA 19-9, LRG1, and TTR, were selected to construct an LR model for diagnostics. The fitted LR model is given as follows:
Optimizing threshold combination and prediction performance
For the optimal combination of δ1 and δ2, Table 2 shows the 4 evaluation measures and the numbers of risk groups for the given the cutoff values. As the cutoff values decrease, the numbers of high- and low-risk groups increase, while that of the intermediate-risk group decreases. When the cutoff value was 95%, for example, there were 216 subjects in the intermediate-risk group, and the number of intermediate-risk group became 68 and 1 as the cutoff values were reduced to 90% and 85%. For a real clinical application, it would be important to have enough numbers of high- and low-risk groups in the prediction results. Unfortunately, the greater the size of high- and low-risk groups, the smaller the evaluation measures. As a compromised solution for practical application, the 90% cutoff value was chosen which provided the optimized threshold values; (δ1, δ2) = (0.32, 0.60) (Fig. 2B). For these thresholds, the values of NPV, PPV, Sen, Spe were 90.69, 92.05, 92.05, and 90.69, respectively and its mean was 91.37 (Table 2).
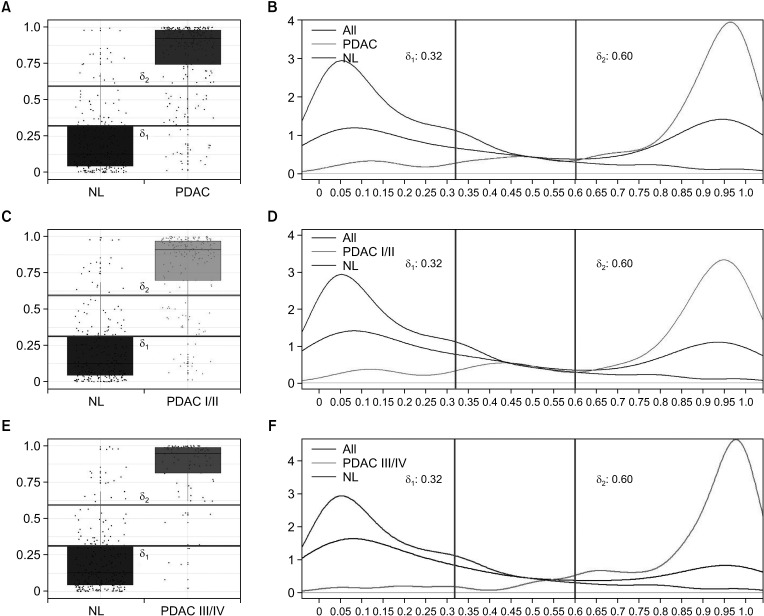
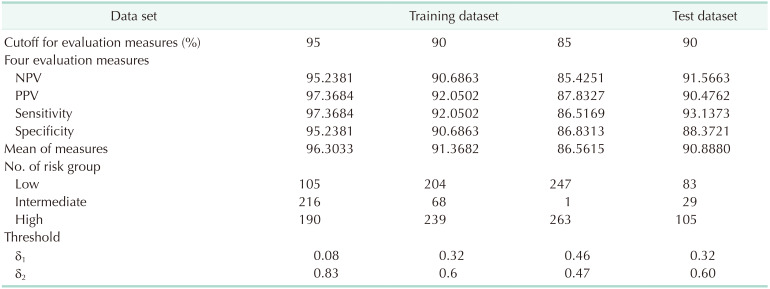
Fig. 2
Optimized threshold combination for the enzyme-linked immunosorbent assay (ELISA) triple-marker prediction model. The box plot (A) and density plot (B) for all stages showed that the high-risk group had a predicted value close to 1 and the low-risk group has a value close to 0 using automated ELISA triple-marker kit. The intermediate-risk group was in between δ1 and δ2. The diagnostic model was evaluated for the early stage (C, D) and the late state (E, F). NL, normal; PDAC, pancreatic ductal adenocarcinoma.
![]()
Table 2
Optimization of thresholds
Performance of the predicted model was compared with various cutoff values of evaluation measures and verified with training and test data set. The thresholds that satisfied high diagnostic evaluation measures and the lowest number of intermediate-risk group at the same time were selected.
NPV, negative predictive values; PPV, positive predictive values.
![]()
In order to evaluate the performance of the proposed diagnostic model, we applied this model to the test dataset using the same optimal threshold value; (δ1, δ2) = (0.32, 0.60). For these thresholds, the values of NPV, PPV, Sen, Spe were 91.57, 90.48, 93.14, and 88.37, respectively and its mean was 90.89, as shown in the last column of Table 2.
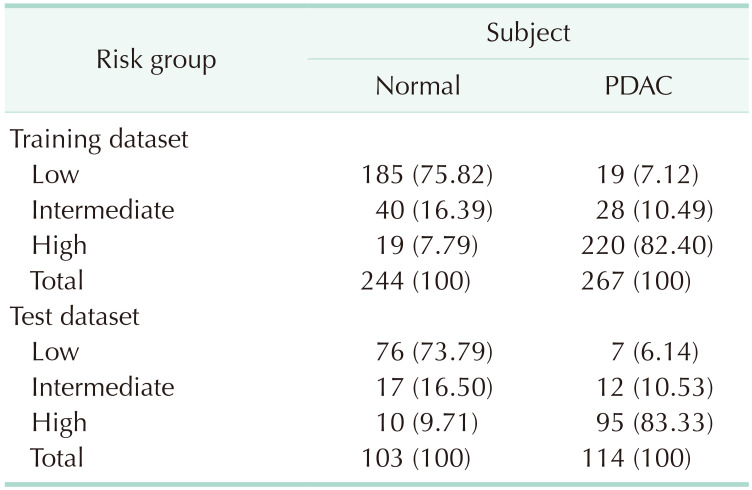
Table 3 shows a 2 × 3 contingency table. For the training dataset, 75.82% of normal subjects were classified into the low-risk group, while 82.40% of PDAC patients into the high-risk group. On the other hand, for the test dataset, 73.79% of normal subjects were classified into the low-risk group, while 83.33% of PDAC patients into the high-risk group. The predicted percentages of intermediate-risk groups were 16.39% and 10.49% for normal and PDAC groups, respectively for the training dataset.
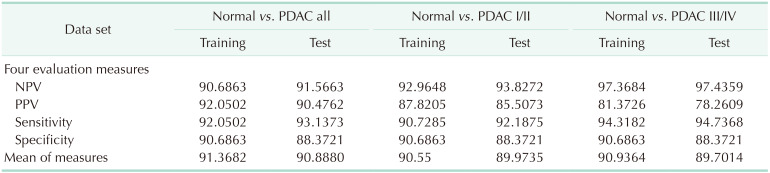
The performance of the diagnostic model was also evaluated by stages, comparing early and late stages of PDAC (Table 4). The proposed model also showed high diagnostic performance in both stage I/II and stage III/IV, similar to the performance in all stages. Moreover, when applied to the model, both early and late stages were effectively classified into low-, intermediate-, and high-risk groups (Fig. 2C–F).
DISCUSSION
In this multicenter biomarker study, we developed the automated triple-marker kit using ELISA assay and the diagnostic model for PDAC. The diagnostic model using the automated ELISA kit had better diagnostic performance (all of NPV, PPV, Sen, and Spe over 90%) than known performance of CA 19-9 alone from previous studies (Sen and Spe 70–90%). In addition, the proposed model was well adopted even in the early stages of PDAC, which were usually hard to detect in the clinic.
A blood-based cancer detection test is minimally invasive, less expensive than imaging diagnostic tools, and somewhat simple and convenient. For this reason, cancer-specific biomarkers have emerged as an important screening tool [21]. In addition, the multi-biomarker panels have worked as better alternatives to single biomarker ones due to better diagnostic performance [22]. There are several studies [12,13,14,20,23], including the study previous to this one [19], that introduced multi-marker panels for pancreatic cancer and demonstrated superior Sen and Spe to that of CA 19-9 (Supplementary Table 3). However, most panels have been verified at a single institution. We used CA 19-9, LRG1, and TTR panels that had already demonstrated multi-institutional external validation from the previous biomarker discovery study [19].
Once potential biomarkers are identified, the next step is to develop a model for diagnostic accuracy, which would eventually be used in routine clinical practice [18,21]. Currently, there are biomarker-based models for certain cancers, approved for clinical practice [1,18,22,24]. For example, in ovarian cancer, OVA1 is an example of a successful translation of multi-biomarker panel to clinical use that has been cleared by the FDA [25]. OVA1, consisting of CA125, TTR, apolipoprotein A1, beta 2 microglobulin, and transferrin, demonstrated a Sen of 96% and NPV of 98% for identifying high-risk ovarian tumors [26]. There are no prediction models for pancreatic cancer yet in a clinical setting. But most recently, a microarray-based biomarker test (IMMray PanCan-d, Immunovia, Lund, Sweden), which achieved external validation, was introduced and was about to be approved by the FDA and marketed [20]. However, due to its high cost, it may not be practical to be used as a screening tool. Therefore, the PDAC diagnostic model with only 3 biomarkers, CA 19-9, LRG1, and TTR, described in this study would confer the advantage of being less expensive and more practical.
The algorithm for risk calculation needs risk stratification to identify actual likelihood of malignancy. To discriminate normal and PDAC, we classified risks into 3 groups (low, intermediate, and high) instead of a binary discrimination. We included the intermediate-risk group for a specific reason. For example, if risk is 40%, it would be ambiguous to know whether there is a low or high risk to get pancreatic cancer. Inclusion of the intermediate-risk group would differentiate the low- and high-risk groups incontestably. If individuals are positioned in the high-risk group, they are highly suspicious of having PDAC and thus need more precise examination or other interventions for treatment. If they are placed in the intermediate-risk group, which implies moderate risk or above, they need further radiologic examination or follow-up tests to ascertain any possibility of cancer. This may result in early detection and treatment planning for pancreatic cancer. The low-risk groups may not need further checkups.
The levels of tumor markers are known to be varied by stages of cancer with usually higher detection rate at late stage [27]. Thus it is important to know if our ELISA kit and model can discriminate the cancer and the normal even at early stages. When we analyzed NPV, PPV, Sen, and Spe for early and late stages separately, those values of both conditions showed similar evaluation measures as all stages. However, PPV of both conditions showed somewhat lower values than all stages, which could be explained by decreased sample sizes as we divided them. Moreover, our model was nicely applied to both early and late stages, discriminating the normal and the cancer.
In biomarker studies, assay development should not only concentrate on diagnostic and clinical performance but also on time- and cost-effectiveness. It is desirable for assays to be precise, less time consuming, inexpensive, and have the ability to profile large amounts of proteins at a time [28,29]. The selection of a method may be dependent on the government healthcare support system, laboratory capacities and other factors. In this study, ELISA was used to quantitate the amount of biomarker proteins in serum samples instead of MRM-MS, which was formerly used in the study by Park et al. [19]. The MRM-MS is a high throughput and sensitive protein-quantitating method that was also cost-effective and fast for the validation of the triple-marker panel [30]. The MRM-MS requires only small sample volumes, about 20 µL, and has no limitation on the number of markers in the multi-marker panel [30]. However, since this innovative device cannot analyze CA 19-9 and is not yet available in general clinics but only equipped in only laboratories, we needed a compromise between a real life and ideal setting. Furthermore, to make a panel kit simpler, we made an effort to combine 3 biomarker panels into 1 microwell. In this way, we could achieve a faster and less expensive assay. For the practical use of the biomarker panels, ELISA technique was used to build the diagnostic model, making it minimally invasive and cost-effective.
In spite of the high diagnostic performance of the model, there were some limitations. First, samples were collected retrospectively due to the retrospective nature of the research. Moreover, since multi-institutional samples were limited within Korea only, the model might not be applicable to the general population elsewhere. Also, the training sets and test sets for construction of the model were separate portions of the same dataset. Ideally, models should be trained, tested, and validated with different sets of data. However, due to the low incidence of PDAC, there were limitations in collecting samples that were large enough in size. Another limitation of the study was that diagnostic performance was only evaluated between PDAC and normal. Nevertheless, we need further experimentation to discriminate PDAC from other groups, such as other cancers and benign pancreatic disease, for which we are already preparing in another study. Since the purpose of this study was to analyze the diagnostic performance of the automated ELISA kit and the development of the models, we will focus on a large scale validation trial with the automated ELISA kit and the diagnostic model to prove its safety and efficacy in the next study.
The triple ELISA diagnostic prediction model in this study satisfied the requirements of an ideal screening test, of being simple to use, being less expensive, having reduced turnaround time, and more importantly, showing high diagnostic performance with NPV, PPV, Sen, and Spe, all greater than 90%. We demonstrated the performance of the diagnostic model for more than 700 samples collected from multiple centers in South Korea. This study, thus, proposes a model that could predict the risk of pancreatic cancer (low, intermediate, and high) for general population and could potentially replace the previous tumor marker CA 19-9 for diagnosing pancreatic cancer. However, it needs external validation and further investigation.
 XML Download