Journal List > Child Kidney Dis > v.25(2) > 1149285

Lee, Ahn, Lim, and Kang: Biomarkers Predicting Treatment-Response in Nephrotic Syndrome of Children: A Systematic Review

Abstract

Purpose

Nephrotic syndrome (NS) is the most common form of glomerulopathy in children. Most pediatric patients respond to glucocorticosteroid treatment (steroid-sensitive NS, SSNS), while approximately 10–15% will remain unresponsive or later become steroid-resistant. There has been a long-standing effort to find biomarkers that may predict steroid responsiveness.

Methods

We systematically reviewed current studies which investigated clinically relevant biomarkers for predicting steroid responsiveness in pediatric NS. We performed a PubMed and EMBASE search to identify eligible articles. We collected data on urinary markers, blood/serum markers (including cellular phenotypes and mRNA expression), genotypes and HLA allele frequency.

Results

A total of 659 articles were identified following electronic and manual searches. After reviewing the titles, abstracts, and full texts, 72 eligible articles were finally included. Vitamin D-binding protein (VDBP) seemed to be significantly elevated in SRNS than in SSNS, in both serum and urine specimen, although further validation is required.

Conclusions

The present paper narratively illustrates current understandings of potential biomarkers that may help predict steroid responsiveness. Further investigation and collaboration involving a larger number of patients are necessary.

Introduction

Nephrotic syndrome (NS), characterized by massive proteinuria and generalized edema, is the most common kidney glomerulopathy in children [1]. Most pediatric patients respond to glucocorticosteroid treatment (steroidsensitive NS, SSNS), with a good long-term prognosis, although multiple relapses are common [2,3]. Since SSNS accounts for majority of pediatric cases, the first step in the management of NS in children is steroid trial, if secondary causes or contraindications of steroid treatment are not present [4]. This strategy is different from NS in adults, where kidney biopsy is the first step [5]. Nevertheless, some pediatric patients do not respond to steroid treatment (steroidresistant NS, SRNS) [3]. However, the initial presenting symptoms of SRNS do not differ from those of SSNS, and there are no widely accepted biomarkers that can predict steroid responsiveness, leading SRNS patients to unneccessary steroid exposure [6]. In addition, some patients with SRNS respond to calcineurin inhibitors (CNIs), such as cyclosporine or tacrolimus, while others are more responsive to mycophenolate mofetil (MMF) or rituximab and others may not respond to any immunosuppression [7,8]. The prognosis of SRNS is poor and approximately half of the patients progress to end-stage kidney disease (ESKD) within 10 years after initial presentation [9,10].
In addition, SRNS often recur after kidney transplantation except for certain cases with genetic etiology [9,11]. In general, recurrence of NS is often evident within 48 hours of re-vascularization of the allograft kidney, indicating the presence of circulating factors [12]. Of note, many patients who relapse with proteinuria after kidney transplantation respond to intensification of immunosuppression, including methylprednisolone pulse therapy, plasmapheresis, and rituximab [12,13]. Typically, these intensive treatments are applied within a few days of recurrence of NS. Considering that the same circulating factors likely have caused NS in the naïve kidneys [14,15], the responsiveness to immunosuppression in post-transplantation grafts may suggest that the poor treatment response in SRNS in the naïve kidneys may have been due to less effective treatment. Clearly, there are patients with genetic SRNS who would not theoretically respond to immunosuppression [8,16], in which case steroid treatment would only increase unnecessary side effects [17].
There has been a long-standing effort to find biomarkers that may predict steroid responsiveness in pediatric NS [6]. We systematically reviewed these efforts to identify clinically relevant biomarkers that may help differentiating SRNS and SSNS.

Materials and methods

1. Search strategy and data extraction

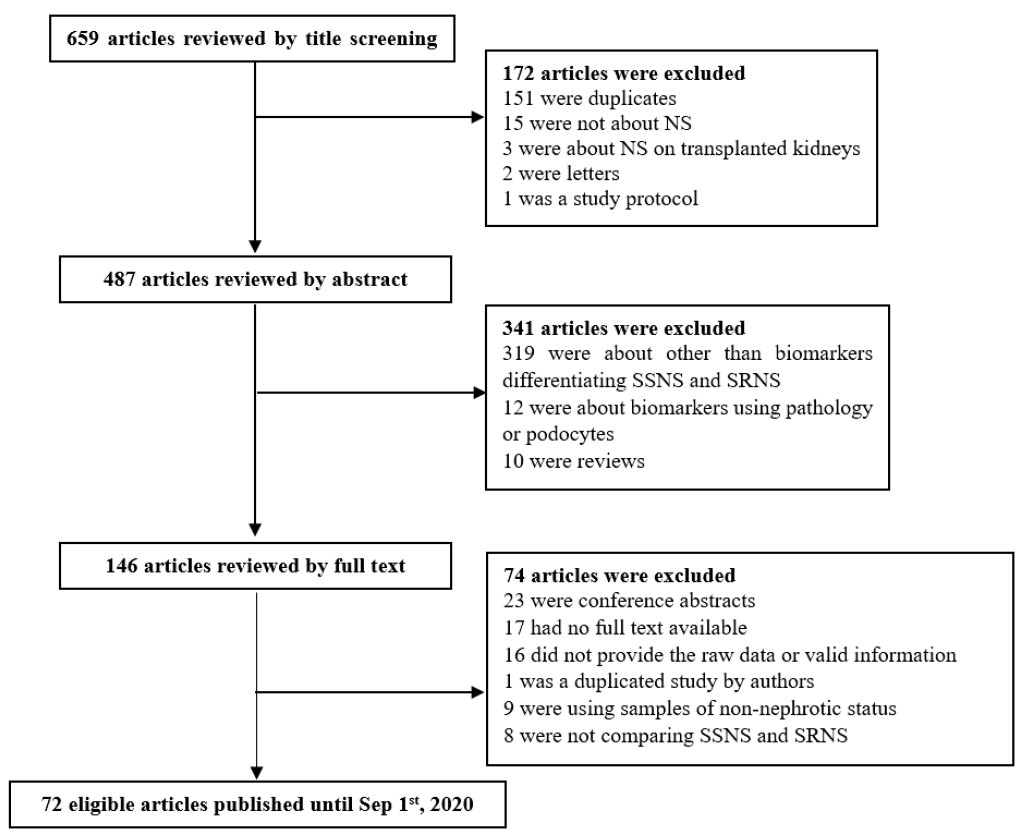
We performed a PubMed and EMBASE search to identify eligible articles. Furthermore, a forward search of the retrieved articles was performed. The last search was performed on August 27, 2020. The search terms were as follows: “(nephrotic syndrome OR nephrosis) AND (child* OR pediatric OR paediatric) AND (marker OR predict* OR differentiat*) AND (steroid* OR predniso*) AND resistan* AND (sensitive OR respond OR respons*). We examined and screened the articles first by the title, followed by the abstract, and finally by examining the full text. The detailed process of the article selection is shown in Fig. 1. Data were extracted from articles in which SSNS and SRNS were compared regarding candidate biomarkers. Demographic data, disease status (in relapse or at remission), medication, value of markers in the SSNS and SRNS groups, statistical significance, area under the receiver operating characteristic (ROC) curve (AUC), and cut-off values were collected. When the SSNS group included both cases of active or relapse and remission, data from active cases were archived. This report adhered to the Preferred Reporting Items for Systematic Reviews and Meta-analyses (PRISMA) guidelines [18].

2. Selection of studies

Two reviewers (Jiwon M. Lee and Hee Gyung Kang) independently evaluated the potential eligibility of each abstract and title that resulted from the initial search. The full-text versions of eligible studies were then reviewed and discussed. Disagreements were resolved via consensus or, if not possible, through arbitration by a third reviewer (Yo Han Ahn).

3. Eligibility and exclusion criteria

Studies that compared SSNS and SRNS with data from the urine or blood specimens were included. Except for genotyping, clinical data obtained at active nephrotic state were and analyzed. Omics studies without validation or identified molecules were excluded. Biomarkers using pathologic findings or cell culture were excluded. Duplicates, letters, conference abstracts, commentaries, and replies were excluded. Articles that did not contain patient data such as review articles and those without explicit data were excluded [19-39].

4. Statistical analysis

Descriptive data are expressed as mean±standard deviation (SD), median (range), or interquartile range (IQR) [36,40] according to the expression of the source study. The 95% confidence intervals (CI) are denoted as < >. When original individual data were reported but no statistics were given, Mann–Whitney analysis was performed using SPSS (IBM SPSS Statistics for Windows, version 20; IBM Corp., Armonk, NY, USA). For meta-analysis, Cochrane Review Manager (version 5.4; Cochrane Library, UK) was used when necessary, using the random effects model as previously reported [41]. Data were converted when comparisons using the same units were necessary. Results are expressed as odds ratios (OR) and 95% CI for dichotomous data. Statistical significance was set at P<0.05.

5. Study selection and characteristics

A total of 659 articles were identified by electronic and manual searches. After reviewing the titles and abstracts, 146 studies were selected for full-text reading. Of them, 74 were excluded due to a lack of relevance or appropriateness (Fig. 1), leading to the final inclusion of 72 eligible articles. The investigated biomarkers were classified as urinary markers and peripheral blood markers. The peripheral blood markers included cellular phenotypes, serum or plasma markers, and mRNA expression. In addition, genetic polymorphisms and HLA allele freqeuncies were also analyzed.

Results

1. Urinary markers (Table 1)

1) Markers related to kidney damage

Molecules indicating tubular damage were evaluated as markers of the steroid treatment response. Urinary levels of retinol-binding protein (RBP), an index of proximal tubular dysfunction, were higher in SRNS before steroid treatment, and urinary RBP ≥1.0 mg/L had an OR for SRNS of 30 [47]. Urinary RBP4/Cr was later investigated and could not differentiate SSNS and SRNS, while a cutoff value of >1.54 µg/mg could differentiate FSGS from minimal change disease among cases of SRNS [46]. Annexin V (ANX5), an indicator of acute renal injury and apoptosis, was measured in 24-hr-urine specimen and found to be lower in SRNS, with a proposed cutoff value of ≥4,000 ng/g urinary creatinine for SSNS [48]. This finding was repeatedly supported by conference abstracts, reporting a cutoff value of 520.1 µg/mmol or 3.15 ng/mg urinary creatinine in the spot urine [25,28], but the full text was not published for these studies. Neutrophil gelatinase-associated lipocalin (NGAL), a well-known marker of damage in the kidney and is rapidly upregulated in cases of renal injury, was also increased in SRNS with an AUC of 0.91 and suggested a cutoff value of 15 ng/mg urinary Cr [49] or an AUC of 0.76 with a cutoff 0.46 ng/mg [50,51]. Urinary exosomal WT1, a potential biomarker of podocyte injury, was not different between the groups [52]. Urine levels of vitamin D–binding protein (VDBP), a potential indicator of renal interstitial damage [53], were higher in SRNS than in SSNS and was able to differentiate with an AUC of 0.87 [54]. VDBP was also found to be a significant marker in a proteomics study [51].

2) Markers related to the pathogenesis of NS

The components of the charge-selective barrier of the glomerular basement membrane, glycosaminoglycan (GAG), and protein-bound sialic acid (PBSA) were investigated in the literature for their potential as biomarkers. While urinary GAG levels did not differ between SSNS and SRNS [55], PBSA was found to differentiate SRNS and SSNS with an AUC of 0.814 with a cutoff of 2.71 Cr [56]. Cytokines have been speculated to be involved in the pathogenesis of NS and increased protein permeability of the glomerular filtration barrier [57]. Increased urinary CD80 is considered pathogenic in NS and was tested in one study but was not indicative of steroid responsiveness [58].

3) Low-molecular weight proteins

Urine N-acetyl-beta-D-glucosaminidase and β2 microglobulin were evaluated [42-44] and found to be increased in SRNS in one previous study [44] but not in another [43]. No cut-off values were obtained.

4) Proteomics study

With advancements in technology, proteomics tools have become available for prognostic marker searches in NS. Proteomics studies in urine β2 microglobulin level showed contradicting results; significant in one study [42] but not supported in a more recent study which used modernized proteomics tools [45,46]. The former study detected β2 microglobulin (11.1 kDa) using surface-enhanced laser desorption/ionization time-of-flight mass spectrometry (SELDI-TOF MS) [42]. The latter study by Piyaphanee et al. also used SELDI-TOF MS and identified a 13.8-kDa α1-B glycoprotein (A1BG) fragment as a marker of SRNS [45], but expression of A1BG was found in only some patients with SRNS and those with lower eGFR. This molecule was evaluated independently by another study, but no statistically significant differences were found between SSNS and SRNS [51]. α1 antitrypsin was differentially expressed in a Chinese study and validated independently and was found to differentiate the two treatment response groups with an AUC of 0.899 [40]. Later, isobaric tags for relative and absolute quantitation (iTRAQ) combined with multidimensional liquid chromatography (LC) and matrix-assisted laser desorption ionization-mass spectrometry/mass spectrometry, identified apolipoprotein A1 (APO A1, 28 kDa), α 2 macroglobulin (A2M, 720 kDa), orosomucoid 2 (α-1 acid glycoprotein 2, AGP2, 42 kDa), RBP 4 (21 kDa), and leucine-rich α 2-glycoprotein 1 (LRG1, 50 kDa) as differentially expressed proteins in SRNS compared to SSNS [46]; however, a validation study revealed that only APO A1 could differentiate SRNS and SSNS (cutoff for SRNS <0.4 µg/mg). A similar study using the iTRAQ method followed by nanoscale liquid chromatography coupled to tandem mass spectrometry (nanoLC-MS/MS) found VDBP (58 kDa), alpha-1 acid glycoprotein 1 (AGP1), AGP2, A1BG, fetuinA, prealbumin, thyroxine-binding globulin, hemopexin, and A2M [51] were differentially expressed proteins, and their validation study revealed that prealbumin and VDBP levels were different between SSNS and SRNS. They also suggested using their models in 5 or 10 urinary markers to predict treatment response with an AUC >0.8.

2. Peripheral blood markers

1) Serum or plasma markers (Table 2)

(1) Immune reaction-related markers

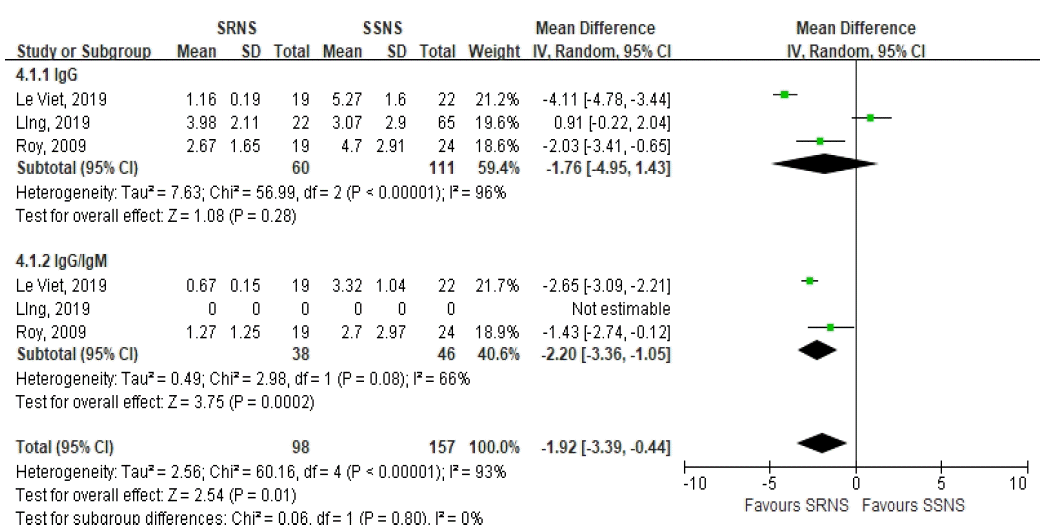
IL-8 and soluble IL-2 receptor levels were higher in SRNS compared to SSNS [60,61]. Differences in immunoglobulin concentrations were found to be significant only in IgG and IgE, implying that these differences originate from the urinary loss of these proteins, rather than an aberration of immune function [62-64]. A low IgG/IgM ratio suggested SRNS with statistical significance (Fig. 2). Soluble tumor necrosis factor receptors (TNFR) were not predictive of responsiveness to treatment [59].

(2) Soluble urokinase-type plasminogen activator receptor (suPAR)

suPAR was once postulated to be the circulating permeability factor in FSGS or SRNS [65], but it was soon refuted by several studies [66,67]. Regarding predictive markers of steroid responsiveness in children with NS, two studies were found [68,69]. While individual studies reported the significance of this molecule in distinguishing SRNS from SSNS, metaanalysis of these two studies was not significant (Fig. 3).

(3) Other serum/plasma markers

Molecules related to steroid metabolism have been studied as biomarkers [60,70]. The level of a downstream signaling molecule of glucocorticosteroids, histone deacetylase (HDAC)2, was lower in SRNS [60], while MIF, the level of a proinflammatory cytokine and counter-regulator of glucocorticoids, was increased [70]. Watany et al. studied nephroneptin, an extracellular matrix protein that is important for kidney development, and found that serum level of nephroneptin was reduced in SRNS [71]. The level of endothelin-1, which is related to the pathogenesis of proteinuria, was higher in SRNS [72]. An Egyptian group studied oxidative stress in NS, reporting that total antioxidant capacity was low and malondialdehyde (MDA), the main indicator of lipid peroxidation, was high in NS, especially in SRNS [73]. However, the serum NGAL concentration was not found to be related to steroid responsiveness in pediatric NS [74].

2) Cellular phenotypes (Table 3)

(1) Lymphocyte population composition

T lymphocyte aberrance has long been considered to be involved in the pathogenesis of idiopathic NS [75]. Recently, the efficacy of rituximab, which depletes CD20+ B cells, raised the speculation that B cells are involved in the pathogenesis of NS [76]. Excluding studies and data involving cell culture, there were three studies comparing the distribution of lymphocyte subsets [62,77,78]; however, one was excluded because they enrolled patients with SSNS in remission [78]. Stachowski et al. reported that when comparing SSNS and SRNS, suppressor-inducer cells (CD45Ra+CD4+) accounted for a higher percentage and memory cells (CD45RO+ CD4+) and suppressor-effector cells (CD45RO+CD8+) accounted for a lower percentage in SSNS than in SRNS [77]. Ling et al. found that CD8 lymphocyte populations were larger in SRNS than in SSNS, and the percentage of B cells was higher in SSNS than in SRNS or healthy controls [62]. They also found that at the initial onset of NS, a higher percentage of transitional B cells (CD24highCD38high) could predict the response to steroids, with a cut-off value of 2.05 % of lymphocytes, with an AUC of 0.907 (0.835–0.979).

(2) Other cellular phenotypes

Regarding other cellular phenotype markers, expression of TNF receptors (cTNFR) on granulocytes was investigated to identify differences between SSNS and SRNS, and both cTNFR1 and cTNFR2 expression were decreased in SSNS, while those in SRNS were not different from those in the control condition [59].

3) mRNA expression (Table 4)

Biomarker research using mRNA expression has been consistent with the previously mentioned arenas of biology. JAK/STAT pathways might be involved in the progression of proteinuric glomerular diseases [79]; expression of its main suppressor, suppressor of cytokine signaling (SOCS), was investigated in two studies and found to be increased in SRNS [80,81]. The expression of its receptor glucocorticoid receptors (GCR), multidrug resistant gene MDR1, and HDAC2 expression were studied [60,61,82,83], all of which were statisticaly significant. CD80 and toll-like receptors (TLRs) were identified to be associated with the pathogenesis of NS [84], and their expression in peripheral blood mononuclear cells was decreased in SRNS58. In short, MDR1 and SOC 3,5-related genes were increased in SRNS and all the others were more increased in SSNS then in SRNS.

3. Genotype markers

1) Progression of kidney disease-related genes

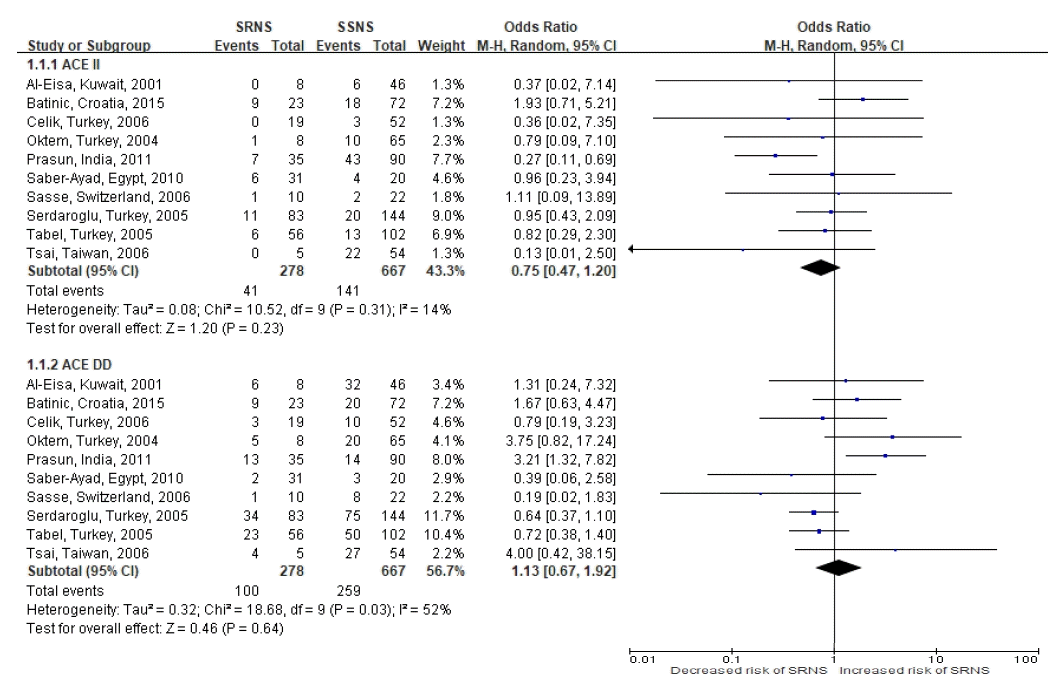
In the early 21st century, associations of ACE polymorphism, the I or D allele, and kidney-related health problems were actively investigated [85,86]. There are three possible genotypes, II, ID, and DD; genotype DD or D allele is known to be associated with increased ACE activity [85-87]. Regarding steroid response in pediatric NS, 10 studies were found [88-96]. These studies were analyzed to explore the possible association between the DD or II genotype and the phenotypes of SRNS and SSNS (Fig. 4). Statistically, the distribution of both genotypes did not differ between SRNS and SSNS. Other genes involved in the renin-angiotensin-aldosterone system (RAS) were also evaluated [96]; T alleles of the T704C polymorphism of AGT were more common in SRNS in one study (Table 5) [95].
Endothelin-1 has been speculated to be involved in the pathogenesis of proteinuria and glomerulosclerosis [97]. Polymorphism of the endothelin receptor type A gene (ENDRA) was significantly associated with SRNS in one study [98]. Apolipoprotein E (ApoE) polymorphism was also found to be significant [99].

2) Steroid receptor- or metabolism-related genes

Resistance to steroid treatment might stem from steroid receptor aberrations or impaired metabolism of the medication. Glucocorticoid receptors, NR3C1 [100] or GLCCI1 [101], and genes related to the metabolism of this medication, MDR1 [102-106], MIF [102,107,108], and CYP3A5 [104,105], were investigated for the association of their polymorphisms and the response to steroids in pediatric NS.

(1) MDR1 (ABCB1)

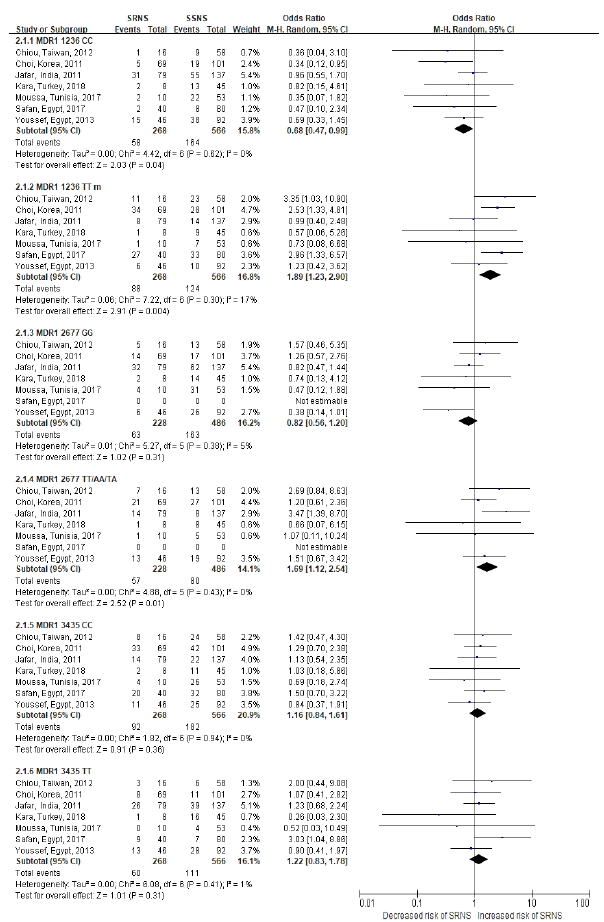
MDR1 encodes P-glycoprotein, which eliminates steroids from the cells. In a Korean study and an Egyptian study, the C allele of the C1236T polymorphism was associated with a better response to steroid treatment [96]. Studies in India and Tunisia reported that the proportion of homozygous mutants of G2677T/A, a polymorphism causing an amino acid substitution (Ala899Ser/Thr) in P-glycoprotein, was higher in SRNS than in SSNS [103,105]. Another Egyptian study found that the frequency of minor alleles of G2677T/A was higher in SRNS than in SSNS [106], while a Turkish study did not find any association between the most frequent polymorphisms of C1236T, G2677T/A, or C3435T of MDR1 and steroid responsiveness [104]. Meta-analysis of data from these five studies revealed that the major alleles of C1236T and G2677T/A seem to be protective against SRNS (Fig. 5) However, this difference was not statistically significant. However, having two copies of the minor allele of G2677T/A was associated with increased risk of SRNS [OR 1.6 (1.01–2.50)]. The frequency of the C3435T polymorphism did not differ between SSNS and SRNS. Haplotype analysis of the MDR1 gene and its above-mentioned three polymorphisms (C1236T, G2677T/A, and C3435T) was performed in four of the studies [102,103,105,106]; two studies found that the frequency of the TGC haplotype was significantly lower in SSNS [102,106]. Another study reported that the haplotype of TAT increased the risk of SRNS [OR 2.69 (1.12–8.79); P=0.044] [105].

(2) Macrophage migration inhibitory factor (MIF) and CYP3A5

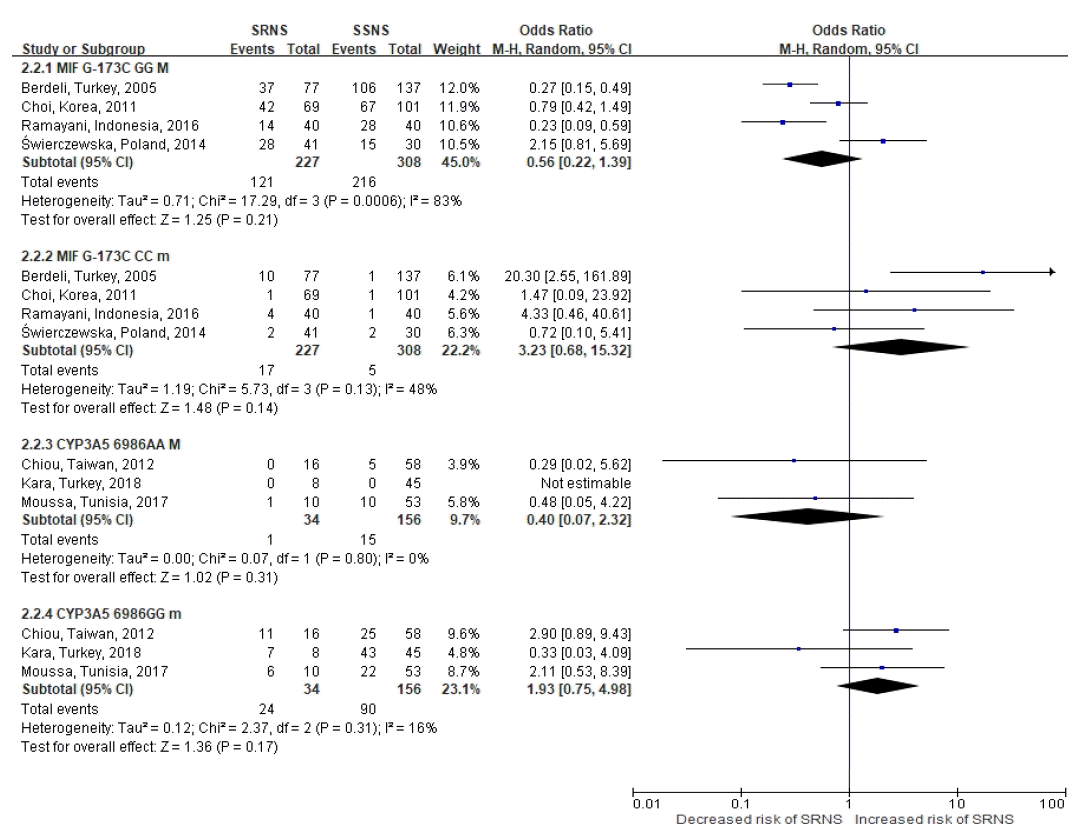
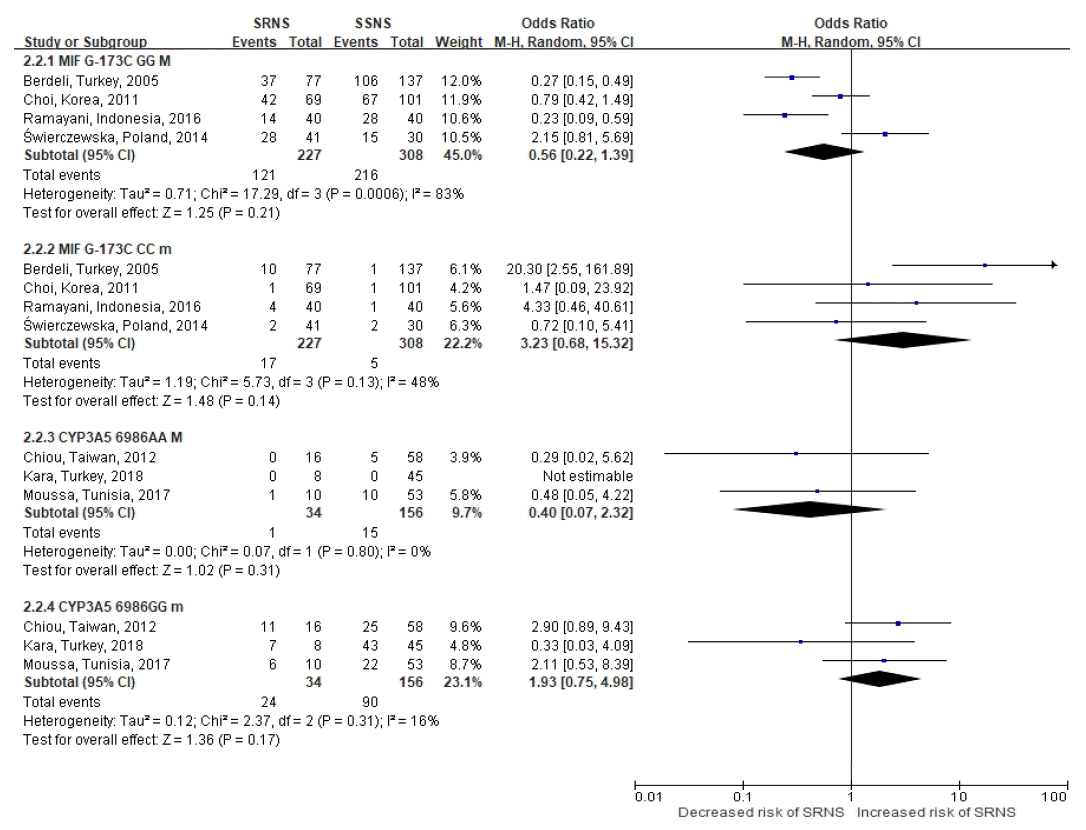
MIF is a proinflammatory cytokine but is also the “physiological counter-regulator of the immunosuppressive effects of glucocorticoids” [108]. The promoter polymorphism of G-173C, known to be associated with the amount of MIF production and susceptibility to inflammatory diseases, was investigated in four studies [102,107,109,110]. According to a meta-analysis, the MIF-173 CC genotype seemed more common in SRNS than in SSNS and -173 GG genotype appeared protective; however, the results were not statistically significant (Fig. 6). Świerczewska et al. studied other MIF polymorphisms, but no significance was found [110]. CYP3A5 encodes for the cytochrome P450 enzyme involved in the metabolism of many exogenous and endogenous compounds. Three studies were found to analyze the effect of polymorphism of this enzyme [104,105,111], and no significant results were found.
Polymorphisms of the glucocorticoid receptor gene (NR3C1) and glucocorticoid-induced transcript 1 gene (GLCCI1) were not significant [100,101], while those of the steroid and xenobiotic receptor (SXR, NR1I2) were significant (Table 5) [112].

4.Pathogenesis of NS-related genes

1) Cytokines

Cytokines have long been speculated to be involved in the pathogenesis of NS [75]. Polymorphisms of TNFa and IL-6 have been evaluated in a few studies [113-115]; minor alleles were more common in SRNS, although the differences were not all statistically significant (Fig. 7). Another Th2 cytokine, IL-4, was also found to be significant [113].

2) Podocin and TRPC6

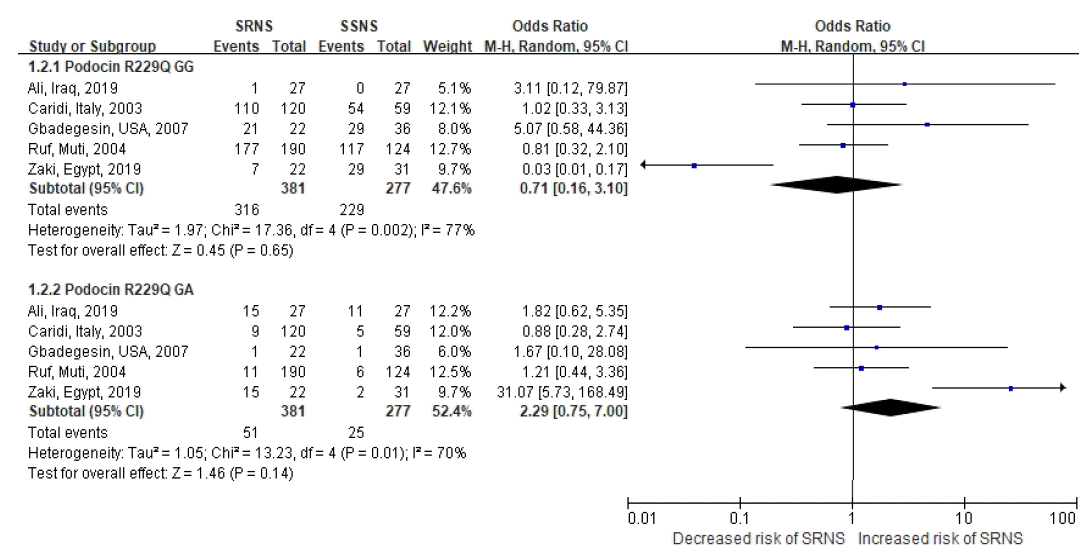
Podocin, encoded by NPHS2, is a membrane protein of glomerular epithelial cells, podocytes, linking nephrin of the slit diaphragm and intracellular signaling of podocytes. Mutations in NPHS2 are the most common cause of FSGS, at least in Caucasian populations [116,117]. The polymorphism R229Q is a well-known functional polymorphism that was reported to be associated with late-onset FSGS [118,119] or predisposition to develop FSGS [120,121]. Five studies were found to compare the allele frequency of this polymorphism between SSNS and SRNS [117,118,122-124], and the difference did not reach significance in the meta-analysis using a random effects model (Fig. 8). Polymorphism -254C>G of TRPC6, another causative gene of familial FSGS [125], was assessed in one study that reported marginally meaningful significance [126] (Table 5).

5. HLA allele frequencies

Regarding HLA allele frequencies in lieu of steroid responsiveness in pediatric NS, the full text was available for two Indian studies [127,128]. One study typed HLA class II alleles at DR and DQ loci and found that the DR-β1*150XDQ-β1*060X haplotype was significantly more frequent in SRNS than in SSNS [127] (Table 6).

Discussion

Regarding biomarkers predicting SSNS and SRNS, urinary markers were the first to be investigated [129]. The proteinuria selectivity index (SI, the ratio of immunoglobulin G clearance to transferrin or albumin clearance) was originally devised to predict glomerular damage; SI ≤0.01 was supposed to predict pathological findings of minimal change disease in patients with heavy proteinuria [130]. It was the first candidate urinary marker evaluated according to the literature search [41,129-131], but the full texts was not available or its statistical significance was not reported. According to the present systematic review, urinary markers with consistent results were ANX [25,28,48], NGAL [49-51], and VDBP [51,54,132] and these were markers of renal tissue damage. However, it can be speculated that these markers may have simply reflected kidney damage or the underlying pathology instead of predicting steroid responsiveness, because sclerosis is more progressed in SRNS than in SSNS. Urinary levels of NGAL and VDBP negatively correlated with eGFR, which would decrease with kidney damage [49,50,54]. However, investigators have asserted otherwise, by showing that VDBP and NGAL were significantly elevated in SRNS patients with normal eGFR (>100 mL/minute/1.73 m2) [49,50,54]. No study has assessed the correlation between urine ANX5 levels and eGFR. One important concern regarding urinary markers is that these markers may only indicate the severity of proteinuria [25,28]. Supporting this concern, urinary VDBP and ANX5 showed positive correlations with microalbuminuria and proteinuria [25,28,54]. However, urine VDBP distinguished SRNS independent of proteinuria [51]. Regarding ANX5, there were only conference abstracts [25,28], and NGAL was found not to be correlated with proteinuria [49]. PBSA [56], AAT [40], APO A [46], and prealbumin [51] did not have contradicting reports, but this may have been due to a lack of follow-up studies. Interestingly, APO A1, a major component of HDL, is increased in SSNS, and the investigators suggested that this molecule might not be detected because of oxidation and fragmentation in SRNS [46]. A recent study by Bennett et al. proposed using panel models to calculate the risk score of the SRNS [51]. Could these markers be used for treatment-naïve patients? Only AAT [40], ANX5 [28], NAG [44], PBSA [56], and RBP [47] were studied in treatment-naïve patients and have not been validated.
While urinary markers have been sought for since 1980, serum biomarkers have begun to be investigated in this century. Idiopathic NS has been considered a disease of the immune system, especially T cells; therefore, cytokines and lymphocyte subsets were initially studied. While there are many studies demonstrating the association between NS and the predominance of Th2 [133-135], only few studies have investigated lymphocyte subsets, cytokines, or their receptors as biomarkers for predicting steroid responsiveness [59,61,62,77,78,113]. Some of the markers confirmed the pro-inflammatory status of SSNS, while those of SRNS were similar to those of the controls [59,136,62]. Other mechanisms of kidney disease progression have also been investigated as well [58,71-73]. Among the significant markers, the significance of serum IgG/IgM may simply reflect the severity of NS [63,64]. Regarding suPAR, meta-analysis revealed a lack of significance, although individual studies have reported the significance of its prediction capacity.
Recently, the Midwest Pediatric Nephrology Consortium reported two studies using proteomics and metabolomics to investigate biomarkers of steroid responsiveness in pediatric NS [137,138]. They found that VDBP and apolipoprotein L1 (APOL1) in pre-treatment samples could differentiate SSNS and SRNS; hemopexin, adiponectin (ADIPOQ), and sex hormone-binding globulin (SHBG), in addition to VDBP and APOL1, could distinguish SRNS from SSNS when post-treatment samples were investigated. The researchers proposed a panel of VDBP, ADIPOQ, and matrix metalloproteinase 2 (MMP-2) to predict steroid responsiveness, and the panel could distinguish SRNS and SSNS with an AUC of 0.78 (P=0.003) [137]. In a metabolomics study, the same group identified creatinine, glutamine, and malonate as candidate biomarkers and used these markers along with age to draw ROC curves with an AUC >0.8 [137]. However, these studies did not provide measured values in patients and were therefore excluded from this systematic review.
The influence of polymorphisms in genes related to the progression of kidney diseases (genes related to RAS, endothelin receptor, and ApoE), glucocorticoid metabolism (MDR1, MIF, CYP3A5, NR3C1, GLCCI1, SXR), and the pathogenesis of nephrotic syndrome (cytokines, podocin, or TRPC6) on the response to steroids in pediatric NS were studied. I/D polymorphisms of ACE were not significant, as previously reported [41], while polymorphisms of AGT, ENDRA, and ApoE were significant. However, these were the results of single studies; therefore, verification is necessary before drawing any conclusions. In contrast, minor alleles of MDR1 polymorphisms C1236T (rs1128503) and G2677T/A (rs2032582) were more common in SRNS according to a meta-analysis of several studies, as previously reported in a meta-analysis [139], where multiple comparisons negated the significance of polymorphisms of G2677T/A using slightly different source studies than this study. Interestingly, polymorphism of the steroid and xenobiotic receptor (SXR) was significant, but there was no follow-up study. These results deserve notice; in a population with a higher proportion of minor alleles, pre-screening before starting steroid therapy might help predict steroid response. Among genes related to the pathogenesis of NS, polymorphism of IL-6 was significant, although the number of studies was too small to be of importance. Serum IL-6 levels were higher in patients with NS other than minimal change [140], and the IL-6-related pathway was found to be related to SRNS in an anecdotal study using transcriptome profiling [141]. Podocytes express IL-6 [142]. However, other studies have reported that the expression of IL-6 by monocytes in NS patients was not different from that in controls [136] or even lower than that in controls [143]. Further studies are necessary to ascertain the significance of this finding. The findings of studies regarding genotypes are quite heterogeneous, probably because of different genotype distributions among the target populations, in other words, ethnic differences or selection bias. For example, Zhou et al. reported that the DD genotype of ACE was associated with SRNS in Africans based on one study [144], but not in Asians or Caucasians. The II genotype was found to be associated with a decreased risk of SRNS in Asians and Caucasians by Zhou et al., but re-analysis comparing SRNS and SSNS including more recent studies revealed otherwise. Podocin polymorphism is another example; the frequency of R229Q of podocin is 0.01–7% [120]; therefore, its effect on the target population would be heterogeneous as well, which might explain the insignificance of this minor allele in the meta-analysis. Since the clinical implications of each polymorphism would differ by population, understanding the genetic characteristics of the target population may be helpful in applying the above findings.
In summary, along with the molecules implying kidney damage, biomarkers related to steroid metabolism-associated biomarkers may have a potential as a prediction biomarker for steroid responsiveness in children with NS. VDBP was found both as a serum marker in an omics study [138] and a urinary marker as well [51,54] although further validation is required. More attention and efforts to investigate the clinical significance is necessary.

Notes

Conflict of interest

No potential conflict of interest relevant to this article was reported.

Funding

This research was supported by research resettlement fund for the new faculty of Seoul National University.

References

1. Dossier C, Lapidus N, Bayer F, Sellier-Leclerc A, Boyer O, de Pontual L, et al. Epidemiology of idiopathic nephrotic syndrome in children: endemic or epidemic? Pediatr Nephrol. 2016; 31:2299–308.
crossref
2. Noone DG, Iijima K, Parekh R. Idiopathic nephrotic syndrome in children. The Lancet. 2018; 392:61–74.
crossref
3. Tullus K, Webb H, Bagga A. Management of steroid-resistant nephrotic syndrome in children and adolescents. The Lancet Child and Adolescent Health. 2018; 2:880–90.
crossref
4. Lombel RM, Gipson DS, Hodson EM. Treatment of steroid-sensitive nephrotic syndrome: New guidelines from KDIGO. Pediatric Nephrology. 2013; 28:415–26.
crossref
5. Canetta PA, Radhakrishnan J. The Evidence-Based Approach to Adult-Onset Idiopathic Nephrotic Syndrome. Front Pediatr. 2015; 3:78.
crossref
6. Stone H, Magella B, Bennett MR. The Search for biomarkers to aid in diagnosis, differentiation, and prognosis of childhood idiopathic nephrotic syndrome. Frontiers in Pediatrics. 2019; 7.
crossref
7. Trautmann A, Vivarelli M, Samuel S, Gipson D, Sinha A, Schaefer F, et al. IPNA clinical practice recommendations for the diagnosis and management of children with steroid-resistant nephrotic syndrome. Pediatric Nephrology. 2020; 35:1529–61.
crossref
8. Saleem MA. Molecular stratification of idiopathic nephrotic syndrome. Nat Rev Nephrol. 2019; 15:750–65.
crossref
9. Trautmann A, Schnaidt S, Lipska-Zietkiewicz BS, et al. Long-Term Outcome of Steroid-Resistant Nephrotic Syndrome in Children. J Am Soc Nephrol. 2017; 28:3055–65.
10. Lee JM, Kronbichler A, Shin JI, Oh J. Current understandings in treating children with steroid-resistant nephrotic syndrome. Pediatr Nephrol. 2021; 36:747–61.
crossref
11. Trautmann A, Ghiggeri GM, Azocar M, et al. Risk factors for posttransplant recurrence of steroid resistant nephrotic syndrome (SRNS): Results from the podonet registry. Pediatric Nephrology. 2015; 30:1557–8.
12. Kang HG, Ha IS, Cheong HI. Recurrence and Treatment after Renal Transplantation in Children with FSGS. Biomed Res Int. 2016; 2016:6832971.
crossref
13. Allen PJ, Chadban SJ, Craig JC, Lim WH, Allen RDM, Clayton PA, et al. Recurrent glomerulonephritis after kidney transplantation: risk factors and allograft outcomes. Kidney Int. 2017; 92:461–9.
crossref
14. Toshiyuki O, Hiroshi K, Motoshi H, Yasuhiro K, Yuko A, Michio N, Hiroshi S, et al. Effect of pre-and postoperative plasmapheresis on posttransplant recurrence of focal segmental glomerulosclerosis in children. Transplantation. 2001; 71:628–33.
15. McCarthy ET, Sharma M, Savin VJ. Circulating permeability factors in idiopathic nephrotic syndrome and focal segmental glomerulosclerosis. Clin J Am Soc Nephrol. 2010; 5:2115–21.
crossref
16. Kopp JB, Anders HJ, Susztak K, Podestà MA, Friedhelm Hildebrandt GR, Romagnani P. Podocytopathies. Nat Rev Dis Primers. 2020; 6:68.
crossref
17. Bensimhon AR, Williams AE, Gbadegesin RA. Treatment of steroid-resistant nephrotic syndrome in the genomic era. Pediatric Nephrology. 2019; 34:2279–93.
crossref
18. Barnett HL, Edelmann CM Jr, Greifer I. The primary nephrotic syndrome in children. Identification of patients with minimal change nephrotic syndrome from initial response to prednisone. A report of the international study of kidney disease in children. Journal of Pediatrics. 1981; 98:561–4.
19. Abdelsalam SM. Prediction of steroid response in nephrotic syndrome by humoral immunity assessment. Journal of Clinical Immunology. 2012; 32:S270.
20. Asokan K, Malik A. The role of shear wave elastography in predicting the clinical outcome in paediatric patients with nephrotic syndrome. Pediatric Radiology. 2019; 49:S292–S3.
21. Azizov M, Umarova Z, Safarov Z, Akhmatalieva M, Valieva F. Hypoimmune conditions in children with nephrotic syndrome. Acta Paediatrica, International Journal of Paediatrics. 2010; 99:103.
22. Chiou YH, Wang LY, Wang TH, Huang SP. Genetic polymorphisms of CYP3A5 and ABCB1 genes in steroid treatment of children with idiopathic nephrotic syndrome. Pediatric Nephrology. 2010; 25:1799–800.
23. Drannik GN, Driianska V, DuBuske LM. Assessment of HLA antigens and serum cytokine levels to predict disease progression and treatment responses in children with chronic glomerulonephritis. Journal of Allergy and Clinical Immunology. 2016; 137:AB114.
crossref
24. Garcia Martinez C, Bojórquez A. Mean platelet count as a prognostic biomarker in nephrotic syndrome. Blood Purification. 2018; 45:306.
25. Hussein AH, Ibrahim MAF, Ali MM, Mohamed ZMS. Evaluation of urinary annexin vas a prognostic marker in children with nephrotic syndrome. Nephrology Dialysis Transplantation. 2015; 30:iii147.
26. Jafar T, Prasad N, Mahdi AA. MDR-1 gene polymorphisms in steroid-responsive versus steroid-resistant nephrotic syndrome in children. Indian Journal of Clinical Biochemistry. 2017; 32:S76–S7.
crossref
27. Lipkowska K, Ostalska-Nowicka D, Smiech M, et al. The JAK/STAT signaling pathway modifications by glucocorticosteroids in the leukocytes of children with nephrotic syndrome. Nephrology Dialysis Transplantation. 2012; 27:ii324.
28. Liu T, Zhang B. Clinical significance of urine annexin a5 in primary nephrotic syndrome of children. Pediatric Nephrology. 2013; 28:1589.
29. Mishra OP, Kumar R, Narayan G, Srivastava P, Abhinay A, Prasad R, et al. Toll Like Receptor (TLR) -3, TLR-4 and CD 80 expressions in peripheral blood mononuclear cells and urinary CD 80 levels in children with idiopathic nephrotic syndrome. Pediatric Nephrology. 2016; 31:1828–9.
30. Prasad N, Jafar T, Agarwal V, Agarwal S, Sharma RK, Gupta A. MDR-1 gene polymorphisms in steroid responsive versus steroid resistant nephrotic syndrome in children. Nephrology. 2010; 15:99.
31. Prasad N, Jafar T, Agarwal V, Sharma RK, Agarwal S, Gupta A. Association of MDR-1 gene G2677T/A locus for TT/AA genotype with steroid resistance in children with nephrotic syndrome. NDT Plus. 2010; 3:iii278.
32. Sai S, Yamamoto M, Yamaguchi R, Chapman KE, Hongo T. Reciprocal regulation of 11ß-HSDS may predict steroid sensitivity in childhood nephrotic syndrome. Hormone Research in Paediatrics. 2017; 88:250.
crossref
33. Sharipov AM, Khamzayev KA. Immune condition in children with nephrotic syndrome. Intensive Care Medicine. 2012; 38:S183.
34. Silska M, Ostalska-Nowicka D, Smiech M, et al. SOCS1 over-expression in peripheral blood lymphocyte may predict resistance to steroids in childhood nephrotic syndrome. Pediatric Nephrology. 2010; 25:1883.
35. Singh H, Prasad N, Jaiswal AK, Agarwal V, Singh MK, Chauhan R. Expression and function of P-glycoprotein and multidrug resistanceassociated protein-1 and presence of homozygous mutant of multidrug resistance-associated protein-1 single nucleotide polymorphism G2677T/A identify steroid resistance phenotype in childhood idiopathic nephrotic syndrome. Indian Journal of Nephrology. 2019; 29:S30–S1.
36. Sinha A, Saini S, Saini H, Hari P, Bagga A. Urinary CD80 (uCD80), serum urokinase type plasminogen activator receptor (suPAR) and serum angiopoietin like 4 (Angptl4) do not distinguish steroid sensitive from steroid resistant nephrotic syndrome (NS). Pediatric Nephrology. 2016; 31:1839.
37. Weissbach A, Garty BZ, Krause I, Davidovits M. High serum TNF-alpha level is negatively correlated with steroid responsiveness in primary pediatric nephrotic syndrome. Pediatric Nephrology. 2013; 28:1583.
38. Youssef DM, Elbehidy RM, Abdelhalim HS, Amr GE. Soluble interleukine 2 receptor and MDR1 gene expression levels as inflammatory biomarkers for prediction of steroid response in children with nephrotic syndrome. Pediatric Nephrology. 2010; 25:1831.
39. Zurbig P, Ozaltin F, Anarat A, et al. Peptide biomarker signatures in steroidresistant nephrotic syndrome. Nephrology Dialysis Transplantation. 2018; 33:i630.
40. Yang J, Zhang BL. Value of determination of haptoglobin and α1- antitrypsin in predicting response to glucocorticoid therapy in children with primary nephrotic syndrome. Chinese Journal of Contemporary Pediatrics. 2015; 17:227–31.
41. Zhou TB, Qin YH, Su LN, Lei FY, Huang WF, Zhao YJ. ACE I/D gene polymorphism can't predict the steroid responsiveness in asian children with idiopathic nephrotic syndrome: A meta-analysis. PLoS ONE. 2011; 6.
crossref
42. Khurana M, Traum AZ, Aivado M, Wells MP, Guerrero M, Grall F, et al. Urine proteomic profiling of pediatric nephrotic syndrome. Pediatr Nephrol. 2006; 21:1257–65.
crossref
43. Calişkan S, Hacibekiroğlu M, Sever L, Ozbay G, Arisoy N. Urinary N-acetyl-beta-D-glucosaminidase and beta 2-microglobulin excretion in primary nephrotic children. Nephron. 1996; 74:401–4.
44. Mishra OP, Jain P, Srivastava P, Prasad R. Urinary N-acetyl-beta-D glucosaminidase (NAG) level in idiopathic nephrotic syndrome. Pediatr Nephrol. 2012; 27:589–96.
crossref
45. Piyaphanee N, Ma Q, Kremen O, Czech K, Greis K, Mitsnefes M, et al. Discovery and initial validation of α 1-B glycoprotein fragmentation as a differential urinary biomarker in pediatric steroidresistant nephrotic syndrome. Proteomics-Clinical Applications. 2011; 5:334–42.
crossref
46. Suresh CP, Saha A, Kaur M, Kumar R, Dubey NK, Basak T, et al. Differentially expressed urinary biomarkers in children with idiopathic nephrotic syndrome. Clin Exp Nephrol. 2016; 20:273–83.
crossref
47. Mastroianni Kirsztajn G, Nishida SK, Silva MS, Ajzen H, Pereira AB. Urinary retinol-binding protein as a prognostic marker in the treatment of nephrotic syndrome. Nephron. 2000; 86:109–14.
crossref
48. Simsek B, Buyukcelik M, Soran M, Bayazit AK, Noyan A, Seydaoglu G, et al. Urinary annexin V in children with nephrotic syndrome: A new prognostic marker? Pediatric Nephrology. 2008; 23:79–82.
crossref
49. Bennett MR, Piyaphanee N, Czech K, Mitsnefes M, Devarajan P. NGAL distinguishes steroid sensitivity in idiopathic nephrotic syndrome. Pediatric Nephrology. 2012; 27:807–12.
crossref
50. Nickavar A, Safaeian B, Sadeghi-Bojd S, Lahouti Harah dashti A. Urine Neutrophil Gelatinase Associated Lipocalin to Creatinine Ratio: A Novel Index for Steroid Response in Idiopathic Nephrotic Syndrome. Indian J Pediatr. 2016; 83:18–21.
crossref
51. Bennett MR, Pleasant L, Haffner C, Ma Q, Haffey WD, Ying J, et al. A novel biomarker panel to identify steroid resistance in childhood idiopathic nephrotic syndrome. Biomarker Insights. 2017; 12.
crossref
52. Lee H, Han KH, Lee SE, Kim SH, Kang HG, Cheong HI. Urinary exosomal WT1 in childhood nephrotic syndrome. Pediatr Nephrol. 2012; 27:317–20.
crossref
53. Mirkovic K, Doorenbos CR, Dam WA, Heerspink HJL, Slagman MCJ, Nauta FL, et al. Urinary vitamin D binding protein: a potential novel marker of renal interstitial inflammation and fibrosis. PLoS One. 2013; 8:e55887.
crossref
54. Bennett MR, Pordal A, Haffner C, Pleasant L, Ma Q, Devarajan P. Urinary vitamin D-binding protein as a biomarker of steroid-resistant nephrotic syndrome. Biomarker Insights. 2016; 11:1–6.
crossref
55. Cengiz N, Bayazit AK, Noyan A, Anarat R, Anarat A. Glycosaminoglycan excretion in children with nephrotic syndrome. Pediatric Nephrology. 2005; 20:486–90.
crossref
56. Gopal N, Koner BC, Bhattacharjee A, Bhat V. Assay of urinary protein-bound sialic acid can differentiate steroidsensitive nephrotic syndrome from steroid-resistant cases. Saudi J Kidney Dis Transpl. 2016; 27:37–40.
crossref
57. Shalhoub RJ. Pathogenesis of lipoid nephrosis: a disorder of T-cell function. Lancet. 1974; 2:556–60.
crossref
58. Mishra OP, Kumar R, Narayan G, Srivastava P, Abhinay A, Prasad R, et al. Toll-like receptor 3 (TLR-3), TLR-4 and CD80 expression in peripheral blood mononuclear cells and urinary CD80 levels in children with idiopathic nephrotic syndrome. Pediatric Nephrology. 2017; 32:1355–61.
crossref
59. Tain YL, Liu CA, Yang KD. Implications of blood soluble and cell surface tumor necrosis factor receptors in childhood nephrotic syndrome. Pediatric Nephrology. 2002; 17:926–32.
crossref
60. Guan FJ, Peng QQ, Wang LL, Yan XB, Dong C, Jiang XH. Histone deacetylase-2 expression and activity in children with nephrotic syndrome with different glucocorticoid response. Pediatr Nephrol. 2018; 33:269–76.
crossref
61. Youssef DM, Elbehidy RM, Abdelhalim HS, Amr GE. Soluble interleukine-2 receptor and MDR1 gene expression levels as inflammatory biomarkers for prediction of steroid response in children with nephrotic syndrome. Iran J Kidney Dis. 2011; 5:154–61.
62. Ling C, Wang X, Chen Z, Fan J, Meng Q, Zhou N, et al. Altered B-Lymphocyte homeostasis in Idiopathic Nephrotic Syndrome. Front Pediatr. 2019; 7:377.
crossref
63. Roy RR, Roy E, Rahman MH, Hossain MM. Serum immunoglobulin G, M and IgG:IgM ratio as predictors for outcome of childhood nephrotic syndrome. World Journal of Pediatrics. 2009; 5:127–31.
crossref
64. Viet TL, Trung KN, Manh HD, Quy KT, Van TP, Van MC, et al. Serum igg level and igg/igm ratio on admission predict steroid-resistant response in vietnamese children with idiopathic nephrotic syndrome. Nephro-Urology Monthly. 2019; 11.
crossref
65. Wei C, Möller CC, Altintas MM, Li J, Schwarz K, Zacchigna S, et al. Modification of kidney barrier function by the urokinase receptor. Nat Med. 2008; 14:55–63.
crossref
66. Sever S, Trachtman H, Wei C, Reiser J. Is there clinical value in measuring suPAR levels in FSGS? Clin J Am Soc Nephrol. 2013; 8:1273–5.
crossref
67. Maas RJ, Deegens JK, Wetzels JF. Serum suPAR in patients with FSGS: trash or treasure? Pediatr Nephrol. 2013; 28:1041–8.
crossref
68. Peng Z, Mao J, Chen X, Cai F, Gu W, Fu H, et al. Serum suPAR levels help differentiate steroid resistance from steroid-sensitive nephrotic syndrome in children. Pediatr Nephrol. 2015; 30:301–7.
crossref
69. Mousa SO, Saleh SM, Aly HM, Amin MH. Evaluation of serum soluble urokinase plasminogen activator receptor as a marker for steroid-responsiveness in children with primary nephrotic syndrome. Saudi J Kidney Dis Transpl. 2018; 29:290–6.
crossref
70. Cuzzoni E, Franca R, De Iudicibus S, Marcuzzi A, Lucafò M, Pelin M, et al. MIF plasma level as a possible tool to predict steroid responsiveness in children with idiopathic nephrotic syndrome. European Journal of Clinical Pharmacology. 2019; 75:1675–83.
71. Watany MM, El-Horany HES. Nephronectin (NPNT) and the prediction of nephrotic syndrome response to steroid treatment. European Journal of Human Genetics. 2018; 26:1354–60.
crossref
72. Ahmed HM, Morgan DS, Doudar NA, Naguib MS. High Serum Endothelin-1 Level is Associated with Poor Response to Steroid Therapy in Childhood-Onset Nephrotic Syndrome. Saudi J Kidney Dis Transpl. 2019; 30:769–74.
crossref
73. Bakr A, Abul Hassan S, Shoker M, Zaki M, Hassan R. Oxidant stress in primary nephrotic syndrome: Does it modulate the response to corticosteroids? Pediatric Nephrology. 2009; 24:2375–80.
crossref
74. Ochocińska A, Jarmużek W, Janas R, Grenda R. Response to corticosteroid therapy is not related to serum and urine NGAL concentration in nephrotic children. Pediatria Polska. 2018; 93:245–50.
crossref
75. Fodor P, Saitúa MT, Rodriguez E, González B, Schlesinger L. T-cell dysfunction in minimal-change nephrotic syndrome of childhood. Am J Dis Child. 1982; 136:713–7.
crossref
76. Adalat S, Taylor J, Booth C, et al. Efficacy of rituximab in childhood nephrotic syndrome. Pediatric Nephrology. 2010; 25:1795.
77. Stachowski J, Barth C, Michałkiewicz J, Krynicki T, Jarmoliński T, Runowski D, et al. Th1/Th2 balance and CD45-positive T cell subsets in primary nephrotic syndrome. Pediatr Nephrol. 2000; 14:779–85.
crossref
78. Jaiswal A, Prasad N, Agarwal V, Yadav B, Tripathy D, Rai M, et al. Regulatory and effector T cells changes in remission and resistant state of childhood nephrotic syndrome. Indian J Nephrol. 2014; 24:349–55.
crossref
79. Nakajima H, Takenaka M, Kaimori JY, Hamano T, Iwatani H, Sugaya T, et al. Activation of the signal transducer and activator of transcription signaling pathway in renal proximal tubular cells by albumin. J Am Soc Nephrol. 2004; 15:276–85.
crossref
80. Ostalska-Nowicka D, Smiech M, Jaroniec M, Zaorska K, Zawierucha P, Szaflarski W, et al. SOCS3 and SOCS5 mRNA expressions may predict initial steroid response in nephrotic syndrome children. Folia Histochem Cytobiol. 2011; 49:719–28.
crossref
81. Zaorska K, Zawierucha P, Ostalska-Nowicka D, Nowicki M. SOCS3 is epigenetically up-regulated in steroid resistant nephrotic children. Acta biochimica Polonica. 2016; 63:131–8.
crossref
82. Hammad A, Yahia S, Gouida MS, Bakr A, El-farahaty RM. Low expression of glucocorticoid receptors in children with steroidresistant nephrotic syndrome. Pediatr Nephrol. 2013; 28:759–63.
crossref
83. Zahran AM, Aly SS, Elsayh KI, Badawy A, Gamal Y. Glucocorticoid receptors expression and histopathological types in children with nephrotic syndrome. Renal Failure. 2014; 36:1067–72.
crossref
84. Reiser J, von Gersdorff G, Loos M, Oh J, Asanuma K, Giardino L, et al. Induction of B7-1 in podocytes is associated with nephrotic syndrome. J Clin Invest. 2004; 113:1390–7.
crossref
85. Ji LD, Zhang LN, Shen P, Wang P, Zhang Y, Xing W, et al. Association of angiotensinogen gene M235T and angiotensin-converting enzyme gene I/D polymorphisms with essential hypertension in Han Chinese population: a meta-analysis. J Hypertens. 2010; 28:419–28.
crossref
86. Qin YH, Zhou TB, Su LN, Lei FY, Huang WF, Zhao YJ. Association between ACE polymorphism and risk of IgA nephropathy: a meta-analysis. J Renin Angiotensin Aldosterone Syst. 2011; 12:215–23.
crossref
87. Schena FP, D'Altri C, Cerullo G, Manno C, Gesualdo L. ACE gene polymorphism and IgA nephropathy: an ethnically homogeneous study and a meta-analysis. Kidney Int. 2001; 60:732–40.
crossref
88. Al-Eisa A, Haider MZ, Srivastva BS. Angiotensin converting enzyme gene insertion/deletion polymorphism in idiopathic nephrotic syndrome in Kuwaiti Arab children. Scand J Urol Nephrol. 2001; 35:239–42.
89. Celik US, Noyan A, Bayazit AK, Büyükçelik M, Dursun H, Anarat A, et al. ACE gene polymorphism in Turkish children with nephrotic syndrome. Ren Fail. 2006; 28:401–3.
90. Prasun P, Prasad N, Tripathi G, Jafar T, Sharda S, Gulati S, et al. Association of angiotensin-converting enzyme gene I/D polymorphism with steroid responsiveness in childhood nephrotic syndrome. Indian J Nephrol. 2011; 21:26–9.
crossref
91. Sasse B, Hailemariam S, Wüthrich RP, Kemper MJ, Neuhaus TJ. Angiotensin converting enzyme gene polymorphisms do not predict the course of idiopathic nephrotic syndrome in Swiss children. Nephrology. 2006; 11:538–41.
crossref
92. Serdaroglu E, Mir S, Berdeli A, Aksu N, Bak M. ACE gene insertion/deletion polymorphism in childhood idiopathic nephrotic syndrome. Pediatr Nephrol. 2005; 20:1738–43.
crossref
93. Tsai IJ, Yang YH, Lin YH, Wu VC, Tsau YK, Hsieh FJ. Angiotensinconverting enzyme gene polymorphism in children with idiopathic nephrotic syndrome. Am J Nephrol. 2006; 26:157–62.
crossref
94. Batinic D, Sertic J, Coric M, Konjevoda P, Batinic D, Milosevic D. Angiotensin-converting enzyme genotype is not a significant genetic risk factor for idiopathic nephrotic syndrome in Croatian children. Nephron. 2015; 130:29–34.
crossref
95. Tabel Y, Berdeli A, Mir S, Serdaroglu E, Yilmaz E. Effects of genetic polymorphisms of the renin-angiotensin system in children with nephrotic syndrome. J Renin Angiotensin Aldosterone Syst. 2005; 6:138–44.
crossref
96. Abdel-Hafez M, Shimada M, Lee PY, Johnson RJ, Garin EH. Idiopathic Nephrotic Syndrome and Atopy: Is There a Common Link? American Journal of Kidney Diseases. 2009; 54:945–53.
crossref
97. Daehn I, Casalena G, Zhang T, Shi S, Fenninger F, Barasch N, et al. Endothelial mitochondrial oxidative stress determines podocyte depletion in segmental glomerulosclerosis. J Clin Invest. 2014; 124:1608–21.
crossref
98. Ezzat GM, Ali AB, Mohamed NA, Hetta HF. Association of endothelin receptor type A rs5333 gene polymorphism with steroid response in Egyptian children with idiopathic nephrotic syndrome. Pharmacogenomics. 2019; 20:133–41.
crossref
99. Attila G, Noyan A, Karabay Bayazit A, Acarturk E, Anarat A. Apolipoprotein E polymorphism in childhood nephrotic syndrome. Pediatr Nephrol. 2002; 17:359–62.
crossref
100. Ye J, Yu Z, Ding J, Chen Y, Huang J, Yao Y, et al. Genetic variations of the NR3C1 gene in children with sporadic nephrotic syndrome. Biochem Biophys Res Commun. 2006; 348:507–13.
crossref
101. Cheong HI, Kang HG, Schlondorff J. GLCCI1 single nucleotide polymorphisms in pediatric nephrotic syndrome. Pediatr Nephrol. 2012; 27:1595–9.
102. Choi HJ, Cho HY, Ro H, Lee SH, Han KH, Lee H, et al. Polymorphisms of the MDR1 and MIF genes in children with nephrotic syndrome. Pediatr Nephrol. 2011; 26:1981–8.
crossref
103. Jafar T, Prasad N, Agarwal V, et al. MDR-1 gene polymorphisms in steroid-responsive versus steroid-resistant nephrotic syndrome in children. Nephrol Dial Transplant. 2011; 26:3968–74.
crossref
104. Kara A, Gurgoze MK, Kara M, Aydin M. Evaluation of Genetic Polymorphisms for Determining Steroid Response in Nephrotic Children. Ann Clin Lab Sci. 2018; 48:478–83.
105. Moussa A, Mabrouk S, Hamdouni H, Ajmi M, Tfifha M, Omezzine A, et al. MDR-1 and CYP3A5 polymorphisms in pediatric idiopathic nephrotic syndrome: Impact on susceptibility and response to steroids (Preliminary Results). Clinical Laboratory. 2017; 63:1233–42.
crossref
106. Youssef DM, Attia TA, El-Shal AS, Abduelometty FA. Multi-drug resistance-1 gene polymorphisms in nephrotic syndrome: impact on susceptibility and response to steroids. Gene. 2013; 530:201–7.
crossref
107. Berdeli A, Mir S, Ozkayin N, Serdaroglu E, Tabel Y, Cura A. Association of macrophage migration inhibitory factor -173C allele polymorphism with steroid resistance in children with nephrotic syndrome. Pediatr Nephrol. 2005; 20:1566–71.
crossref
108. Vivarelli M, D'Urbano LE, Stringini G, et al. Association of the macrophage migration inhibitory factor -173*C allele with childhood nephrotic syndrome. Pediatr Nephrol. 2008; 23:743–8.
crossref
109. Ramayani OR, Sekarwana N, Trihono PP, Sadewa AH, Lelo A. A genetic study of steroid-resistant nephrotic syndrome: relationship between polymorphism -173 G to C in the MIF gene and serum level MIF in children. J Dev Orig Health Dis. 2016; 7:102–7.
crossref
110. Świerczewska M, Ostalska-Nowicka D, Kempisty B, Szczepankiewicz A, Nowicki M. Polymorphic variants of MIF gene and prognosis in steroid therapy in children with idiopathic nephrotic syndrome. Acta Biochim Pol. 2014; 61:67–75.
crossref
111. Chiou YH, Wang LY, Wang TH, Huang SP. Genetic polymorphisms influence the steroid treatment of children with idiopathic nephrotic syndrome. Pediatr Nephrol. 2012; 27:1511–7.
crossref
112. Turolo S, Edefonti A, Lepore M, Ghio L, Cuzzoni E, Decorti G, et al. SXR rs3842689: A prognostic factor for steroid sensitivity or resistance in pediatric idiopathic nephrotic syndrome. Pharmacogenomics. 2016; 17:1227–33.
crossref
113. Jafar T, Agrawal S, Mahdi AA, Sharma RK, Awasthi S, Agarwal GG. Cytokine gene polymorphism in idiopathic nephrotic syndrome children. Indian J Clin Biochem. 2011; 26:296–302.
crossref
114. Midan DAR, Elhelbawy NG, Habib MSE, Ahmedy IA, Noreldin RI. Cytokine Gene Polymorphism in Children With Idiopathic Nephrotic Syndrome. Iran J Kidney Dis. 2017; 11:414–21.
115. Youssef DM, El-Shal AS, Hussein S, Salah K, Ahmed A. Tumor necrosis factor alpha gene polymorphisms and haplotypes in Egyptian children with nephrotic syndrome. Cytokine. 2018; 102:76–82.
crossref
116. Caridi G, Bertelli R, Carrea A, Duca MD, Catarsi P, Artero M, et al. Prevalence, genetics, and clinical features of patients carrying podocin mutations in steroid-resistant nonfamilial focal segmental glomerulosclerosis. J Am Soc Nephrol. 2001; 12:2742–6.
crossref
117. Ruf RG, Lichtenberger A, Karle SM, Haas JP, Anacleto FE, Schultheiss M, et al. Patients with mutations in NPHS2 (podocin) do not respond to standard steroid treatment of nephrotic syndrome. J Am Soc Nephrol. 2004; 15:722–32.
crossref
118. Caridi G, Bertelli R, Di Duca M, Dagnino M, Emma F, Muda AO, et al. Broadening the spectrum of diseases related to podocin mutations. J Am Soc Nephrol. 2003; 14:1278–86.
crossref
119. Tsukaguchi H, Sudhakar A, Le TC, Nguyen T, Yao J, Schwimmer JA, et al. NPHS2 mutations in late-onset focal segmental glomerulosclerosis: R229Q is a common disease-associated allele. J Clin Invest. 2002; 110:1659–66.
crossref
120. Franceschini N, North KE, Kopp JB, McKenzie L, Winkler C. NPHS2 gene, nephrotic syndrome and focal segmental glomerulosclerosis: a HuGE review. Genet Med. 2006; 8:63–75.
crossref
121. Lu L, Wan H, Yin Y, Feng W, Wang M, Zou Y, et al. The p.R229Q variant of the NPHS2 (podocin) gene in focal segmental glomerulosclerosis and steroid-resistant nephrotic syndrome: a meta-analysis. Int Urol Nephrol. 2014; 46:1383–93.
crossref
122. Ali SH, Mohammed RK, Saheb HA, Abdulmajeed BA. R229Q Polymorphism of NPHS2 Gene in Group of Iraqi Children with Steroid-Resistant Nephrotic Syndrome. Int J Nephrol. 2017; 2017:1407506.
crossref
123. Gbadegesin R, Hinkes B, Vlangos C, Mucha B, Liu J, Hopcian J, et al. Mutational analysis of NPHS2 and WT1 in frequently relapsing and steroid-dependent nephrotic syndrome. Pediatr Nephrol. 2007; 22:509–13.
crossref
124. Zaki M, El-Shaer S, Rady S, El-Salam MA, Abd-El-Salam R, Alkashlan IA, et al. Analysis of NPHS2 Gene Mutations in Egyptian Children with Nephrotic Syndrome. Open Access Maced J Med Sci. 2019; 7:3145–8.
crossref
125. Winn MP, Conlon PJ, Lynn KL, Farrington MK, Creazzo T, Hawkins AF, et al. A mutation in the TRPC6 cation channel causes familial focal segmental glomerulosclerosis. Science. 2005; 308:1801–4.
126. Kuang XY, Huang WY, Xu H, Shi Y, Zhang X, Niu X, et al. 254C>G: a TRPC6 promoter variation associated with enhanced transcription and steroid-resistant nephrotic syndrome in Chinese children. Pediatr Res. 2013; 74:511–6.
127. Gulati S, Tripathi P, Patil SJ, Sharma RK, Agarwal S. Is typing for HLA class II alleles beneficial in Indian children with idiopathic nephrotic syndrome? Pediatric Nephrology. 2007; 22:528–32.
crossref
128. Ramanathan AS, Senguttuvan P, Chinniah R, Vijayan M, Thirunavukkarasu M, Raju K, et al. Association of HLA-DR/DQ alleles and haplotypes with nephrotic syndrome. Nephrology (Carlton). 2016; 21:745–52.
crossref
129. Schwarz R, Rossipal E. The prognosis of idiopathic nephrotic syndrome: a comparative study between the index of selectivity of proteinuria and the findings in renal biopsies. Padiatrie und Padologie. 1980; 15:131–6.
130. Lagrue G, Laurent J, Robeva R, Laurent G, Philippon C. Proteinuria selectivity index: prognostic value in idiopathic nephrotic syndromes. Annales de médecine interne. 1991; 142:249–53.
131. Zaki M, Deasy PF, Daoud AS. Proteinuria selectivity in childhood nephrotic syndrome. Bahrain Medical Bulletin. 1997; 19:15–7.
132. Choudhary A, Mohan Raj PS, Sonal S, Krishnamurthy S, Rajappa M. Association of urinary Vitamin-D binding protein and neutrophil gelatinase-associated lipocalin with steroid responsiveness in idiopathic nephrotic syndrome of childhood. Indian Journal of Clinical Biochemistry. 2018; 33:S90.
133. Kaneko K, Tuchiya K, Fujinaga S, Kawamura R, Ohtomo Y, Shimizu T, et al. Th1/Th2 balance in childhood idiopathic nephrotic syndrome. Clin Nephrol. 2002; 58:393–7.
crossref
134. Stachowski J, Barth C, Michalkiewicz J, Krynicki T, Jarmoliński T, Runowski D, et al. Th1/Th2 balance and CD45-positive T cell subsets in primary nephrotic syndrome. Pediatr Nephrol. 2000; 14:779–85.
crossref
135. Yap HK, Cheung W, Murugasu B, Sim SK, Seah CC, Jordan SC. Th1 and Th2 cytokine mRNA profiles in childhood nephrotic syndrome: evidence for increased IL-13 mRNA expression in relapse. J Am Soc Nephrol. 1999; 10:529–37.
136. Bustos C, Gonzalez E, Muley R, Alonso JL, Egido J. Increase of tumour necrosis factor alpha synthesis and gene expression in peripheral blood mononuclear cells of children with idiopathic nephrotic syndrome. Eur J Clin Invest. 1994; 24:799–805.
137. Agrawal S, Merchant ML, Kino J, Li M, Wilkey DW, Gaweda AE, et al. Predicting and Defining Steroid Resistance in Pediatric Nephrotic Syndrome Using Plasma Proteomics. Kidney International Reports. 2020; 5:66–80.
crossref
138. Gooding JR, Agrawal S, McRitchie S, Acuff Z, Merchant ML, Klein JB, et al. Predicting and Defining Steroid Resistance in Pediatric Nephrotic Syndrome Using Plasma Metabolomics. Kidney Int Rep. 2020; 5:81–93.
crossref
139. Han SS, Xu YQ, Lu Y, Gu XC, Wang Y. A PRISMA-compliant metaanalysis of MDR1 polymorphisms and idiopathic nephrotic syndrome: Susceptibility and steroid responsiveness. Medicine (Baltimore). 2017; 96:e7191.
140. Wang L, Li Q, Wang L, Li C, Yang H, Wang X, et al. The role of Th17/IL-17 in the pathogenesis of primary nephrotic syndrome in children. Kidney Blood Press Res. 2013; 37:332–45.
crossref
141. Kang HG, Seo H, Lim JH, Kim JI, Han KH, Park HW, et al. Markers of disease and steroid responsiveness in paediatric idiopathic nephrotic syndrome: Whole-transcriptome sequencing of peripheral blood mononuclear cells. J Int Med Res. 2017; 45:948–63.
crossref
142. Xing CY, Saleem MA, Coward RJ, Ni L, Witherden IR, Mathieson PW. Direct effects of dexamethasone on human podocytes. Kidney Int. 2006; 70:1038–45.
crossref
143. Zachwieja J, Bobkowski W, Dobrowolska-Zachwieja A, Lewandowska-Stachowiak M, Zaniew M, Maciejewski J. Intracellular cytokines of peripheral blood lymphocytes in nephrotic syndrome. Pediatr Nephrol. 2002; 17:733–40.
144. Zhou TB, Qin YH, Su LN, Lei F, Huang WF, Zhao Y, et al. Insertion/deletion (I/D) polymorphism of angiotensin-converting enzyme gene in steroid-resistant nephrotic syndrome for children: a genetic association study and meta-analysis. Ren Fail. 2011; 33:741–8.
crossref

Fig. 1.
Flow chart of literature search. NS, nephrotic syndrome; SSNS, steroid sensitive NS; SRNS, steroid resistant nephrotic syndrome.
ckd-25-2-92f1.tif
Fig. 2.
Prediction of SRNS using immunoglobulin.
ckd-25-2-92f2.tif
Fig. 3.
Prediction of SRNS using suPAR.
ckd-25-2-92f3.tif
Fig. 4.
Distribution of ACE polymorphism and the risk of SRNS.
ckd-25-2-92f4.tif
Fig. 5.
Distribution of MDR1 polymorphism and the risk of SRNS.
ckd-25-2-92f5.tif
Fig. 6.
Distribution of MIF and CYP3A5 polymorphism and the risk of SRNS.
ckd-25-2-92f6.tif
Fig. 7.
Distribution of TNFα and IL-6 polymorphism and the risk of SRNS.
ckd-25-2-92f7.tif
Fig. 8.
Distribution of podocin polymorphism and the risk of SRNS.
ckd-25-2-92f8.tif
Table 1.
Urinary Markers
Marker Method (unit) No. of SSNS (M:F) Age No. of SRNS (M:F) Age Value in SSNS Value in SRNS P value AUC <95% CI> Cutoff Author, year Significant
A1BGa ELISA (n.p.) 14 17 241.52 318.05 n.s. 0.58 Bennett, 2017 N
7.5±0.8 12.3±1.2 <97.01–601.29> <139.00–727.74> <0.36–0.79>
A2M/Cr ELISA (µg/mg) 20 (15:5) 20 (16:4) 0.906 3.35 n.s. Suresh, 2016 N
6.28±3.65 8.43±4.13 [0.07–43.61] [0.01–10.32]
A2Ma Immunonephelometry (n.p.) 14 17 110.19 137.11 n.s. 0.52 Bennett, 2017 N
7.5±0.8 12.3±1.2 <31.70–383.10> <44.26–424.79> <0.30–0.73>
AAT ELISA (n.p.) 58 (43:15) 26 (18:8) 3.9 9.6 <0.05 0.899 0.0696 Yang, 2015 Y
5±3 6±4 [[2.3-6.5]] [[8.2–18.8]]
AGP1a ELISA (n.p.) 14 17 1340.72 141.97 n.s. 0.57 Bennett, 2017 N
7.5±0.8 12.3±1.2 <179.35–10 022.32> <22.88–881.03> <0.35–0.79>
AGP2 ELISA (µg/mg) 20 (15:5) 20 (16:4) 3.23 2.47 n.s. Suresh, 2016 N
(ORM2)/Cr 6.28±3.65 8.43±4.13 [0.78–40.12] [0.005–14.14]
AGP2 (ORM2)a,b ELISA (n.p.) 14 17 266.72 171.01 n.s. 0.60 Bennett, 2017 N
7.5±0.8 12.3±1.2 <117.65–604.69> <81.37–359.43> <0.39–0.80>
24hr urine Annexin V ELISA (ng/g) 23 (11:12) 22 (17:5) 5,048.8 2,839.5 0.006 ≥4,000 Simsek, 2008 Y
9.4±3.4 9.2±4.5 [1,272.5–40,498.4] [131.1–5,835.4]
APO A1/Cr ELISA (µg/mg) 20 (15:5) 20 (16:4) 3.699 0.133 <0.001 0.99 SRNS <0.48 Suresh, 2016 Y
6.28±3.65 8.43±4.13 [0.484–56.17] [0.05–0.29] <0.9-1.0>
β2MG/Cr Radioimmunoassay (μg/mM) 39 17 26.70 37.19 n.s. Calişkan, 1996 N
CD80/Cr ELISA (ng/g) 25 (21:4) 30 (18:12) 536.8 870.0 0.029 Sinha, 2016 Y
7.0 [[5.0, 8.5]] 4.5 [[3.0, 11.0]] [[297.8,913.5]] [[518.3,1186.4]]
Fetuin-Aa ,b ELISA (n.p.) 14 17 15,607.72 36 723.78 n.s. 0.68 Bennett, 2017 Y
7.5±0.8 12.3±1.2 <6,006.81–40,554.13> <13,878.94–97,171.38> <0.48–0.88>
GAG/Cr Dimethylmethylene blue assay (mg/g) 34 (21:13) 20 (12:8) 132.15±101.55 113.01±78.46 n.s. Cengiz, 2005 Y
3.7±1.6 10.9±3.8
Hemopexina ELISA (n.p.) 14 17 3126.86 4019.45 n.s. 0.56 Bennett, 2017 Y
7.5±0.8 12.3±1.2 <1,120.64–8,724.72> <1583.99–10 199.55> <0.35–0.77>
LRG1/Cr ELISA (µg/mg) 20 (15:5) 20 (16:4) 4.83 6.66 n.s. Suresh, 2016 N
6.28±3.65 8.43±4.13 [1.25–30.98] [0.69–83.96]
NAG/Cr (U/mM) Enzyme assay (U/mM) 39 17 5.9. 4.09 n.s. Calişkan, 1996 N
NAG/Cr (U/g) 27 (18:9) 8 (6:2) 99.8±24.18 167.5±63.6 <0.001 0.921 SSNS ≤108.9 Mishra, 2012 N
4.6±3.05 6.19±4.9 [0.832–1.011]
NGAL ELISA (ng/mL, ng/mg) 9 15 (10:5) 6.3[[5.7–22.8]] 172.3 [[18.8–789]] <0.001 0.91 15 Bennett, 2012 Y
NGAL/Cr
NGAL/Cr ELISA (ng/mg) 25 (18:7) 27 (16:11) 0.20 [0.10–0.32] 1.15 [0.15–11.36] 0.001 0.7593 0.46 Nickavar, 2016 Y
5.8±3.3 6.3±3.9 < 0.6195–0.8990>
NGALa, b ELISA (n.p.) 14 17 7.16 33.48 0.011 0.76 Bennett, 2017 Y
7.5±0.8 12.3±1.2 <3.00–17.06> <15.22–73.64> <0.58–0.94>
PBSA/Cr Aminoff’s method (μg/mg) 47 (39:8) 23 (7:1) 2.10±0.73 3.92±1.24 <0.05 0.814 2.71 Gopal, 2016 Y
5.82 ±1.1 6.30±0.8
Prealbumina,b ELISA (n.p.) 14 17 5,000.48 33,079.70 0.014 0.73 Bennett, 2017 Y
7.5±0.8 12.3±1.2 <1,655.35–15,105.43> <12,129.94–90,212.00> <0.55–0.91>
RBP ELISA (mg/L) 17 10 0.135 [0.022–6.645] 11.16[0.072-85.89] 0.001 >1.0 Mastroianni, 2000 Y
RBP4/Cr ELISA 20 (15:5) 20 (16:4) 2.06 1.67 n.s. Suresh, 2016 N
6.28±3.65 8.43±4.13 [0.49–31.33] [0.003–10.68]
Thyroxine-binding globulina ELISA (n.p.) 14 17 1237.83 1639.78 n.s. 0.57 Bennett, 2017 N
7.5±0.8 12.3±1.2 <275.92–5553.08> <419.97–6402.53> <0.36–0.78>
VDBP ELISA (ng/mL) 10 24 (Higher Cr) 203.7 13,659 0.007 0.87 362 Bennett, 2016 Y
11.3 [[39.7–717.9]] [[477–22,979]]
VDBPa ,b ELISA (n.p.) 14 17 353.58 3708.40 0.018 0.77 Bennett, 2017 Y
7.5±0.8 12.3±1.2 <84.36–1,482.06> <1010.16–13,613.90> <0.58–0.96>
WT1 (exosomal) (densitometry) 28 12 Detected in 60.7%, Detected in 66.7%, n.s. Lee, 2012 N
2.48±1.62 1.80±0.65
MLM-10 14 17 0.92 0.6 Bennett, 2017 Y
7.5±0.8 12.3±1.2 <0.83–1.00>
MLM-5b 14 17 0.82 0.6 Bennett, 2017 Y
7.5±0.8 12.3±1.2 <0.66–0.99>

at disease onset.

Abbreviations: SSNS, steroid-sensitive nephrotic syndrome; SRNS, steroid-resistant nephrotic syndrome; For values, [ ] for range, [[ ]] for interquartile range, < > for 95% confidence interval; A1BG, alpha-1 beta glycoprotein; n.p not provided; n.s,. not significant; A2M, α2 macroglobulin; Cr, creatinine; AAT, alpha 1-antitrypsin; AGP1, α1 acid glycoprotein 1; AGP2, α1 acid glycoprotein 2; ORM2, orosomucoid 2; APO A1, apolipoprotein A1; β2M, β2-microglobulin; GAG, glycosaminoglycans; LRG1, leucine-rich α2-glycoprotein 1; NAG, N-acetyl-beta-D-glucosaminidase; PBSA, protein bound sialic acid; RBP, retinol-binding protein; VDBP, vitamin D-binding protein; MLM-5b & MLM-10a, panels of biomarkers46).

Table 2.
Serum or plasma markers
Marker Sample, S or P (Unit) No. of SSNS (M:F), age No. of SRNS (M:F), age Value in SSNS Value in SRNS P value AUC Cutoff Published year (reference) Significant
ET1 S (pg/dL) 30 25 18.3±17 52.5±45.8 <0.001 0.88 24.6 Ahmed, 2019 Y
haptoglobin S (mg/mL) 58 26 30 [26–34] 49 [40-54] <0.05 0.904 37.935 Yang, 2015 Y
HDAC2 protein WB 25 (13:12) 23 (15:8) 0.60±0.11 0.45±0.13 <0.01 Guan, 2018 Y
6.7 [3–13] 6 [3-13]
HDAC2 activity S (nmol/L) 32.30±1.42 28.25±1.20 <0.01 Y
IL-8 S (nmol/L) 102.40±3. 84 125.48±2.78 <0.01 Y
IgA S (g/L) 65 22 1.19±0.78 1.10±0.71 n.s. n/a n/a Ling, 2019 N
IgE S (g/L) 65 22 216.2 [[59.2, 537.8]] 90.6 [[42.4, 284.0]] <0.001 n/a n/a Ling, 2019 Y
IgG S (g/L) 24 19 4.7±2.91 2.67±1.65 <0.001 n/a n/a Roy, 2009 Y
IgG S (g/L) 22 19 4.39 [2.96–9.34] 1.03 [0.9–1.67] <0.001 0.923 2.040 Le Viet, 2019 Y
IgG S (g/L) 65 22 3.07±2.9 3.98±2.11 <0.005 n/a n/a Ling, 2019 Y
IgM S (g/L) 24 19 2.6±1.35 3.17±1.54 n.s. n/a n/a Roy, 2009 N
IgM S (g/L) 65 22 1.57±0.92 1.59±0.94 n.s. n/a n/a Ling, 2019 N
IgG/IgM ratio Ratio 24 19 2.7±2.97 1.27±1.25 n.s. n/a n/a Roy, 2009 N
IgG/IgM ratio Ratio 22 19 2.72 [1.83–6] 0.57 [0.46–1.07] <0.001 0.892 1.640 Le Viet, 2019 Y
sIL2R S 23 17 878.9±335.18 1295.7±240.83 <0.001 Youssef, 2011 Y
MDA S(nM/mL) 26 (19:7) 7 (3:4) 6.0±0.81 13.4 [8.72–23.0] 17.5 [14.3–29] 0.003 Bakr, 2009 Y
MIF P(pg/mL) 14 7 414.1 759.7 0.022 0.76 501 Cuzzoni, 2019 Y
NGAL S(ng/mL) 29 14 80.1 [43.8-163] 103 [50.2-351] 0.34 Ochocinska, 2018 N
NPNT S (mg/mL) 40 40 4.64±3.05 0.69±0.44 <0.001 0.896 1.215 Watany, 2018 Y
suPAR S (pg/mL) 108 68 2,153.5±1,167.0 3,744.1±2,226.0 <0.05 0.80 2,578 Peng, 2015 Y
suPAR S (ng/mL) 25 25 26.22±3.86 66.52±9.7 <0.05 1.00 33.17 Mousa, 2018 Y
TAC S (mM/L) 26 (19:7) 7 (3:4) 6.0±0.81 0.85 [0.68–0.91] 0.66 [0.59–0.81] 0.001 0.73 Bakr, 2009 Y
sTNFR1 P (ng/mL) 19 11 3.86±2.16 5.64±3.21 0.21 n/a n/a Tain, 2002 N
sTNFR2 P (ng/mL) 19 11 5.67±1.99 7.18±3.13 0.17 n/a n/a Tain, 2002 N

at disease onset.

Abbreviations” n.s., not significant; n/a, not available; ET1, Endothelin-1; HDAC2, histone deacetylase-2; WB, western blot; Ig, immunoglobulin; sIL2R, soluble interleukin-2 receptor; MDA, malondialdehyde; MIF, macrophage migration inhibitory factor; NGAL, neutrophil gelatinase-associated lipocalin; NPNT, nephronectin; suPAR, soluble urokinase Plasminogen Activator Receptor; total antioxidant capacity (TAC), sTNFR, soluble TNF receptors

Table 3.
Cellular phenotypes
Marker Method (unit) No. of SSNS No. of SRNS Value in SSNS Value in SRNS P value Author, year significant
CD45RA+CD4+ suppressor-inducer 35±9 24±8 <0.05 Y
CD45RO+CD4+ Memory cells % in the peripheral blood 25 10 7±4 33±10 <0.001 Stachoswki, 2000 Y
CD45RO+CD8+ suppressor-effector 26±10 38±12 <0.05 Y
T cell 70.9±8.9 71.6±7.2 n.s. N
CD4+T cell % of lymphocytes 40.5±8.2 36.9±8.4 n.s. N
CD8+T cell 24.3±6.0 29.9±7.6 <0.005 Y
CD4/CD8 Ratio 1.8±0.6 1.3±0.5 <0.005 Y
Natural killer 65 (44:21) 22 (16:6) 5.7±3.0 8.0±4.1 <0.001 Y
B cell 5.2±2.9 5.5±4.3 (onset age) 22.1± 6.7 12.7± 6.1 <0.001 Ling, 2019 Y
Transitional B cells (onset age) 5.3±3.8 2.0±1.5 <0.001 Y
Mature B % of lymphocytes 22.8±9.6 22.4±8.9 n.s. N
Memory B 4.5±2.4 3.5±2.0 n.s. N
IgM memory B 1.5±0.8 1.0±0.8 n.s. N
Switched memory B 1.3±0.8 1.0±0.4 n.s. N
cTNFR1 Expression, % 19 11 43.25±5.77 81.07±5.40 <0.001 Tain, 2002 Y
cTNFR2 Expression, % 19 11 74.14±7.90 95.21±2.74 0.023 Tain, 2002 Y

at disease onset.

Abbreviations: SSNS, steroid-sensitive nephrotic syndrome; SRNS, steroid-resistant nephrotic syndrome; n.s. not significant; cTNFR1, cell surface TNF receptors 1; cTNFR2, cell surface TNF receptors 2.

Table 4.
mRNA expression
Marker Method (unit) No. of SSNS No. of SRNS Value in SSNS Value in SRNS P value Author, year Significant
CD80 /β-actin 13 25 1.259 0.467 0.021 Mishra, 2017 Y
[[0.459, 2.028]] [[0.292, 0.654]]
HDAC2 mRNA /β-actin 25 (13:12) 23 (15:8) 0.72±0.10 0.60±0.13 <0.01 Guan, 2018 Y
6.7 [3–13] 6 [3–13]
CD3+:GCR Median % 15 14 70.3±7.71 44.59±8.46 <0.001 Zahran, 2014 Y
CD3+:GCR Median % 30 (19:11) 21 (14:7) 56.3 17.6 <0.0001 Hammad, 2013 Y
5.3 [4–8] 6.5 [4–7.6] [[51.6–67.9]] [[13.5–18.4]]
CD14+:GCR Median % 30 (19:11) 21 (14:7) 41.5 17.3 <0.0001 Hammad, 2013 Y
5.3 [4–8] 6.5 [4–7.6] [[38.9–46.2]] [[11.6–19.4]]
MDR1 Median % 23 17 6.5±2.1 9.2±1.1 <0.001 Youssef, 2011 Y
SOC3 promoter Methylation status 36 (16:20) 40 (23:17) Unmethylation 16.7% (n=6) Unmethylation 82.5% (n=33) <0.0001 Zaorska, 2016 Y
SOC3 % 34 (18:16) 20 (11:9) n:a (Data not given) Increased by 22.5 0.0005 Ostalska-Nowicka, 2011 Y
10.5 [4-16] 11.3 [4-17]
SOC5 % 34 (18:16) 20 (11:9) n:a (Data not given) Increased by 13.6 0.0005 Ostalska-Nowicka, 2011 Y
10.5 [4-16] 11.3 [4-17]
TLR-3 /β-actin 13 25 1.128 0.324 0.015 Mishra, 2017 Y
[[0.337, 1.685]] [[0.274, 0.652]]
TLR-4 /β-actin 13 25 0.805 0.226 0.015 Mishra, 2017 Y
[[0.300, 1.537]] [[0.193, 0.563]]

Abbreviations: HDAC2, Histone deacetylase-2; TLR, Toll-like receptor; CD80, cluster of differentiation 80; SSNS, steroid-sensitive nephrotic syndrome; SRNS' steroid-resistant nephrotic syndrome, IQR, interquartile range; SOC3, suppressor of cytokine signaling 3 gene; GCR, glucocorticoid receptor; MDR1, multidrug resistant gene-1; sIL2R, serum soluble interleukin-2 receptor.

Table 5.
Other genetic polymorphisms
Marker Polymorphism No. of SSNS (M:F) No. of SRNS (M:F) Value in SSNS Value in SRNS OR <95% CI> P value Author, year Country Significant
AT1R A1166C 102 56 n.s. Tabel, 2005 Turkey N
AGT T704C (Met235Thr) 102 56 More TT 4,837 <1,723–13,577> 0.01 Tabel, 2005 Turkey Y
APOE ε 87 20 ε2 allele, ε2/3 <0.05 Atttila, 2002 Turkey Y
ENDRA rs5333 (T/C) 61 39 More C allele 1.94 <1.02–3.69> 0.04 Ezzat, 2019 Egypt Y
GLCCI1 rs37972 and rs37973 117 94 n.s. Cheong, 2012 Korea and USA N
IL4 C590T 115 35 More CC More TT 6.46 0.02 Jafar, 2011 India Y
NR3C1 83 35 n.s. Ye, 2006 China N
SXR (NR1I2) rs3842689 (In/Del) 47 (28:19) 9 (6:3) Del/Del 20.57 <2.10–200.81> 0.009 Turolo, 2016 Italy Y
TRPC6 rs3824934 (-254C>G) 23 (19:4) 28 (19:9) More G 2.29 <1.01–5.18> 0.046 Kuang, 2013 China Y
Uteroglobin G38A 84 (46:38) 52 (22:30) More GG More AA n.s. Demircioglu, 2018 Turkey N
VDR c.1025-49G>T, c.1056T>C 62 (39:23) 16 (13:3) n.s. Al-Eisa, 2016 Kuwait N
Table 6.
HLA allele frequencies
Marker Method (unit) No. of SSNS No. of SRNS Value in SSNS Value in SRNS P value Author, year Significant
HLA DR-β1*150X-DQ-β1*060X Allele frequency % 83 17 14.15 38.24 0.001 Gulati, 2007 Y
HLA-DRB1*07 Allele frequency% (n) 35.52 (54) 27.57 (59) 0.029 Ramanathan, 2016 Y
HLA-DRB1*10 09.86 (15) 4.20 (09) 0.025 Y
HLA-DQB1*02 76 (45:31) 107 (62:45) 30.92 (47) 23.83 (51) 0.058 N
HLA-DQB1*05 4.4±0.3 4.14±0.2 21.05 (32) 29.90 (64) 0.018 Y
HLA-DQB1*06 17.10 (26) 24.76 (53) 0.039 Y
HLA-DQB1*0301, 0304 (DQ7) 24.34 (37) 14.48 (31) 0.007 Y
TOOLS
Similar articles