

 PDF
PDF Citation
 Print
Print


INTRODUCTION
Elevated blood pressure (BP) is a major modifiable risk factor for cardiovascular disease, which is the main contributor to morbidity and mortality globally.1)2) The World Health Organization launched the Global Noncommunicable Diseases Action Plan, which includes a 25% relative reduction in the prevalence of raised BP or contain the prevalence of raised BP, according to national circumstances.3) Among both diagnosed and undiagnosed individuals with hypertension, BP management is essential because high-normal BP can also increase the risk of cardiovascular disease.4) Behavioral risk factors, including tobacco use, physical activity, and diet, play a considerable role in BP control.5)6) Numerous studies have been conducted on the effect of diet on BP, and a positive association between sodium, sugar, and BP has been well established.7)
Ultra-processed food (UPF) is salty and sweet, industrially produced, and primarily consists of compounds derived from food with little, if any, whole food.8) UPF is energy-dense; low in fiber, micronutrients, and other bioactive compounds; and often high in saturated or trans fat.9) Given these nutritional properties, high UPF consumption is linked to unhealthy dietary food profiles and diet-related noncommunicable diseases.9) The worldwide increase in UPF consumption and the prospect of continued industry growth has sparked interest in the health impacts of UPF.10)11)12) As a result, there is growing evidence suggesting a positive association between the consumption of UPF and a higher prevalence of cardiovascular disease, metabolic syndrome, obesity, and cancer.8)13)14)15)
However, studies on the association between UPF and elevated BP are lacking. Considering that most studies have targeted Western populations,16)17)18)19) data on UPF intake and BP in Asian populations are insufficient. Moreover, most research has focused on participants who were diagnosed with hypertension by a health professional or on those who took antihypertensive medication.16)17)19) Therefore, information on individuals with elevated BP but have not yet been diagnosed with hypertension is limited. The current study aimed to examine whether UPF consumption is associated with elevated BP among Korean adults without a history of hypertension. We hypothesized that participants with high UPF consumption have elevated BP compared to individuals with low UPF consumption.
METHODS
Ethical statement
The survey protocols were approved by the Institutional Review Board (No. 2018-01-03-P-A) of the Korea Centers for Disease Control and Prevention and informed consent was obtained from each participant before enrollment in the survey.
Data source and study population
This study used data from the Korea National Health and Nutrition Examination Survey (KNHANES VII) 2016–2018, which is a nationally representative cross-sectional survey on individuals aged ≥1 year via health examinations, health interviews and nutrition surveys.20) Using these 3 component surveys, KNHANES collects information on participants' demographic, socioeconomic, health, and nutritional status.20) In the food intake survey based on the 24-hour recall method of KNHANES, detailed information on the food consumed by the participants during the last 24 hours, the time and place where the food was consumed, and the amount of intake was collected.21) The type of food consumed by the participants (e.g., boiled egg or fried egg) was investigated as is.21) The recipe information of each mixed dish or multi-ingredient food was collected to estimate food or nutrient intake.21) Among the 24,269 participants in KNHANES VII, those who did not undergo the 24-hour recall method (n=2,998), were aged <30 or ≥80 years (n=7,223), and were pregnant or breastfeeding (n=162) were excluded. Among the remaining 13,886 adults, we additionally excluded individuals with missing data on a key variable (n=1,426) and those who reported they had a physician-diagnosed hypertension (n=3,272). Finally, 9,188 participants were included in the study.
Consumption of ultra-processed food
The raw data of the 24-hour recall method provided the names of the food that the participants reported in the survey and showed detailed food information that was disassembled for each food item.21) In the current study, we used information on 3,984 food items and classified them into 4 groups according to the NOVA (not an acronym) system: 1) unprocessed or minimally processed food, 2) processed culinary ingredients, 3) processed food, and 4) UPF.22) This NOVA system classifies food on the basis of the extent, nature, and aim of food processing.9) Unprocessed or minimally processed foods are foods that are derived from direct nature or altered by minimal processes including drying, grinding, boiling, freezing, and pasteurization (e.g., raw corn or steamed corn).9) Processed culinary ingredients are ingredients derived by purified (e.g., salt) from nature or extracted from foods (e.g., corn oil).23) Processed foods are foods made by adding processed culinary ingredients to unprocessed or minimally processed foods, and their storability has been improved by using processes such as bottling, canning, and fermentation (e.g., canned corn).23) UPF is not a type of transformed food but a formulation that consists of additives and substances derived mostly or entirely from food.9) UPF includes soft drinks, distilled alcoholic beverages, instant sauces and spreads, sweet or salty snacks, cookies, and diverse types of ready-to heat or ready-to-eat food (e.g., popcorn, instant noodles, soups, rice, or pizza). More details are described elsewhere.22) UPF consumption was estimated as the dietary energy contribution from UPF.
Elevated BP
All health examination procedures of KNHANES were performed by well-trained medical staff using standardized protocols.20) BP was measured in a managed environment with a noise level ≤ 65 dB and temperature ≤ 20°C–25°C. After resting for more than 5 minutes in a sitting position, BP was measured in the right upper arm 3 times at 5 minutes intervals by using a mercury sphygmomanometer (Baumanometer® Wall Unit 33 [0850]; Baum, Copiague, NY, USA). The mean of the second and third measurements was taken as the final systolic and diastolic BP. Elevated BP was defined as systolic BP ≥ 120 mmHg or diastolic BP ≥ 80 mmHg.
Covariates
We adjusted for potential confounders for sociodemographic, anthropometric and nutritional information. Sociodemographic information included sex, age, income (low or high-middle), education level (≤6 years, 7–12 years, and >12 years), occupation (white, pink, blue, and others), region (rural or urban), smoking status (current, ex-smoker, nonsmoker), exercise (yes, no), and history of disease (dyslipidemia, stroke, myocardial infarction, angina pectoris, diabetes, and kidney failure). Physical activity was examined using the International Physical Activity Questionnaire.24) Exercise was defined as moderate-intensity activity ≥150 min/week, vigorous activity ≥75 min/week, or a combination of the 2. For anthropometric data, body weight was measured using a digital scale (GL-6000-20; G-tech, Uijeongbu, Korea) to the nearest 0.1 kg, and standing height was measured using a stadiometer (SECA 225; SECA, Hamburg, Germany) to the nearest 0.1 cm. Body mass index (BMI) was calculated as body weight divided by height squared (kg/m2) and was included in the model as a continuous variable. For nutritional information, the total energy intake (kcal) and the Korean Health Eating Index (KHEI) score were used as covariates. The KHEI was designed to assess individual's overall diet quality on the basis of the 2010 Korean Dietary Guidelines25) and was measured using dietary information from the 24-hour recall method and dietary behavior questionnaire. The KHEI consisted of a total of 14 components, which are 8 that should be consumed frequently (breakfast, fruits, vegetables, meat/fish/eggs and beans, grains, and milk and dairy products) and 6 that should be balanced consumed (carbohydrates, fat, sodium, saturated fatty acids, sweets and beverages, and energy). The total KHEI score ranges from 0 to 100, with a higher score indicating a better diet quality.23)
Statistical analyses
General characteristic data are presented as mean±standard deviation or number (%). The differences in variables according to the tertiles of the dietary energy contribution of UPF were examined using analysis of variance and the χ2 test for continuous variables and categorical variables, respectively. Sex-specific tertiles were used for sex-stratified analyses. Independent associations between UPF consumption and elevated BP were assessed by logistic regression analyses between sexes. Tests for linear trends in the dietary energy contribution of UPF consumption were performed. Linear association between UPF consumption and BP as a continuous variable was determined via multiple linear regression analyses. Subgroup analyses according to age, smoking status (except for women), menopause status, BMI, and KHEI were conducted, and 2-sided p<0.05 was considered statistically significant. All statistical tests were performed using SAS 9.4 (SAS Institute Inc., Cary, NC, USA).
RESULTS
A total of 9,188 adults (40.2% male and 59.8% female) were included in this study (Table 1). The mean dietary energy contributions of UPF in the participants were 6.9%, 20.3%, and 43.6% in T1 (<13.16%), T2 (≥13.16%, <28.55%), and T3 (≥28.55%), respectively. Those in the highest tertile of UPF consumption were more likely to be male, younger, urban residents, and current smokers and have higher BMI and energy intake. They were also less likely to have a history of disease and had a lower KHEI score than adults in the middle and lowest tertiles of UPF consumption. No differences were observed in income and physical activity according to UPF intake.
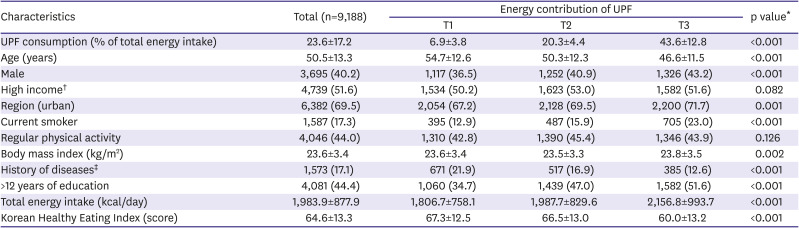
Table 1
Baseline characteristics of the study participants according to dietary energy contribution of ultra-processed food
Values are presented as mean±standard deviation or number (%).
*Analysis of variance or χ2 test where appropriate; †More than the median of income of total participants; ‡Having any one of the following: dyslipidemia, stroke, myocardial infarction, angina pectoris, diabetes, and kidney failure.
![]()
Table 2 shows the associations between UPF energy contribution and potential confounders with elevated BP via logistic regression analyses. The prevalence of elevated BP in the total population were 47.1%, 43.9%, and 46.0% in T1, T2, and T3, respectively. T2 was not significantly associated with elevated BP (odds ratio [OR], 1.02; 95% confidence interval [CI], 0.92–1.14) in model 1, which includes age, sex, BMI, income, education level, occupation, region, smoking status, exercise, total energy intake, and history of disease. However, T3 was associated with a higher prevalence of elevated BP (OR, 1.25; 95% CI, 1.11–1.40) compared to the lowest tertile. This association was also shown in model 2, which adjusted for continuous KHEI score in addition to the covariates in model 1 (OR, 1.22; 95% CI, 1.09–1.37). A significant linear trend was observed in both models 1 and 2 (all p-values for trend: <0.001). The energy contribution of UPF (per 5%kcal increase) was also associated with elevated BP after adjusting for the same covariates of model 2 (OR, 1.02; 95% CI, 1.01–1.04; data not shown). In a model that analyzed bot the energy contribution of UPF and BP as continuous variables (Figure 1), both systolic BP and diastolic BP was slightly higher (β=0.005 and 0.007, respectively) whenever the dietary energy intake of UPF was 1% higher, but not significant (p value=0.577 and 0.245, respectively). Table 3 shows the associations between the energy contribution of UPF and elevated BP according to the subgroup. Increased ORs in T3 compared with T1 were observed for female (OR, 1.26; 95% CI, 1.08–1.46), but not for male (OR, 1.10; 95% CI, 0.92–1.32). The results of subgroup analysis according to age, smoking status, obesity, and overall dietary quality were consistent with our main findings, but there was a marginal level of associations in some subgroups, current smokers, and non-obese adults.
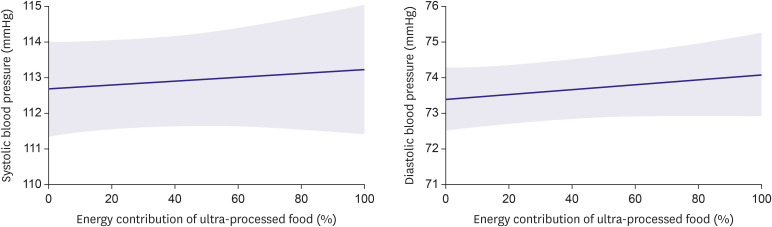
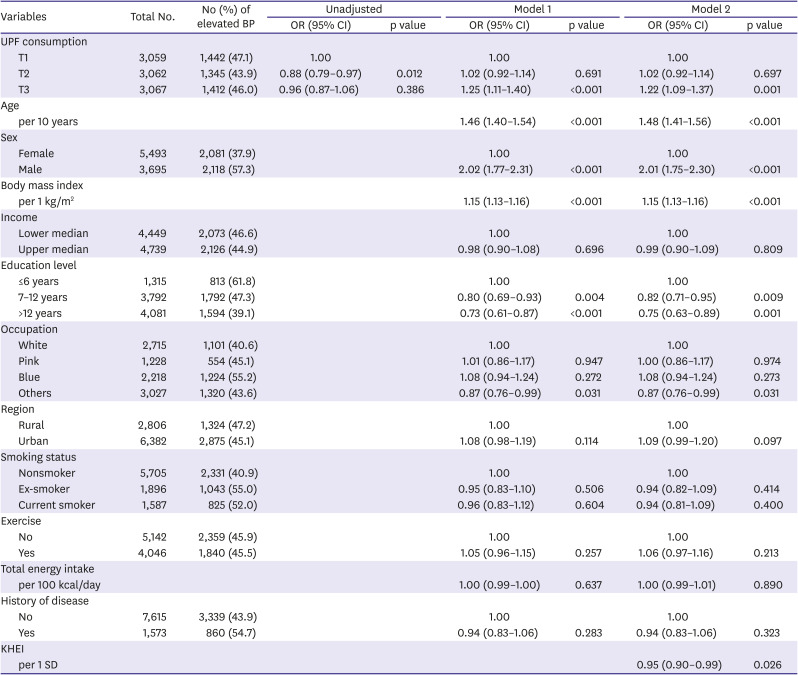
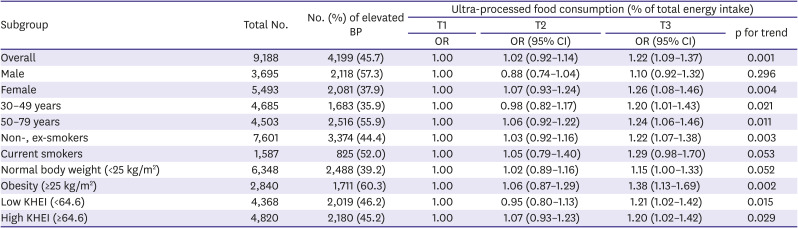
Figure 1
Multiple linear regression curves on the association between energy contribution of ultra-processed food and blood pressure.
Shaded areas represent 95% confidence intervals. Fully adjusted for age, body mass index, income (lower median/upper median), education level (≤6 years, 7–12 years, >12 years), occupation (white, pink, blue, and others), region (rural, urban), smoking status (never, ex-, current), exercise (yes, no), total energy intake, history of disease (at least one of dyslipidemia, stroke, myocardial infarction, angina pectoris, diabetes, and kidney failure), and Korean Health Eating Index.
![]()
Table 2
Association of energy contribution of ultra-processed food and potential confounders with elevated blood pressure
All variables whose values appear in each column were included in the statistical model for that column.
BP = blood pressure; CI = confidence interval; KHEI = Korean Health Eating Index; OR = odds ratio; SD = standard deviation.
![]()
Table 3
Associations between energy contribution of ultra-processed food and elevated blood pressure according to subgroup
The ORs (95% CI) of subgroup analyses according to sex, smoking status, and body mass index were adjusted for all other factors, not involving the subgroup.
The ORs (95% CI) of subgroup analyses according to age and KHEI score were adjusted for all other factors involving the subgroup.
Fully adjusted for age, sex, body mass index, income (lower median/upper median), education level (≤6 years, 7–12 years, >12 years), occupation (white, pink, blue, and others), region (rural, urban), smoking status (nonsmoker, ex-smoker, current smoker), exercise (yes, no), total energy intake, history of disease (at least one of dyslipidemia, stroke, myocardial infarction, angina pectoris, diabetes, and kidney failure), and KHEI.
BP = blood pressure; CI = confidence interval; KHEI = Korean Health Eating Index; OR = odds ratio.
![]()
Table 4 explains the results of the subgroup associations between the energy contribution of UPF and elevated BP by sex. For male participants, the percentages of elevated BP were 58.4%, 54.1%, and 59.4%, in T1 (<14.29%), T2 (≥14.29%, <29.75%), and T3 (≥29.75%), respectively. Increased ORs were found in the analyses according to age, but these were not significant in male participants. In particular, among the male current smoker and obesity group, higher ORs were shown for elevated BP (current smoker: OR, 1.38; 95% CI, 1.03–1.86; obesity: OR, 1.35; 95% CI, 1.00–1.82) compared to T1. The OR increased in a dose-response manner among current smokers (p for trend=0.030).
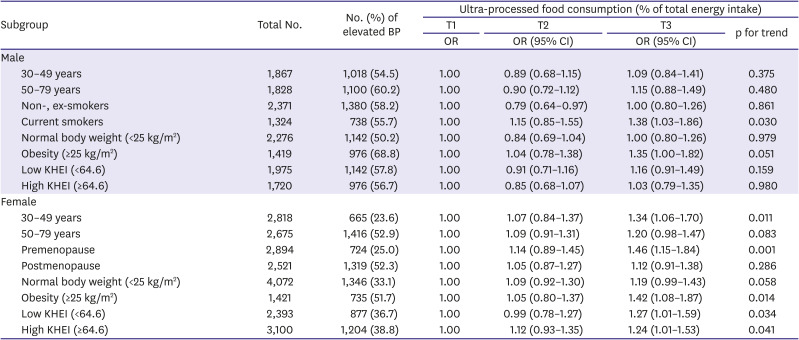
Table 4
Subgroup associations between energy contribution of ultra-processed food and elevated blood pressure by sex
ORs (95% CI) of subgroup analyses according to smoking status, body mass index, and menopausal status were adjusted for all other factors not involving the subgroup.
ORs (95% CI) of subgroup analyses according to age and KHEI score were adjusted for all other factors, involving the subgroup.
Fully adjusted for age, body mass index, income (lower median/upper median), education level (≤6 years, 7–12 years
BP = blood pressure; CI = confidence interval; KHEI = Korean Health Eating Index; OR = odds ratio.
![]()
For female participants, the percentages of elevated BP were 41.2%, 36.8%, and 35.7% in T1 (<12.46%), T2 (≥12.46%, <27.73%), and T3 (≥27.73%), respectively. Overall, the results of subgroup analyses in females showed an independent association between the energy contribution of UPF, elevated BP, and linear trends, but there was a marginal level of association in older and non-obese adults. The association between the energy contribution of UPF and elevated BP was more profound among the obesity group (OR, 1.42; 95% CI, 1.08–1.87) and premenopause group (OR, 1.46; 95% CI, 1.15–1.84) than in any other group.
DISCUSSION
This study found that a high dietary energy contribution from UPF consumption in Korean adults was independently associated with elevated BP. This association remained after adjusting for potential confounders, and this association was more profound among current smokers and obese adults.
Our results are consistent with those of previous studies. A cross-sectional study that analyzed 13,608 adults aged ≥19 years in Canada reported that participants in the highest tertile (≥58.7%) of UPF intake had 60% higher odds of hypertension than those in the lowest tertile (≤38.5%) after adjusting for socio-demographic covariates.17) This study measured hypertension on the basis of self-reported information and this data could not be examined against clinical records. A prospective cohort study on 14,790 middle-aged Spanish adults who were followed for a mean of 9.1 years found an increased hazard ratio of 1.21 (95% CI, 1.06–1.37) for the incidence of hypertension in the highest consumption group.16) Another prospective cohort study of 1,221 middle-aged Brazilian adult university graduates who were followed-up for 2 years reported that the highest percentage (≥34.6%) of energetic intake of UPF increased the risk of hypertension by 35%, whereas participants who consumed highly unprocessed or minimally processed food and culinary ingredients presented a decreased risk of hypertension.18) This positive association between UPF consumption and hypertension was also observed in another longitudinal study of 8,757 Brazilian adults aged 35–74 years.19) In this study, participants who consumed UPF had a 23% higher risk of hypertension.
The average dietary energy contribution of UPF in our study population was 23.6%, which was relatively lower than the 46.8–56.1% in Western populations.8)17) However, the high energy contribution of UPF was still associated with elevated BP in Korean adults without a history of hypertension. The association between UPF consumption and elevated BP was more profound among participants with less healthy lifestyles, such as current smokers and obese adults. People who consume a large amount of UPF tend to have other unhealthy lifestyles, such as tobacco use, low physical activity, and poor dietary patterns.16) Given that the consumption of UPF is also associated with overall diet quality,16) we adjusted for the KHEI score and stratified it according to the mean KHEI value unlike most similar studies, which did not consider diet quality. The results consistent with the main findings after additionally adjusted for KHEI were found, and the association was stronger in the low KHEI group than high KHEI group.
It is well known that reducing sodium intake, increasing potassium intake, and eating certain food groups such as vegetables and fruits, can reduce BP.26) Although there are many studies on the incidence of hypertension related to diet information, including nutrients, food type, and dietary patterns, relatively few studies have been conducted on hypertension according to UPF intake. The impact of UPF on BP can also be understood in terms of their detrimental nutrient profiles and dietary quality.16) In addition to these characteristics, food additives, neoformed contaminants, and chemicals from food packaging may also be linked to unhealthy outcomes.27) Food additives such as dietary emulsifiers cause a reduction in gut microbial diversity,28) which could contribute to the pathogenesis of hypertension.29)
To the best of our knowledge, this is the first study to analyze the association between UPF consumption and elevated BP in the Korean population. Moreover, we used national data from KNHANES, which is a nationally representative survey that includes various health- and nutrient-related variables that could influence the association between UPF intake and elevated BP.
This study has some limitations. First, given that our study was a cross-sectional study, we were unable to confirm the causality between UPF intake and elevated BP. It might be because those aware of their disease status were likely to have changed their habit (including diet) after diagnosis, and also their BP may be substantially influenced by medication rather than their diet. As expected, the association between UPF consumption and elevated BP were attenuated when analyzing all adults including those with a history of physician-diagnosed hypertension (Supplementary Table 1). Thus, we attempted to minimize reverse causation by excluding individuals with a history of hypertension, Second, the 24-hour recall method, which we used to measure UPF consumption, dose not assess the usual intake of participants; therefore, the participants may have consumed higher or lower amount of UPF, exceptionally. Third, there is a possibility that participants underreported unhealthy food intake owing to social desirability and social approval bias. Finally, although we included risk factors for elevated BP for adjustment, there might be possible covariates that were not included.
In conclusion, we found a significant positive association between UPF consumption and elevated BP among Korean adults without a history of physician-diagnosed hypertension. This independent association was more profound among current smokers and obese adults. These findings suggest that lowering UPF consumption might help prevent an increase BP. Further researches are needed to investigate a causal relationship between UPF consumption and elevated BP and to evaluate the possibility of low UPF consumption being used as a therapeutic strategy.
 XML Download