

 PDF
PDF Citation
 Print
Print


INTRODUCTION
The presence of myocardial ischemia is a key prognostic factor in patients with coronary artery disease,1) and coronary revascularization is indicated for ischemia-causing epicardial coronary artery stenosis.2)3) Fractional flow reserve (FFR) is a standard invasive physiologic index, and the benefit of FFR-guided percutaneous coronary intervention (PCI) has been demonstrated in previous studies.4)5)6)7) In addition to the role of FFR in identifying ischemia-causing stenosis and subsequent revascularization decisions, FFR represents the total disease burden in a target vessel and is associated with plaque vulnerability or adverse plaque characteristics.8)9) However, no thorough investigation has been performed to assess the clinical relevance of the pre-PCI physiologic disease burden in patients with planned coronary stent implantation.
Recently, several studies have evaluated the role of post-PCI FFR.10)11)12)13)14)15)16) Post-PCI FFR reflects the residual physiologic disease burden in both stented and non-stented segments, and a previous study reported an association between pre-PCI and post-PCI physiologic status.17) However, the prognostic value of post-PCI FFR in relation to pre-PCI FFR has not been fully investigated.
In this regard, we sought to assess the clinical relevance of pre-PCI FFR and the differential prognostic implications of post-PCI FFR according to the pre-PCI FFR in patients with coronary stent implantation.
METHODS
Ethical statement
The study protocol was approved by the ethics committee at Seoul National University Hospital (H-1906-152-1044) and followed the principles of the Declaration of Helsinki (2013). Written informed consent was obtained from all patients.
Study population
The study population was obtained from the International Post-PCI FFR registry (NCT04012281), incorporating 4 registries from Korea, China, and Japan.10) Briefly, this registry included patients who underwent PCI with second-generation drug-eluting stents (DESs) and measured post-PCI FFR. Among 2,200 patients, 1,479 patients with available pre-PCI FFR values were included in this study. Patients with pre-PCI FFR values >0.80 were excluded. As all analyses were based on per-patient analysis, a representative vessel was defined as the one with the lowest post-PCI FFR value in patients with multi-vessel interrogation. The patients were classified according to the median values of pre-PCI FFR (0.71) and post-PCI FFR (0.88).
Invasive procedures
Invasive coronary angiography was performed using standard techniques. Diagnostic angiograms were obtained after intracoronary nitrate administration. Quantitative coronary analysis was performed at each core laboratory of included registries using a validated software program (CAAS II; Pie Medical System, Maastricht, Netherlands and QAngio XA; Medis, Leiden, Netherlands). Coronary revascularization was performed using standard techniques with second-generation DES. During PCI, the type of DES, stenting techniques, and the use of additional imaging devices were left to the operator's discretion.
FFR was measured before and after PCI using standard techniques.18) After engagement of a 5- to 7- Fr guide catheter, a pressure-temperature sensor guide wire (Volcano, San Diego, CA, USA or St. Jude Medical, St. Paul, MN, USA) was placed at the distal segment of the target vessel after calibration and equalization to aortic pressure. Hyperemia was induced via continuous intravenous infusion of adenosine or adenosine triphosphate in most patients (91.8%). In others, intracoronary administration of papaverine, nicorandil, or adenosine was employed. Post-PCI FFR values used in this study were acquired at the end of the procedure. All FFR data were validated at each core laboratory of the included registries (COE-PERSPECTIVE registry at Inje University Ilsan Paik Hospital, 3V-FFR-FRIENDS registry at Seoul National University Hospital, DK CRUSH-VII registry at Powell Cardiac Institute, Seattle, WA, USA and institutional registry at Tsuchiura Kyodo General Hospital in Tsuchiura Kyodo General Hospital).
Definitions of clinical outcomes
The primary outcome was target vessel failure (TVF) at 2 years. TVF was defined as a composite of cardiac death, target vessel myocardial infarction (MI), and clinically driven target vessel revascularization (TVR). All deaths were considered cardiac in origin unless a non-cardiac cause was indicated. Clinically driven revascularization was defined as revascularization in the presence of diameter stenosis ≥50% with at least one of the following: 1) recurrence of anginal symptoms, 2) positive non-invasive test, 3) positive invasive physiologic test, or 4) presence of diameter stenosis ≥70%. The secondary outcomes were a composite of cardiac death or target vessel MI, individual outcomes of the primary outcome, clinically driven target lesion revascularization (TLR), and clinically driven TVR in the non-stented segment (non-TLR TVR). The target lesion included 5-mm margin proximal and distal to the stent and the stent itself. All clinical events were defined according to the Academic Research Consortium.19)
Statistical analysis
Continuous variables were presented as means and standard deviations. Categorical variables were described as numbers and relative frequencies. Student's t-test was used to compare continuous variables, while the chi-squared test was used to evaluate associations between categorical variables. The Spearman correlation coefficient was calculated to assess the linear association between pre- and post-PCI FFR. The cumulative incidence of clinical events was estimated using Kaplan-Meier analysis, and a log-rank test was used to evaluate group differences. The Cox regression model was used to calculate the hazard ratio (HR) and 95% confidence interval (CI). Independent predictors of TVF were assessed using the multivariate Cox regression model, and the covariables that were considered clinically reliable or were associated with clinical outcomes (univariate analysis, p value <0.1) were included in the model. Moreover, information gains of variables using the 5,000-permutation resampling method were calculated to compare the importance of the variables. The information gain was defined as the change in information entropy before and after the variable given.20) The higher the information gain, the more important the outcome prediction. All probability values were 2-sided, and p values <0.05 were considered statistically significant. The statistical package SPSS (version 23.0; SPSS Inc., Chicago, IL, USA) and statistical package R, version 3.6.2 (R Foundation for Statistical Computing, Vienna, Austria), were used for statistical analysis.
RESULTS
Patient and lesion characteristics
Table 1 shows the baseline patient and lesion characteristics. The mean age was 63.5±9.9 years, and 77.9% were men. The mean values of pre-and post-PCI FFR were 0.68±0.11 and 0.87±0.07, respectively (Supplementary Figure 1). The distributions of pre-and post-PCI FFR are shown in Supplementary Figure 2. A significant correlation was observed between the pre-and post-PCI FFR, but the correlation coefficient was low (rho=0.16, p value <0.001) (Supplementary Figure 3).
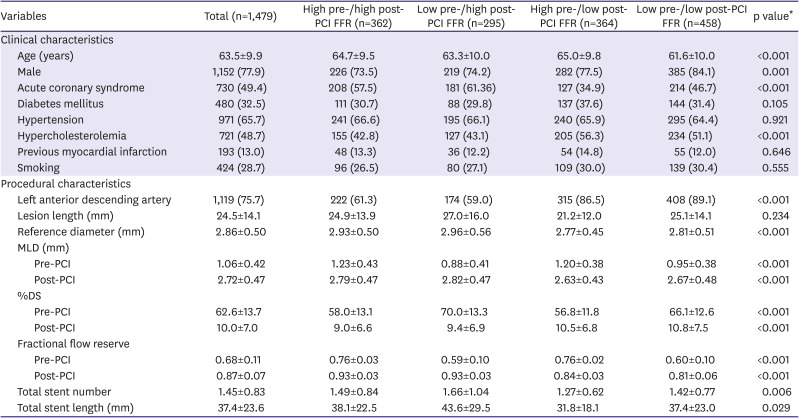
Table 1
Baseline characteristics
Values are mean±standard deviation or number (%). The patients were classified into 4 groups according to median pre-PCI (0.71) and post-PCI (0.88) FFR values.
FFR = fractional flow reserve; MLD = minimum lumen diameter; PCI = percutaneous coronary intervention; %DS = percent diameter stenosis.
*p value was for comparing 4 groups according to pre-and post-PCI FFR.
![]()
Clinical outcomes according to pre-percutaneous coronary intervention fractional flow reserve and post-percutaneous coronary intervention fractional flow reserve
The baseline patient and lesion characteristics according to pre-and post-PCI FFR values are presented in Supplementary Table 1. Compared with the high pre-PCI FFR (>0.71) group, the low pre-PCI FFR (≤0.71) group showed a higher risk of TVF at 2 years (7.8% vs. 4.2%; HR, 1.82; 95% CI, 1.15–2.87; p value=0.011) (Figure 1 and Supplementary Table 2). Similarly, the low post-PCI FFR (≤0.88) group showed a higher risk of TVF than that in the high post-PCI FFR (>0.88) group (7.8% vs. 3.9%; HR, 1.91; 95% CI, 1.19–3.09; p value=0.008) (Figure 1 and Supplementary Table 2). These results were consistent after adjusting for covariates (Supplementary Table 3). The risk of cardiac death or MI was also higher in the low post-PCI FFR (≤0.88) group than in the high post-PCI FFR (>0.88) group (Supplementary Table 2).
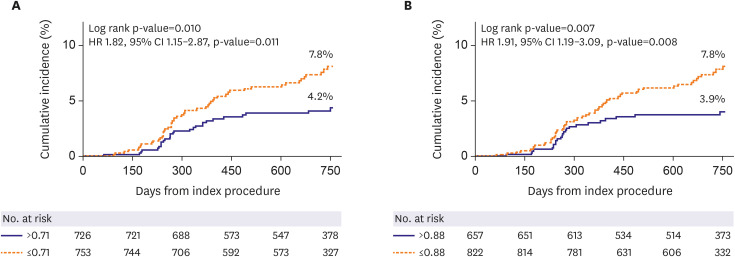
Figure 1
Cumulative incidence of target vessel failure. The Kaplan-Meier estimates of target vessel failure according to pre-PCI FFR (A) and post-PCI FFR (B) are shown. The patients were grouped according to median pre-PCI (0.71) and post-PCI (0.88) FFR values.
CI = confidence interval; FFR = fractional flow reserve; HR = hazard ratio; PCI = percutaneous coronary intervention.
![]()
Variable importance in risk prediction according to pre-percutaneous coronary intervention fractional flow reserve
As the effects of variables in predicting the risk for clinical events can differ according to the underlying physiologic disease burden assessed by pre-PCI FFR, the variable importance was calculated according to the pre-PCI FFR. In the low pre-PCI FFR (≤0.71) group, post-PCI FFR showed the highest information gain (0.0089; 95% CI, 0.0088–0.0091) in predicting TVF; however, this was not observed in patients with high pre-PCI FFR (>0.71) (Supplementary Figure 4 and Supplementary Table 4).
Four group comparison of clinical outcomes according to the pre- and post-percutaneous coronary intervention fractional flow reserve values
To investigate the differential prognostic values of combining the pre-and post-PCI FFR, patients were classified into 4 groups according to the median pre-PCI (0.71) and post-PCI (0.88) FFR values. The patient and lesion characteristics of the 4 groups are presented in Table 1. The cumulative incidence of TVF at 2 years was 3.8%, 4.1%, 4.8%, and 10.2% in the high pre-/high post-, low pre-/high post-, high pre-/low post-, and low pre-/low post-PCI FFR groups, respectively (Figure 2 and Table 2). The risk of TVF was the highest in the low pre-/low post-PCI FFR group than in any other group (all p values for comparisons<0.05) (Supplementary Table 5), and the low pre-/low post-PCI FFR was an independent predictor of TVF at 2 years (Table 3). The high pre-/low post-PCI FFR group presented a numerically high but statistically insignificant risk of TVF with the high post-PCI FFR groups (p values for comparison >0.05) (Figure 2, Table 2, and Supplementary Table 5). In the high pre-PCI FFR group (>0.71), patients with post-PCI FFR below 0.80, between 0.80 and 0.88, and over 0.88 showed comparable cumulative incidences of TVF (log-rank p value=0.600) (Supplementary Figure 5).
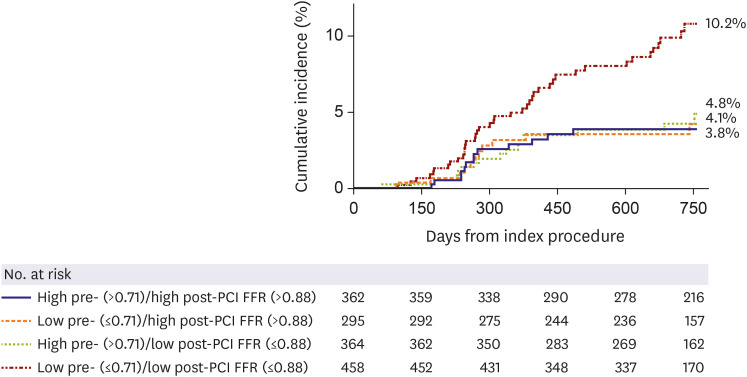
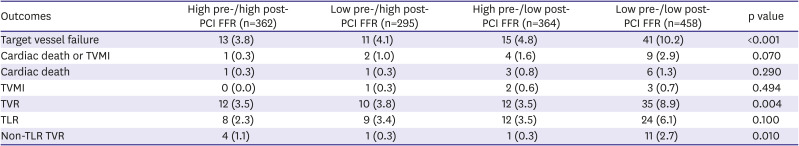
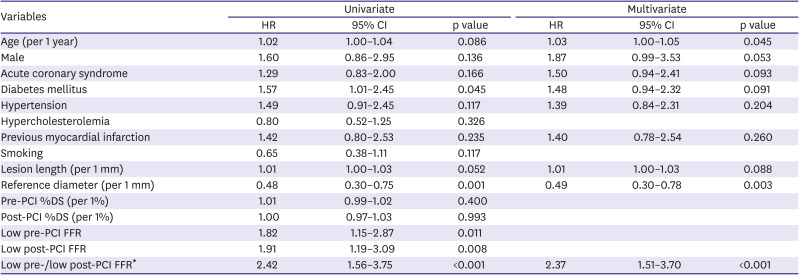
Figure 2
Cumulative incidence of target vessel failure in 4 groups according to pre-and post-PCI FFR. The patients were classified according to the median values of pre- (0.71) and post-PCI (0.88) FFR. Kaplan Meir estimates of these 4 groups are presented, and the low pre-/low post-PCI FFR group showed the highest cumulative incidence of target vessel failure at 2 years.
FFR = fractional flow reserve; PCI = percutaneous coronary intervention.
![]()
Table 2
Clinical outcomes in 4 groups according to pre-and post-PCI FFR
Values are number (cumulative incidence, %). The patients were classified into 4 groups according to median pre-PCI (0.71) and post-PCI (0.88) FFR values.
FFR = fractional flow reserve; PCI = percutaneous coronary intervention; TLR = target lesion revascularization; TVMI = target vessel myocardial infarction; TVR = target vessel revascularization.
![]()
Table 3
Independent predictors of target vessel failure
CI = confidence interval; FFR = fractional flow reserve; HR = hazard ratio; PCI = percutaneous coronary intervention; %DS = percent diameter stenosis.
*Low-pre/low-post PCI FFR is defined as a group of patients with pre-PCI FFR ≤0.71 and post-PCI FFR ≤0.88.
![]()
Association between post-percutaneous coronary intervention fractional flow reserve values and the risk for target vessel failure in the high and low pre-percutaneous coronary intervention fractional flow reserve groups
The mean post-PCI FFR value in patients with TVF was 0.85±0.07, which was lower than that in patients without events (0.87±0.07, p value<0.001). The prognostic effect of post-PCI FFR as a continuous variable was assessed according to the underlying physiologic disease burden assessed by pre-PCI FFR (Figure 3). In the high pre-PCI FFR (>0.71) group, the risk of TVF did not change with the increase in post-PCI FFR (HR, 0.97; 95% CI, 0.91–1.04; p value=0.375). However, in the low pre-PCI FFR (≤0.71) group, the risk of TVF significantly decreased with an increase in post-PCI FFR (HR, 0.95; 95% CI, 0.91–0.98; p value=0.003). The change in the risk of TVF in the low pre-PCI FFR group was mainly due to non-TLR TVR (Figure 3). In contrast, the risk of TLR was not affected by post-PCI FFR values, regardless of pre-PCI FFR (Figure 3).
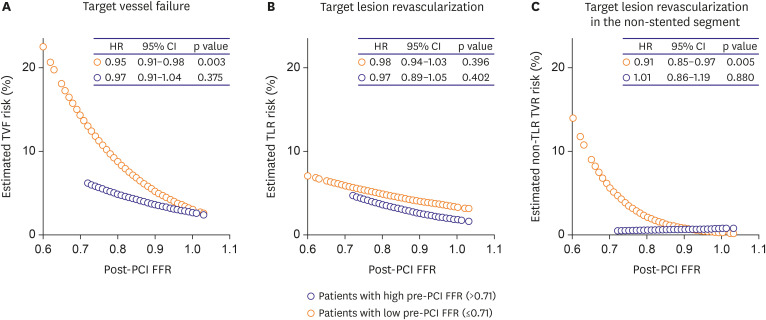
Figure 3
Association between the estimated risk of clinical events and post-PCI FFR according to pre-PCI FFR. The estimated risks of clinical events at 2 years were plotted according to the post-PCI FFR. The risk of target vessel failure (A) and target lesion revascularization in the non-stented segment (C) decreased along with the increase of post-PCI FFR in the low-pre PCI FFR (≤0.71) group but not in the high-pre PCI FFR (>0.71) group. The risk of target lesion revascularization (B) was not associated with post-PCI FFR regardless of pre-PCI FFR values.
CI = confidence interval; FFR = fractional flow reserve; HR = hazard ratio; PCI = percutaneous coronary intervention.
![]()
DISCUSSION
The current study investigated the clinical relevance of pre-PCI FFR and the differential prognostic impact of combining pre-PCI FFR and post-PCI FFR on clinical outcomes in patients with second-generation DES implantation. The main findings were as follows: First, pre-PCI FFR was associated with the risk of TVF after PCI. Second, the prognostic value of the post-PCI FFR varied according to pre-PCI FFR. Post-PCI FFR showed the highest variable importance in predicting TVF in the low pre-PCI FFR group but not in the high pre-PCI FFR group. Third, when classified according to pre-and post-PCI FFR, patients in the low pre-/low post-PCI FFR group showed the highest incidence of TVF, whereas those in the high pre-/low post-PCI FFR group presented a comparable risk of TVF with that in the high post-PCI FFR groups. Finally, a significant association was observed between post-PCI FFR values and the risk of TVF in the low pre-PCI FFR group but not in the high pre-PCI FFR group. Our study results suggest that individual patient's clinical outcome can be varied according to the level of physiologic indices, both before and after PCI, and the integration of both information can provide better risk stratification in patients with stent implantation.
FFR reflects the physiologic disease burden in the epicardial coronary artery, and its role in deciding the treatment strategy has been well established in previous studies.4)5)6)7) Based on robust evidence on FFR, current guidelines recommend FFR measurement in intermediate stenosis lesions when evidence of ischemia is not available.2)3) In addition to this role of FFR in defining ischemia-causing stenosis and revascularization decision, recent studies have reported the association of quantitative disease burden and qualitative plaque characteristics with FFR.8)9) Recently, Hamaya et al.21) raised the issue about the importance of pre-PCI FFR regarding future outcomes in association with post-PCI FFR. However, no thorough investigation has been performed regarding whether the prognostic value of pre-PCI FFR is maintained after PCI. In the current study, the risk of TVF was higher in the low pre-PCI FFR group than in the high pre-PCI FFR group, even after an angiographically successful PCI. The effects of variables in predicting TVF differed according to the pre-PCI FFR, and post-PCI FFR was the most important predictor in the low pre-PCI FFR group. These results suggest that the prognostic impact of pre-PCI FFR persists after PCI, and the clinical importance of post-PCI FFR can differ according to the baseline disease burden, as estimated by FFR.
Previous studies demonstrated that low post-PCI FFR represents suboptimal PCI results and residual disease burden in non-stented segments.22)23) The prognostic value of post-PCI FFR has been investigated in several studies demonstrating that post-PCI FFR value has an inverse relationship with the risk of subsequent major adverse cardiac events.10)11)12)13)14)15)16) Furthermore, a recent study demonstrated the incremental prognostic value of post-PCI FFR in addition to the clinical risk factors and anatomic factors based on the risk model construction using a machine learning algorithm.10) Even though there has been extensive evidence regarding post-PCI FFR, most of the studies focused only on post-PCI FFR. Considering that post-PCI physiology was strongly associated with the pre-PCI physiologic status,17) it may be important to consider the pre-PCI FFR when judging the clinical relevance of post-PCI FFR. Previously, Lee et al.24) introduced the concept of percent FFR increase and demonstrated that it could provide another aspect of disease entity and additive prognostic value, which cannot be explained by post-PCI FFR alone. However, none of the previous studies evaluated the clinical implications of post-PCI FFR concerning the underlying physiologic disease burden itself.
When the patients were classified according to pre-and post-PCI FFR in this study, the low pre-/low post-PCI FFR group showed the highest risk of TVF at 2 years. In contrast, the low pre-/high post- and high pre-/high post-PCI FFR groups demonstrated a lower risk of TVF regardless of pre-PCI FFR values. These results are consistent with the conventional concept of post-PCI FFR: the higher the post-PCI FFR, the better the prognosis. However, one interesting finding was that the high pre-/low post-PCI FFR group showed comparable clinical outcomes with the high post-PCI FFR groups despite having low post-PCI FFR values. These results are intuitively sensed when looking at a continuous relationship between post-PCI FFR and the estimated risk of clinical events. In the low pre-PCI FFR group, the risk of TVF decreased with an increase in post-PCI FFR. However, it was not affected by post-PCI FFR in the high pre-PCI FFR group. These results suggest that patients with low post-PCI FFR do not necessarily have a poor prognosis and that assessing the underlying disease burden is essential in judging the clinical significance of post-PCI FFR.
Another issue relates to the location of future events after PCI. A recent study reported that residual ischemia remained in 24% of patients after angiographically successful PCI, and 61.5% of those lesions were located in the non-stented segments.25) The current study demonstrated that more than one-quarter of TVRs occurred in the non-stented segments, as non-TLR TVR, and the association between TVF and post-PCI FFR was mainly driven by the association between non-TLR TVR and post-PCI FFR. Although about 3-quarters of TVRs occurred as TLR and the low pre-/low post-PCI FFR group showed the numerically higher incidence of TLR than other groups, the association between the risk of TLR and post-PCI FFR was not significant, regardless of the pre-PCI FFR values. Considering the association between FFR and quantitative plaque volume and qualitative adverse plaque characteristics,8)9) our study results suggest that clinical events after PCI in the low-post PCI FFR group are more likely to be associated with the segments not covered by the stent with the effects of TLRs.
The current study showed that the prognostic value of pre-PCI FFR, reflecting the underlying disease burden of the coronary artery, remained after coronary stent implantation and that integration of both pre-PCI FFR and post-PCI FFR can provide another aspect of disease entity that cannot be provided by post-PCI FFR alone. When the pre-PCI FFR value is high, there is a relatively low chance of decreasing the event risk by PCI. When the pre-PCI FFR value is low, the prognosis is determined by the level of ischemia relief or post-PCI FFR value. If the operators cannot achieve sufficient FFR gain with PCI, other treatment options, such as bypass surgery, should be considered. From this perspective, prediction of post-PCI physiologic status is important to determine an adequate treatment strategy and the benefits of PCI. Recently, advances in technology have enabled physiologic assessment using coronary CT angiography or quantitative flow ratio and virtual PCI to predict the post-PCI FFR value prior to the intervention.26)27)28)29) Moreover, the co-registration of angiography and physiologic assessment30) also provides a method of predicting residual ischemia before PCI.
This study has several limitations. First, the study results were obtained from an observational registry, and the inherent limitations of an observational registry study must be considered. Second, the patients were classified according to the median pre-and post-PCI FFR values. Therefore, these values may not be applicable to other cohorts. Third, there was no mandated treatment protocol for vessels with suboptimal post-PCI FFR values. However, as the final post-PCI FFR was measured at the time of angiographically successful PCI, the current study results can reflect the clinical relevance of pre-and post-PCI FFR in daily clinical practice. Fourth, pullback recording of post-PCI FFR or post-PCI intracoronary imaging was not mandatory in the current study. Therefore, the reasons for the low post-PCI FFR and the association between the residual plaque burden and the risk of non-TLR TVR could not be evaluated. Fifth, information on medications was not available in this study. Therefore, the impact of statins on outcomes could not be assessed.
In conclusion, pre-PCI FFR was associated with clinical outcomes after PCI, and the prognostic value of post-PCI FFR differed according to the pre-PCI FFR. Integration of both pre-and post-PCI physiologic information can provide better risk stratification in patients with stent implantation.
 XML Download