

 PDF
PDF Citation
 Print
Print


INTRODUCTION
Crohn's disease (CD) is an inflammatory bowel disease caused by intestinal inflammation. In patients with genetic susceptibility, environmental factors and abnormal intestinal microflora cause CD, and complex immune responses affect the progression of this disease. However, the exact pathophysiology remains unknown.1 Treatment of CD can be broadly divided into induction therapy to induce remission and maintenance therapy to maintain the induced remission state. Induction therapy for pediatric CD includes steroid therapy and exclusive enteral nutrition (EEN). EEN is defined as the exclusive use of a complete liquid diet instead of usual solids and fluids.2
According to the European Crohn's and Colitis Organization (ECCO)/European Society of Pediatric Gastroenterology, Hepatology and Nutrition (ESPGHAN) guidelines, EEN is the recommended first-line induction therapy for active luminal pediatric CD.3 It is usually recommended that EEN be administered for 6–8 weeks as first-line therapy, and if it fails to induce a clinical response within 2 weeks, the treatment is changed to other methods, such as steroid treatment. EEN is known to induce clinical and biochemical remission in approximately 85% of patients with CD.4 According to previous studies, clinical and biochemical responses appear within a few days after EEN administration, and it is assumed that biochemical changes in the intestine rather than simple improvements in nutritional status are the cause of the therapeutic effect.56
The exact mechanism of EEN therapy in CD is unknown, but an altered intestinal microflora after EEN is thought to affect mucosal healing in CD. According to a previous study using an IL-10−/−
Helicobacter colitis mouse model, the EEN group (liquid diet) gained more weight and presented with more improved histological findings in the gut than the normal chow (NC) group.7 In another study, to mimic the effect of EEN, a monotonous diet was administered to the DSS colitis model, and fecal microbiota diversity of the monotonous diet group was more abundant than that of the alternating diet group.8 However, changes in fecal microbiota at the species level were variable in different studies.9
In this study, we hypothesized that EEN administration would improve intestinal barrier function via the gut microbiome in experimental colitis. A murine model of dextran sulfate sodium (DSS)-induced colitis was established which was administered EEN therapy. In particular, the acute colitis murine model was used to understand the short-term changes occurring in the intestine after EEN administration to active luminal CD. Weight and disease activity were measured to prove the efficacy of EEN. By studying the changes in the microbiota and histological findings of the murine colon after EEN therapy, we attempted to determine the mechanism by which EEN exert its effects.
METHODS
Animals and materials
All procedures involving mice were performed in the Association for Assessment and Accreditation of Laboratory Animal Care International-accredited facility of the Yonsei Biomedical Research Institute. Eight-week-old C57BL/6 male mice used in this study were purchased from OrientBio (Seongnam, Korea) and housed under specific pathogen-free conditions for 2 weeks at the Avison Biomedical Research Center of Yonsei University College of Medicine. Elemental 028 Extra® (purchased from Nutricia, Liverpool, UK) powder (100 g) was prepared by adding water up to 500 mL, and this solution was used exclusively for elemental nutrition.
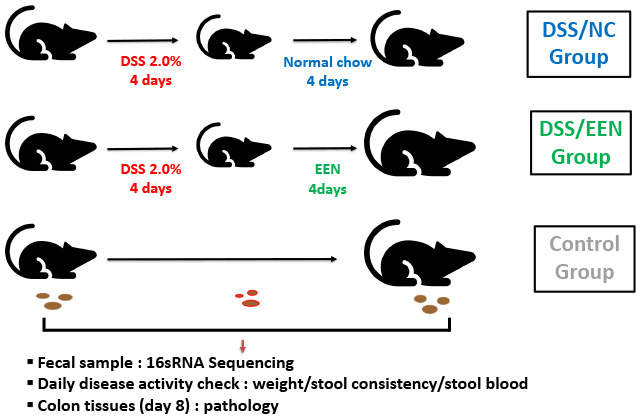
Colitis was induced in C57BL/6 mice for 4 days via the oral administration of 2% DSS (molecular weight 36–50 kDa), obtained from MP Biomedicals, LLC (Santa Ana, CA, USA) and either NC or EEN was administered for the following 4 days.1011 Nine mice were divided into two four- and five-mice groups according to the feeding pattern as follows: DSS/NC and DSS/EEN groups, respectively.
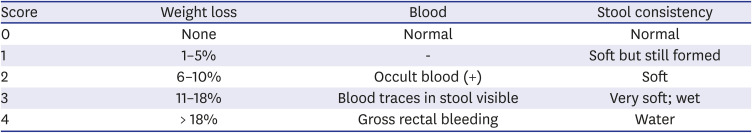
Disease activity index (DAI)
Histological examination
The mice were sacrificed via CO2 suffocation to perform colonic histopathology. The feces were removed and colons were washed with phosphate-buffered saline. Subsequently, the colonic mucosa was collected on a microscope slide. Colon tissues were fixed in 10% formalin, embedded in paraffin, and sectioned. Subsequently, the specimens were stained with hematoxylin and eosin. The mouse colitis histology index (MCHI) was measured following the method published by Koelink et al.13 A lower MCHI score indicated healthier histological results. The MCHI scoring system was as follows:
16s rRNA gene sequencing
Fecal samples were collected and 16s rRNA gene sequencing was used to analyze the microbial flora. Genomic DNA was extracted from the fecal samples using the Herculase II Fusion DNA Polymerase Nextera XT Index Kit V2 (Agilent, Santa Clara, CA, USA). Using the extracted DNA, the 16S rRNA gene was amplified and sequenced using next-generation sequencing with the Illumina platform (Illumina, San Diego, CA, USA).1415 We used a combination of analysis packages, including PANDAseq v2.8 and QIIME v2.0 for 16S rRNA gene pre-processing to obtain ampilcon sequence variant tables.1617 Taxonomic classification was performed using the GreenGenes V13.8 database.
Statistical analysis
Data were presented as the mean ± standard deviation and analyzed using GraphPad Prism 5 software (GraphPad Software, San Diego, CA, USA). The linear discriminant analysis (LDA) effect size (LEfSe) method was used to analyze metagenomic data collected from 16s rRNA gene sequencing.18 Multiclass comparison was performed using Kruskal-Wallis and Wilcoxon rank-sum tests with an LDA score cut-off of 3.0. Alpha diversity was statistically analyzed using one-way ANOVA, followed by Tukey’s multiple comparison test. β-diversity was analyzed statistically using analysis of similarity. Statistical significance was set at P ≤ 0.05.
RESULTS
Weight and disease activity is improved more in the DSS/EEN group than in the DSS/NC group
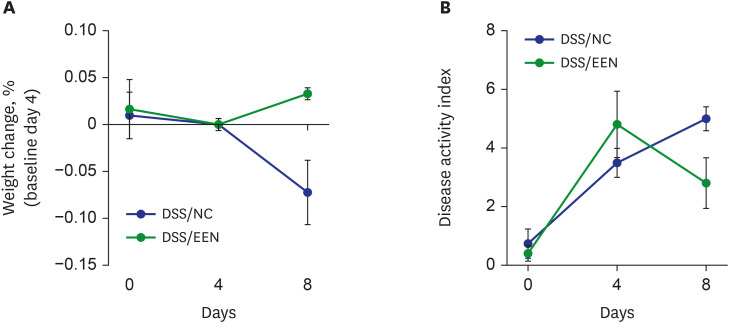
A decrease in weight was observed during DSS administration (Fig. 1). After 4 days, there was a significant improvement in body weight in the DSS/EEN group compared to that in the DSS/NC group. In both groups, it was confirmed that the DAI worsened during the 4 days of DSS administration. Subsequently, there was significant weight recovery (3.30% in the DSS/EEN group vs. −7.21% in the DSS/NC group, P < 0.05) and an improvement in the DAI in the DSS/EEN group compared to that in the DSS/NC group (2.8% for the DSS/EEN group vs. 5.0% for the DSS/NC group, P < 0.05).
Fig. 1
Changes of body weight and disease activity by days. (A) The change in weight is represented by the ratio. The change in body weight showed statistical difference between DSS/ NC group and DSS/EEN group on day 8 (3.30% in DSS/EEN group vs. −7.21% in DSS/NC group, P < 0.05). (B) Disease activity index is represented. Disease activity index is composed of weight change, hematochezia, and diarrhea. There was statistical difference between DSS/NC and DSS/EEN groups on day 8 (2.8% in DSS/EEN group vs. 5.0% in DSS/NC group, P < 0.05).
DSS = dextran sulfate sodium, NC = normal chow, EEN = exclusive enteral nutrition.
The microbiome diversity in EEN/DSS and EEN/NC groups was different
Comparison of α-diversity
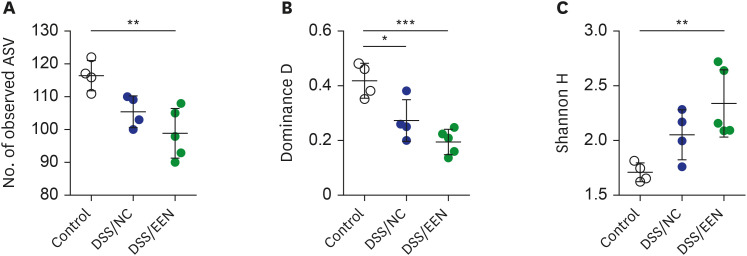
α-Diversity was analyzed in the gut microbiomes of the control, NC, and EEN groups (Fig. 2). The control group consisted of four fecal samples collected before DSS administration. Richness decreased significantly in the DSS/EEN group compared to that in the control group (P < 0.01). The dominance value of the microbiome was significantly lower in DSS/NC and DSS/EEN groups than that in the control group (P < 0.05, and P < 0.001, respectively). The dominance value of the DSS/EEN group was lower than that of the DSS/NC group, but the difference was not statistically significant. The Shannon diversity index (H) of the DSS/EEN group was significantly higher than that of the control group (P < 0.01).
Fig. 2
Alpha diversity by group. (A) The number of observed ASVs of control, DSS/NC, and DSS/EEN groups. The number of observed ASVs in the control group was significantly higher than that in DSS/NC and DSS/EEN groups (P < 0.01). (B) Dominance D values of control, DSS/NC, and DSS/EEN groups. Dominance D in the control group was significantly higher than that in DSS/NC and DSS/EEN groups (P < 0.001). (C) Shannon H value of control, DSS/NC, and DSS/EEN groups. Shannon H value of the DSS/EEN group was significantly higher than that in the control group (P < 0.05). Significance among the groups was statistically tested using one-way analysis of variance, followed by Tukey’s multiple comparison test. Data are expressed as the mean ± standard deviation of the mean.
ASV = ampilcon sequence variant, DSS = dextran sulfate sodium, NC = normal chow, EEN = exclusive enteral nutrition.
*P < 0.05; **P < 0.01; ***P < 0.001.
Relative abundance at the phylum level
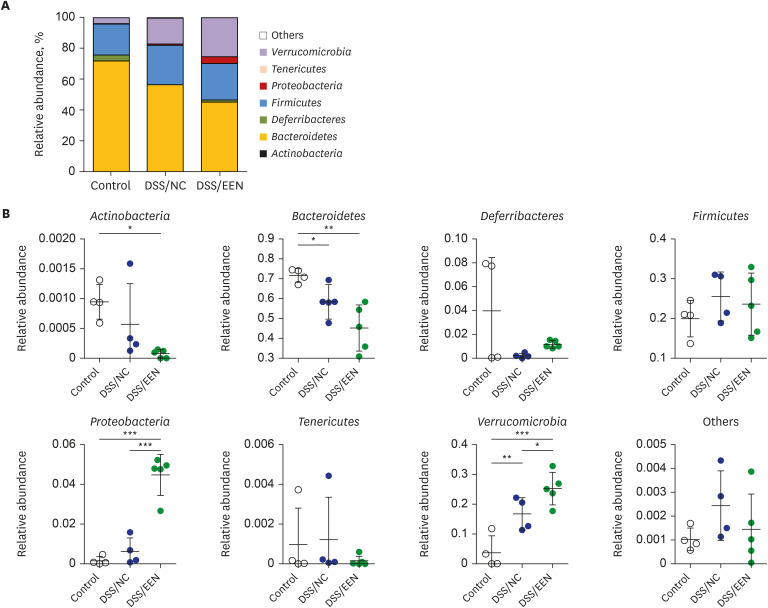
The relative abundance in each microbiome was compared at the phylum level (Fig. 3). In the DSS/EEN group, abundances of Verrucomicrobia and Proteobacteria were higher than those in the DSS/NC and control groups. Bacteroidetes abundance in the DSS/EEN group was lower than that of the control group.
Fig. 3
Relative abundance of microbiomes by groups. (A) Relative abundance of control, DSS/NC, and DSS/EEN group at the phylum level. (B) Relative abundance comparison in eight bacterial phyla: Actinobacteria, Bacteroidetes, Deferribacteres, Firmicutes, Proteobacteria, Tenericutes, Verrucomicrobia and their corresponding others. Statistical analysis was performed using one-way analysis of variance followed by Newman–Keuls multiple comparison test.
DSS = dextran sulfate sodium, NC = normal chow, EEN = exclusive enteral nutrition.
*P < 0.05; **P < 0.01; ***P < 0.001.
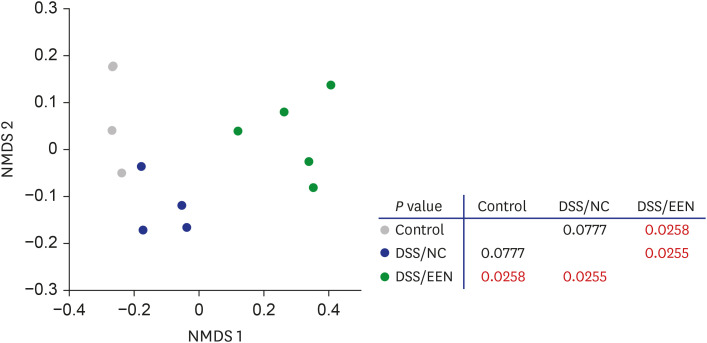
β-diversity
β-diversity was analyzed in the microbiome of the control, DSS/NC, and DSS/EEN groups (Fig. 4). In the DSS/EEN group, statistically significant changes in the β-diversity of fecal microbiota were observed. In contrast, the β-diversity of the DSS/NC group was not significantly different from that of the control group.
Relative abundance at the species level is different between the DSS/NC and DSS/EEN groups
The taxa representing microbial changes after treatment with NC and EEN are shown in Fig. 5 and Table 2. LEfSe was computed to validate the statistical significance of taxon abundance. Multiclass comparisons were performed using Kruskal-Wallis and Wilcoxon rank-sum tests with an LDA score cut-off of 3.0.
Fig. 5
LDA score of relative abundance at the species level. LEfSe and LDA score ≥ 3.5 are shown. (A) LDA scores showing significantly different abundance between DSS/NC and control groups. (B) Cladogram of LDA scores showing significantly different abundance between DSS/NC and control groups. (C) LDA scores showing significantly different abundance between DSS/EEN and control groups. (D) Cladogram of LDA scores showing significantly different abundances between DSS/EEN and control groups.
LDA = linear discriminant analysis, LEfSe = linear discriminant analysis effect size, DSS = dextran sulfate sodium, NC = normal chow, EEN = exclusive enteral nutrition.
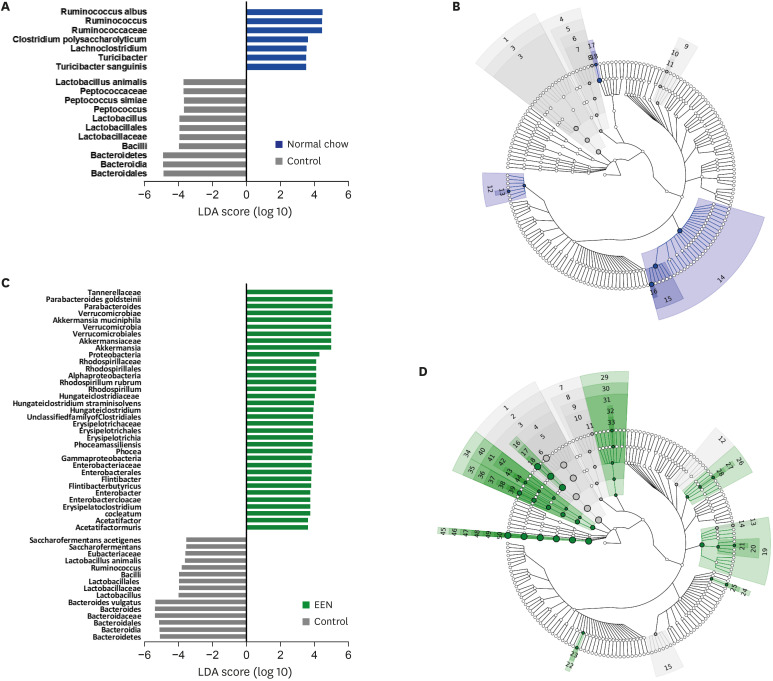
Table 2
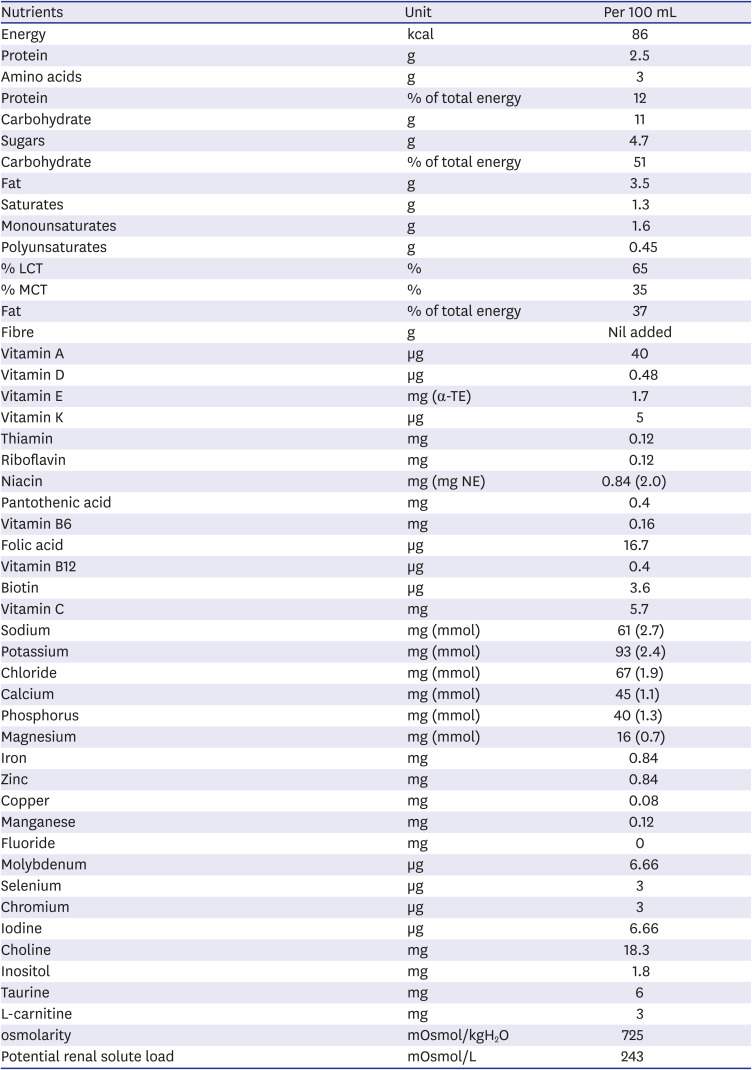
Composition of Elemental 028 Extra®
DSS/NC group vs. control group
The abundance in the gut microbiome of each group was analyzed at the species level. Compared to levels in the DSS/NC group, Lactobacillus animalis, Peptococcus simiae, and Bacteroidales were found to be more abundant in the control group. It could be interpreted that these species were significantly reduced upon DSS or NC administration for 4 days. Clostridium polysaccharolyticum, Turicibacter sanguinis, and Ruminococcus albus were found to be more abundant in the DSS/NC group than in the control group.
DSS/EEN group vs. control group
Compared with that in the DSS/EEN group, the abundance of Bacteroides vulgatus, Saccharofermentans acetigenes, L. animalis, Eubacteriaceae, and Ruminococcus was higher in the control group, which was reduced upon administering DSS/EEN for 4 days. Compared with that in the control group, Parabacteroides goldsteinii, Enterobacter cloacae, Rhodospirillum rubrum, Acetatifactor muris, Phocea massiliensis, Clostridium cocleatum, Akkermansia muciniphila, Flintibacter butyricus, and Hungateiclostridium straminisolvens abundance was increased in the DSS/EEN group.
Colon histology show that the DSS/EEN group exhibit increased pathological recovery and decreased goblet cell loss
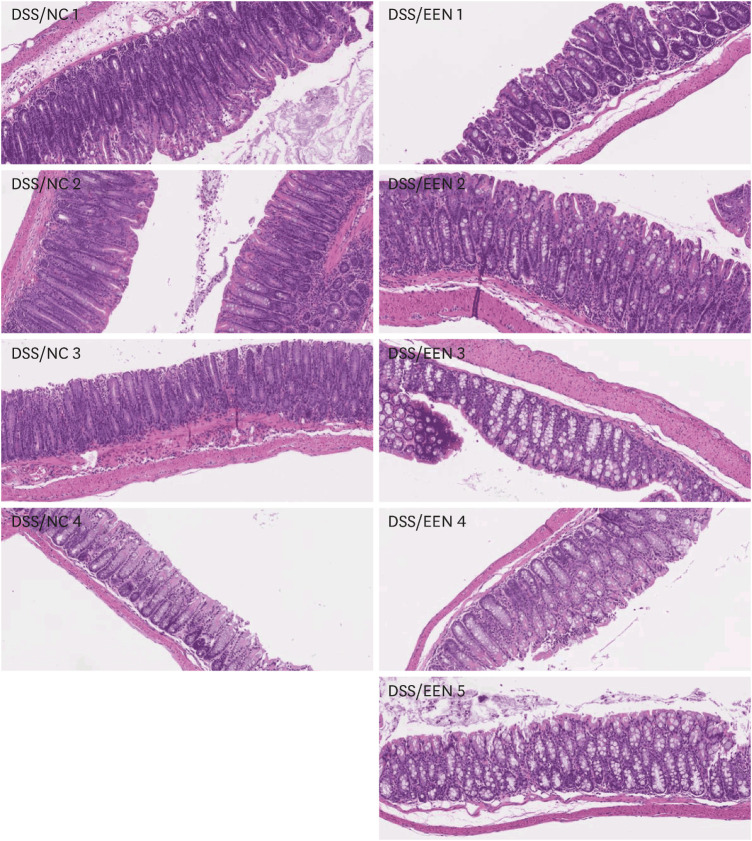
When the colon histology of the DSS/NC group and the DSS/EEN group was compared, the MCHI of the DSS/EEN group was significantly lower than that of the NC group (7.8% vs. 13.7%, presented in Fig. 6 and Table 3). In particular, goblet cell loss was significantly lower in the DSS/EEN group than in the DSS/NC group (2.75% vs. 0.2%, presented in Table 3).
Fig. 6
Colon histology of DSS/NC and DSS/EEN groups. Colon tissues were collected on day 8 and the specimens were stained with hematoxylin and eosin. These samples were analyzed using mouse colitis histology index.
DSS = dextran sulfate sodium, NC = normal chow, EEN = exclusive enteral nutrition.

DISCUSSION
In pediatric CD, EEN is an effective treatment, but it is a difficult process, and the exact mechanism underlying its effects is not clear. If we understand the underlying mechanism of EEN treatment, it will be possible to obtain more effective therapeutic options that are easy to tolerate and apply. In this study, we observed the effects of EEN in a murine colitis model, which showed clinical efficacy. After administering EEN, the richness of microbiota decreased, but the diversity of the microbiome increased. In addition, β-diversity was different in DSS/NC and DSS/EEN groups. Based on this evidence, it was found that EEN administration induced microbiome changes in a murine model.
There have been various reports of microbiome changes after EEN administration in human studies as well. However, the circumstances of the patients varied according to the study.19 In a study in 2005, it was confirmed that the band profiles of stool polymerase chain reaction patterns were reduced after EEN administration in pediatric CD.20 In addition, a study conducted in 2014 confirmed that richness decreased after EEN administration.21 In another study in 2015, abundance decreased with EEN administration, but no change in the Shannon index was observed.22 In contrast, in a case reported in 2013, it was confirmed that the Shannon index increased after EEN administration.23 Interestingly, in this study conducted under more controlled conditions compared to those of the human study, it was confirmed that the richness decreased after EEN administration, but the diversity (Shannon index) increased in this study as well. The pattern of decreasing microbiome richness but a similar or rather increasing Shannon index is the same as that in previous human studies and this study. Although the richness of bacterial species decreased while administering EEN, the Shannon index increased and the dominance value decreased, suggesting that dysbiosis was rather resolved. As confirmed in Table 2, it can be considered that EEN has more restrictive components than other diets, so it is more monotonous, and thus the richness of the species was reduced.24
After EEN administration, several changes in the microbiota were observed. In particular, changes in the relative abundance ratio of strains such as F. butyricus, A. muciniphila, and C. cocleatum, which are related to the production and degradation of mucin. In particular, A. muciniphila and C. cocleatum are known as mucin-degrading bacteria.2526
F. butyricus and P. goldsteinii make up the beneficial microbiota.2728 Goblet cells are known to generate mucin to form the first line of defense in the intestinal tract.29 In the present study, goblet cell loss was significantly lower in the DSS/EEN group than that in the DSS/NC group. F. butyricus is a butyrate producer,30 which upregulates mucin gene expression in intestinal goblet cells and eventually increases mucin secretion.28
A. muciniphila, as the name suggests, decomposes mucin and uses it as an energy source.25 In a previous human study, A. muciniphila abundance was increased after EEN treatment.31 Another study found that ingestion of A. muciniphila prevents the thinning of the mucus layer in mice with diet-induced obesity.32
A. muciniphila have been identified as a biomarker of the healthy intestine in previous studies on inflammatory bowel disease (IBD) and appendicitis.3334
C. cocleatum also has glucosidase activity, which can degrade mucin oligosaccharide chains.26
However, B. vulgatus, which showed decreased abundance after EEN administration, is known to be a part of the dysbiome.35 In addition, in previous studies on refractory diabetes and autism spectrum disorders, it was known that the abundances of B. vulgatus and A. muciniphila are inversely proportional.3637 This inverse relationship between these two species was also confirmed in the present study, suggesting that the relationship between the two species provides insights on the pathophysiology of EEN.
Through histological analysis, it was confirmed that the damage to the goblet cells that produce mucin was relatively less after EEN treatment. The decreased loss of goblet cells, which produce mucin might indicate accelerated mucin production. Our microbial and histopathological data suggested that mucin plays an important role in the therapeutic effects of EEN.
Mucin is widely known as a physical barrier that protects the mucosal surface of the gastrointestinal tract. Therefore, mucin might play a role in the pathogenesis of CD. In a study conducted in 2019, it was confirmed that mucin production increases in patients with CD in remission compared to that in a control group.38 In another study, reduced mucin synthesis was detected in ileal mucosa of patients with CD.39 Some bacteria, such as A. muciniphila and C. cocleatum, which have been indicated in this study, use mucin as an energy source.40 Through this study, it was confirmed that there are links among EEN administration, mucin-related bacteria, and an increase in mucin production. However, to confirm this relationship, it will be necessary to identify the molecular basis, such as expression of the MUC gene. In addition, it will be possible to confirm the increase in mucin production and the healing effect in the murine colitis model after the fecal transplantation of mucin-related bacteria. If mucin-related bacteria are a prerequisite for the healing effect, it is possible to evaluate the possibility of using mucin-related bacteria as a therapeutic agent. Even if not, it is thought that the possibility of mucin-related bacteria as a therapeutic indicator can also be evaluated. One of the limitations of this study is that changes in the metabolic pathway caused by changes in the microbiome that occur during EEN administration were not clearly identified. If we conducted a study to analyze intestinal metabolites together, we would have been able to confirm this change in metabolic pathways. In addition, another limitation of this study is that a small number of mice were used, and thus it is thought that more accurate results could be obtained if a larger number of mice were used in the study.
 XML Download