

 PDF
PDF Citation
 Print
Print


INTRODUCTION
Most people experience life crises infrequently and may face the stresses such as death of a spouse or child, divorce, imprisonment, personal illness, marital conflicts, and dismissal from work.1234 Macro-level events such as global economic crises also remarkably influence psychological illness and well-being.45
People face many obstacles to overcoming crisis in life and proactively manage life crises.6 Self-management helps people actively participate in their own care, obtain the information needed to set priorities, and manage their life plan. Like proactive leadership in organization and manpower management, the self-leadership component of self-management could empower people to become more able to overcome life crises by themselves.6 Self-leadership enables them to focus on life goals and develop action plans and preventively overcome life crisis and promote their post-traumatic growth, well-being, and quality of life (QOL).67891011 Post-traumatic growth is the experience of positive change in the individual following traumatic challenges.612 Resilience involves the ability of the individual to respond positively to traumatic events.13
To overcome the life crisis and prevent a new crisis, people need to evaluate and address their coping strategies.31415 However, there have been few tools assessing coping strategies, such as Seven Habit Profiles,16 Brief COPE17 and Post-Traumatic Growth Inventory.18
In previous studies, we developed the Smart Management Strategy for Health Assessment Tool (SAT),15 which evaluates the patient's time-specific strategies based on the conceptual frameworks of management strategy for health support of individuals overcoming the crisis and promoting their positive growth. Moreover, to reduce the assessment burden and elicit comprehensive information about the patient's strategies, we developed a 30-item short version of the SAT.19 The SAT-Short Form (SAT-SF) demonstrated good internal consistency and promising reliability compared to the original form.19
Therefore, in this study, we aimed to evaluate the association of self-management strategy with subjective health and well-being for the general South Korean population.
Go to : 
METHODS
Study design and subject recruitment
Data were collected from a broader general population targeted in the survey. Firstly, the survey was conducted with the general population aged 20–70 years and residing across 17 major cities and local districts from March to May 2018. In each major city and local district, all participants were recruited using two strata (age and sex) following the guidelines of the 2016 census of Korea. We used a probability-proportional-to-size technique for sample selection to represent a nationwide sample.20 As the response rate was expected to be 30%, approximately 4,000 people were contacted over the 17 major cities and local districts. Finally, 1,200 of them agreed to respond to the survey.
The survey data were collected by skilled interviewers of World Research Co. Ltd., professionalized in conducting surveys in Korea, who explained the purpose and details of the questionnaire to the respondents.
Measurements
To evaluate the association of self-management strategy with subjective health and well-being for the general population, all the participants answered the questionnaire starting with socio-demographic characteristics including age, sex, marital status, income, educational level, residential area, religion, and employment status.
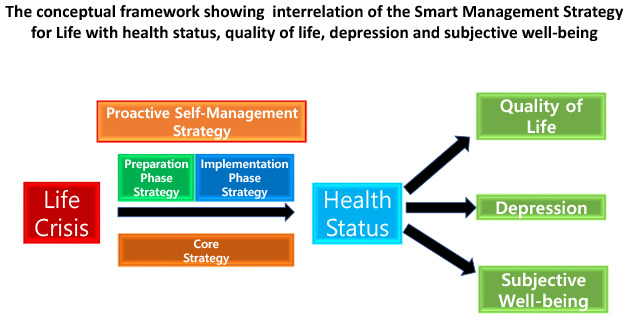
SAT-Life is based on the previously validated SAT-SF questionnaire for use among cancer patients to evaluate their self-management health strategies,1521 and then modified to assess the general population's coping strategies to help them overcome life crises and improve their QOL and well-being. Therefore, we also aimed to validate the assessment tool with reliability and comparison with other validated assessment tools in this study with the general population. The SAT-Life assessment consisted of three strategy sets: 1) core strategies (SAT-C), 2) preparation strategies (SAT-P), and 3) implementation strategies (SAT-I). Each of the three strategy steps contained 10-item tools describing each step in detail and a four-point Likert scale (never, sometimes, quite often, and always).22 SAT-Life scores were on a scale of 0 to 100, and is from 100-point scoring algorithm.19 Higher SAT-Life scores mean that participants have healthier and more scheduled life habits. In our study, each of the SAT-Life values were categorized into binary groups with cutoff scores of 66.66 out of 100 to identify the psychometric properties within the general population.
In addition to SAT-Life, the survey items were formulated on the basis of validated questionnaires including the 12-Item Short Form Survey (SF-12) that assessed respondents' physical and mental QOL,23 Patient Health Questionnaire-9 (PHQ-9)2425 for depression, McGill Quality of Life Questionnaire (MQOL)26 for subjective well-being (especially for spiritual and social support), and Satisfaction With Life Scale (SWLS).27 To measure the impact of different aspects of health status on SAT-Life, we also assessed the respondents' five health statuses from a holistic point of view (physical, mental, social, spiritual, and general health status) with 5 Health Status Questionnaire.28
Statistical analysis
Firstly, to test the reliability of the SAT-Life, we estimated Cronbach's α, which is a measure of internal consistency of patient responses. In general, α ≥ 0.70 was considered appropriate for the aggregation of responses into a single score.29 Secondly, we analyzed the general population with high competency in the SAT-Life scores (SAT-C, SAT-P, and SAT-I) under the hypothesis that they would perform better in health status, and QOL, and show lower depression. We calculated each of SAT-C, SAT-P, and SAT-I strategy differentiation according to the participants' five health statuses, physical and mental component summary from SF-12, and depression level on PHQ-9 to determine the validity of SAT-Life for use with the general population. To assess associations between them, univariate logistic analysis was performed to produce odds ratios (ORs). Each SAT-Life score, less than or equal to 66.6, was set as a reference point for comparisons between groups with higher SAT-Life scores on SAT-C, SAT-P, and SAT-I.30 We then carried out multiple stepwise logistic regression model by sequentially removing for the not significant variables at the P < 0.05 level and reassessing each statistically significant variable from univariate analysis for eligibility to remain in the model at the P < 0.05 level. The models were adjusted with basic demographic variables (age, sex, region, education and monthly income level).
Finally, to assess concurrent validity, correlation analyses between SAT-Life, MQOL, and SWLS scores in the general population were conducted. All calculated P-values were two-sided with the significance level set at P < 0.05. SAS statistical package version 9.3 (SAS Institute, Cary, NC, USA, 1990) and R 3.5.1 were used for all analyses.
Ethics statement
All recruiters provided informed consent. The research procedures followed the tenets of the Declaration of Helsinki and were approved by the Institutional Review Board (IRB) of Seoul National University College of Medicine (IRB No. 1804-024-934).
Go to :
RESULTS
Baseline characteristics
The characteristics of the study participants are summarized in Table 1. The mean age of the total 1,200 respondents was 46.97 ± 14.18 years, and 48.8% were men. The proportion of university graduates was 47.2%. The percentage of respondents who earned over 4,000$ per month was 45.9% (Table 1).
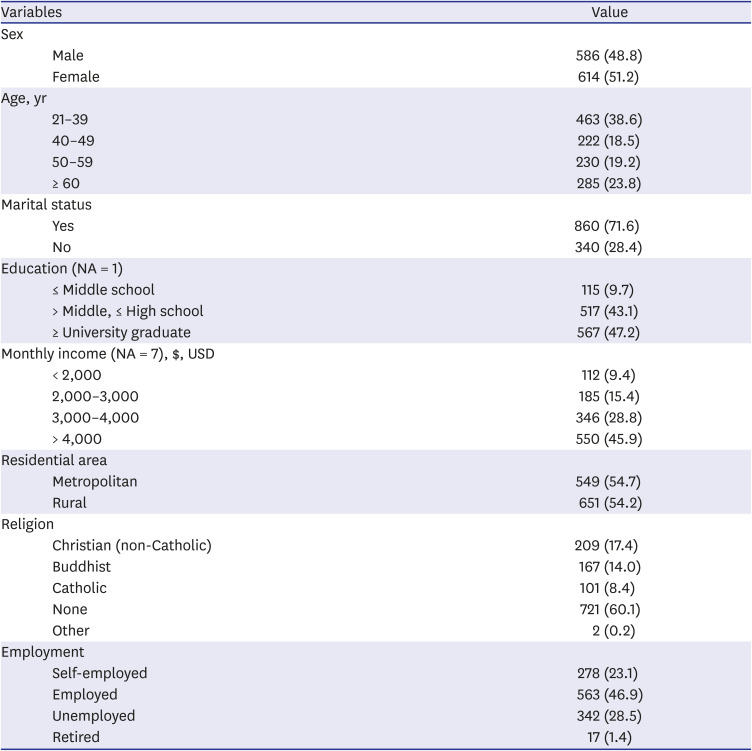
Table 1
Demographic characteristics of participants
![]()
Reliability of SAT-Life
Each of the three SAT-Life sets was applied into cross-validation of the newly enrolled general population sample. All values on the three SAT-Life sets showed a high reliability with good internal consistency (Cronbach's α: 0.860 for SAT-C, 0.880 for SAT-P, and 0.860 for SAT-I) (Table 2).
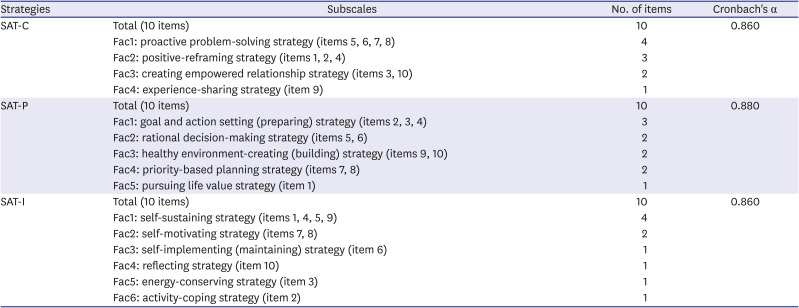
Table 2
Descriptive statistics and subscale reliability of the SAT-Life with the general population (n = 1,200)
SAT-Life = Smart Management Strategy for Health Assessment Tool-Life, Fac = factor, SAT-C = Smart Management Strategy for Health Assessment Tool-Core, SAT-P = Smart Management Strategy for Health Assessment Tool-Preparation, SAT-I = Smart Management Strategy for Health Assessment Tool-Implementation.
![]()
Association among the SAT-Life scores with health status, health-related QOL, and depression with multiple stepwise model
Higher SAT-Life scores lead to better health statuses. In multiple stepwise logistic regression model adjusted with basic demographic variables (age, sex, region, education and monthly income level), core strategy was independently associated with physical health (adjusted OR [aOR], 1.97; 95% confidence interval [CI], 1.51–2.58), mental health (aOR, 2.29; 95% CI, 1.77–2.95), social status (aOR, 2.06; 95% CI, 1.60–2.65), spiritual health (aOR, 2.92; 95% CI, 2.24–3.80), and general health status (aOR, 2.47; 95% CI, 1.89–3.23). Preparation strategy was independently associated with physical status (aOR, 2.65; 95% CI, 1.98–3.54), mental health (aOR, 2.36; 95% CI, 1.79–3.12), spiritual health (aOR, 2.63; 95% CI, 1.98–3.49), and general health status (aOR, 3.31; 95% CI, 2.47–4.43). Implementation strategy was independently associated with physical health (aOR, 2.39; 95% CI, 1.78–3.20), social status (aOR, 2.22; 95% CI, 1.68–2.94), spiritual health (aOR, 2.39; 95% CI, 1.78–3.17), and general health status (aOR, 2.42; 95% CI, 1.82–3.24) (Table 3).
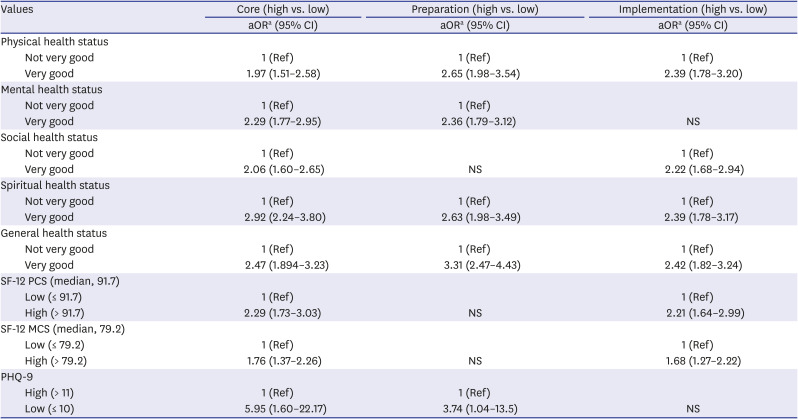
Table 3
Multiple stepwise models to identify the associations of SAT-Life with health status, HRQOL and depression in the general population (adjusted with demographic variables)
SAT-Life = Smart Management Strategy for Health Assessment Tool-Life, HRQOL = health-related quality of life, aOR = adjusted odds ratio, Ref = reference, NS = non-significant, SF-12 PCS = Short Form-12 Physical Component Score, SF-12 MCS = Short Form-12 Mental Component Score, PHQ-9 = Patient Health Questionnaire-9.
aMultiple Stepwise logistic regression models selected significant variables with P-value of stay = 0.05, leave = 0.05, adjusted with age (≤ 50 vs. > 50), sex (male vs. female), education (university graduate vs. less than high-school graduate), household monthly income (> 4,000$ vs. < 4,000$), and residence (metropolitan area vs. non-metropolitan area).
![]()
For calculating ORs, SF-12 Physical Component Score (PCS) and SF-12 Mental Component Score (MCS) were converted into binary forms with the median value of each of factors as the cutoff value. A cutoff of 10 for PHQ-9 was used, because a group with scores equal to or more than 10 is recognized as having severe depression. Core strategy was independently associated with higher PCS (aOR, 2.29; 95% CI, 1.73–3.03), higher MCS (aOR, 1.76; 95% CI, 1.37–2.26) and lower PHQ-9 (aOR, 263; 95% CI, 1.98–3.49). Preparation strategy was independently associated with lower PHQ-9 (aOR, 3.74; 95% CI, 1.04–13.45). Implementation strategy was independently associated with higher PCS (aOR, 2.21; 95% CI, 1.64–2.99) and higher MCS (aOR, 1.68; 95% CI, 1.27–2.22) (Table 3).
Correlations of the SAT-Life with MQOL and SWLS scores
The correlations of the SAT-SF with other factors is shown in Table 4. Pearson's correlation coefficients between scores on SAT-Life and the other factors (MQOL social support, MQOL spiritual well-being, and SWLS) explain having significant correlations ranging from 0.41–0.43) (Table 4).

Table 4
Correlations of SAT-Life scores with health status, quality of life, satisfaction with life, and subjective well-being in the general population (n = 1,200)
SAT-Life = Smart Management Strategy for Health Assessment Tool-Life, MQOL = McGill Quality of Life Questionnaire, SWLS = Satisfaction With Life Scale.
***P < 0.001.
![]()
Go to :
DISCUSSION
Our findings suggest that patients with high scores in the 3 SAT tool sets showed good health, QOL, and life satisfaction. Thus, patients with better self-management strategies seem to be associated with improving their health, QOL, and subjective well-being.15
Little is understood about of the role of coping strategies in overcoming life crisis for the general population. The personal sets of the SAT were positively associated with better physical and mental QOL as measured using the SF-12. Our study indicates that these SAT-Life scores were able to differentiate well between the before-maintenance group versus the maintenance group for achieving goals,19 and between group with high and low scores on depression in the general population. Our findings may indicate the importance of focusing on coping strategies for prevention of depression.1031 The scores of the SAT were correlated with social support and spiritual well-being measured with the MQOL, and life satisfaction measured using SWLS. Social support might strengthen social networks in the community that offers protection against the negative effects of economic recessions on health and QOL.32 Elderly people showed the effect of economic crises on well-being.43334
The association between self-management strategy and subjective outcomes may provide evidence for the implementation of life management strategies aimed at overcoming crisis and improving health, QOL, subjective well-being, and life satisfaction.1035 The SAT-Life could improve the usefulness of the SAT in overcoming life crisis and improving life.6 During periods of financial crisis, governments may reduce public expenditure on social welfare and health services, and primary healthcare professionals are in a key position to identify the population experiencing a life crisis and implement new strategies to ameliorate the impact of the crisis on them based on the assessment of their coping strategies with SAT-Life.3235
Our findings have practical implications for public intervention and health promotion.35 In order to improve the health, depression, and well-being of the general population, public interventions should focus on strategies that reduce negative coping at a population level.3235 SAT-Life can be completed easily and quickly, which might enhance the use of this test to monitor crisis-management strategies and allow the population to obtain feedback in community practice.19
However, our study had some limitations. First, this study involved only the Korean population, and SAT-Life requires further validation using population with other life crisis and across different cultures. Second, with only 30% of response rate this study's sample population could not represent the general population realistically, and the possibility of the selection bias. Third, the sample captured in this study may have higher income level than the average of Korean population. It may not be possible to get representative sample in terms of income level. Finally, the sensitivity to change such as crisis improvement or progression, or new events, was not assessed. Further cohort studies need to assess its practical utility in the community.
In conclusion, self-management strategies of health should be encouraged to be evaluated and used to improve subjective health and well-being outcomes. Further studies should be carried out in a cohort study across different cultures to support the practical application and usefulness in community.
Go to :
 XML Download