

 PDF
PDF Citation
 Print
Print


INTRODUCTION
Approximately 90% of surgical patients develop perioperative atelectasis by loss of lung aeration followed by positive pressure mechanical ventilation.1 Despite its high prevalence, anesthesia-induced atelectasis is difficult to detect at bedside, because it is usually too small to be detected on plain chest radiograph.23 Moreover, intra-abdominal pressure increases due to pneumoperitoneum during robotic gynecologic surgery leading to an upward shift in the diaphragm and a decrease in lung compliance.4 Shifting of the diaphragm may induce lung collapse and decrease the functional residual capacity of the lung.5 Aeration loss during pneumoperitoneum surgery in the Trendelenburg position induces perioperative atelectasis associated with decreased compliance, increased pulmonary vascular resistance, and possible development of postoperative pulmonary complications (PPCs) including pneumonia and acute lung injury.67 Therefore, perioperative anesthetic management is important to reduce PPCs including anesthesia-induced atelectasis. In this context, lung protective ventilation with low tidal volume (VT) combined with various levels of positive end-expiratory pressure (PEEP) and/or recruitment maneuvers (RMs) has been suggested to reduce anesthesia-induced atelectasis.8
Recent technology has suggested new modes of ventilation, using pressure-controlled ventilation, with digital feedback mechanism of controlling preset VT with the lowest possible pressure, which is called pressure-controlled ventilation volume-guaranteed (PCV-VG).9 Volume-controlled ventilation (VCV), on the other hand, could be an achieved variation of airway pressure, despite being a popular positive-pressure ventilation mode during general anesthesia (GA) in terms of advantages of ensuring accurate target volume.9
The decelerating inspiratory flow of PCV-VG mode could provide adequate ventilation with lower inspiratory pressure; however, the respiratory advantages of PCV-VG compared to VCV are controversial. Several previous studies have attempted to compare VCV and PCV-VG in terms of respiratory or hemodynamic parameters.1011121314 We applied lung ultrasound (LUS) for detecting whether the incidence of perioperative atelectasis during GA differed between the two groups. Bedside lung ultrasonography is a simple, noninvasive and radiation-free dynamic evaluation method for detecting anesthesia-induced atelectasis with a sensitivity and specificity of approximately 90%.31516 To the best of our knowledge, no study has compared perioperative atelectasis between VCV and PCV-VG in robotic gynecologic surgery using LUS. Therefore, we hypothesized that PCV-VG mode may be beneficial in reducing perioperative atelectasis via low VT of 6 mL/kg ventilation during robotic gynecologic pneumoperitoneum surgery in the Trendelenburg position.
METHODS
Study design and patient recruitment
The study was conducted between January 2021 and June 2021 in the Department of Anesthesiology and Pain Medicine of Ewha Womans University Mokdong Hospital. Eighty-two woman with American Society of Anesthesiologists (ASA) physical status classes I and II, who were aged between 19 and 70 years, underwent elective robotic gynecologic surgery maintaining the Trendelenburg position and carbon dioxide (CO2) insufflation for longer than an hour, and provided written informed consent, were included. The exclusion criteria were, patient refusal, body mass index (BMI) > 35 kg/m2, ASA physical status classes III and IV, history of thoracic surgery, severe chronic obstructive pulmonary disease, diaphragmatic paralysis, and inability to cooperate. The study procedures were discontinued if saturation dropped below 95%, peak inspiratory pressure (Ppeak) rose above 35 mmHg, and/or adverse events such as pneumothorax, subcutaneous emphysema, and pneumomediastinum were observed.
This randomized, prospective, controlled study included 82 patients who were divided randomly into two groups: VCV and PCV-VG. A VT of 6 mL/kg of predicted body weight (PBW) and PEEP of 5 mmHg were used in both groups. Patients were randomly allocated using Random Allocation Software, version 1.0 (M. Saghaei, Isfahan University of Medical Sciences, Isfahan, Iran). A sealed envelope containing information regarding group allocation was given to the anesthesiologist and the ventilator mode was accordingly set during surgery. The examiners who performed lung ultrasonography and the patients were blinded to group allocation. The primary outcome was LUS calculated using the method described by Monastesse et al.17 at different time points including T1 (before the induction of GA in the supine position at room air), T2 (10 minutes after the induction of GA in the supine position with fraction of inspired oxygen [FiO2] of 0.5), T3 (10 minutes after desufflation of CO2 in the supine position with FiO2 of 0.5), and T4 (30 minutes after emergence from anesthesia in the recovery room with a 6-L oxygen mask) in the VCV and PCV-VG groups. The secondary outcomes were ventilatory parameters and arterial blood gas analysis (ABGA) variables, i.e., pH, arterial oxygen pressure (PaO2)/FiO2 (P/F ratio), arterial carbon dioxide pressure, and arterial oxygen saturation at different time points. Ventilatory parameters, including Ppeak, mean airway pressure (Pmean), dynamic lung compliance (Cdyn), respiratory rate (RR), end-tidal CO2 (ETCO2), exhaled tidal volume (exhaled TV), were measured at T2 and T3. ABGA variables were measured at T2, T3, and T4. Oxygenation factor was calculated using the formula PaO2/(FiO2 × Pmean) during mechanical ventilation.18
Anesthesia methods
Standard anesthesia techniques were applied to all patients. After identification, each patient was connected to monitoring devices including an electrocardiograph, a pulse oximetry monitor for oxygen saturation (SpO2), non-invasive blood pressure monitor, bispectral index (BIS) monitor (A-2000®; Aspect Medical Systems, Norwood, MA, USA) and neuromuscular transmission (NMT Module; Datex-Ohmeda Inc., Helsinki, Finland). After 3 minutes of preoxygenation with a 6-L oxygen mask, patients were administered intravenous glycopyrrolate (0.2 mg) and midazolam (3 mg). GA was induced using propofol (2 mg/kg) and fentanyl (2 µg/kg). Response to the supramaximal stimulus was established with an NMT at the adductor pollicis before the anesthesiologist injected the rocuronium (0.6 mg/kg), and train-of-four (TOF) calibration was conducted. Endotracheal intubation was conducted with a TOF ratio of fewer than four twitches. Patients from both the groups were ventilated using a 50% oxygen-air mixture 3 L/min of inspiratory fresh gas, inspiratory/expiratory ratio 1:2, with a tidal volume of 6 mL/kg PBW and a PEEP of 5 mmHg. A Datex Ohmeda Avance CS2 (GE Healthcare, Helsinki, Finland) anesthesia machine was used for GA and each patient was randomly assigned to the VCV or PCV-VG mode. RR was adjusted to maintain the ETCO2 level between 30 and 40 mmHg during the surgery. A 22-G right radial artery cannulation was conducted after induction for continuous blood pressure monitoring, and an 18-G vein catheter was placed on the left median cubital vein for fluid administration expecting massive bleeding. Anesthesia was maintained with sevoflurane (1.5–3.0 vol%) and fentanyl (intermittent bolus up to 100 μg) to achieve the appropriate depth of anesthesia indicated by a BIS score of 40 to 60 and hemodynamic parameters within 20% of the baseline value. Rocuronium (0.2 mg/kg/h) was infused continuously for muscle relaxation at less than two twitches of the TOF ratio intra-operatively. Body temperature was measured using an esophageal temperature probe and maintained at 36–37 °C using a forced-air warming system (Bair-Hugger™; Augustine-Medical, Eden Prairie, MN, USA). Intra-abdominal pressure during surgery was maintained at 12 ± 2 mmHg and the Trendelenburg angle was 30° using the da Vinci Robot Surgical System (Intuitive Surgical, Sunnyvale, CA, USA). A crystalloid intravenous fluid was maintained at a dose of 8–10 mL/kg per hour to maintain volume, and if necessary, bolus colloid or packed red blood cell was used for replacement of volume loss intraoperatively. If SpO2 dropped below 92%, we applied RMs with an airway pressure of 30 cm H2O for 30 seconds with no change of FiO2. At the end of the surgery, the administration of sevoflurane was stopped and 100% oxygen flow was increased to 6 L/min. After confirming the TOF counts as greater than two, glycopyrrolate (0.4 mg) and pyridostigmine (10 mg) were administered for reversal agents. Extubation was conducted carefully in the operating room while confirming patients' spontaneous breathing and TOF ratio ≥ 0.9 to exclude residual neuromuscular block. After transfer of patients to the post-anesthesia care unit (PACU), a 6-L oxygen mask was supplied and an intravenous patient-controlled-analgesia with fentanyl was administered for post operative pain control; additional nonsteroidal anti-inflammatory drugs were provided at the patient's request.
Lung ultrasonography
Lung ultrasonography was performed at four-time points: T1, T2, T3, and T4. Two anesthesiologists with experience of more than 100 cases of lung ultrasonography conducted the examinations using the X-Porte device (Sonosite, Bothell, WA, USA) with a high-frequency linear array probe (6–13 MHz) to perform longitudinal scan in caudal to cranial direction.319 Each of the two examiners under a supervisor who did not participate in anesthesia of the surgery performed by the systematic protocol of examination15; we chose the highest LUS score between the two observers. LUS was performed in the supine position. We divided the lungs into six quadrants with longitudinal (anterior and posterior axillary lines) and axial lines (nipple line). We numbered each lung quadrant as one to six from cranial to caudal direction and divided anterior (1,2), lateral (3,4), and posterior (5,6) axes by longitudinal lines (Fig. 1). We set the scan depth to 4.8 cm as default and adjusted the depth in individual cases while finding two adjacent ribs to obtain the image of pleura, which is called ‘bat sign,’ and finding B-lines with the synchronized movement of the pleura. According to the semi-quantitative LUS,17 each quadrant ranged from 0 to 3; we added each score, with a maximum total score of 36, such that a higher LUS indicates greater aeration loss (Fig. 2). A score of 0 indicated normal aeration (0–2 B-lines), 1 indicated moderate loss of aeration (≥ 3 B-lines or small subpleural consolidations separated by a normal pleural line), 2 indicated severe loss of aeration (coalescent B-lines or multiple small subpleural consolidations separated by a thickened or irregular pleural line), and 3 indicated complete loss of aeration (consolidation). Due to the acoustic shadowing of the posterior part of the lung, sometimes it was difficult to evaluate the LUS of the posterobasal part of the lung. To overcome this disadvantage, we slightly lifted a patient contralaterally in the supine position with an assistant’s aid and rotated the probe 45° transversely to below the posterior axillary line corresponding to the hemidiaphragm which is called intercostal posterobasal view.3
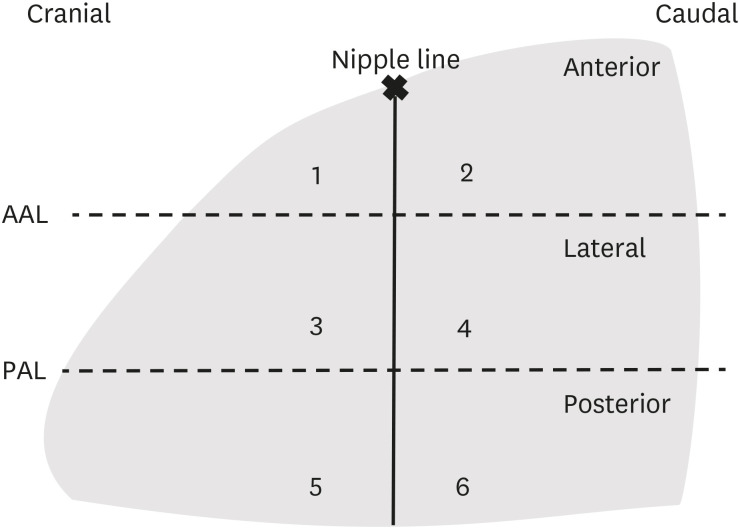
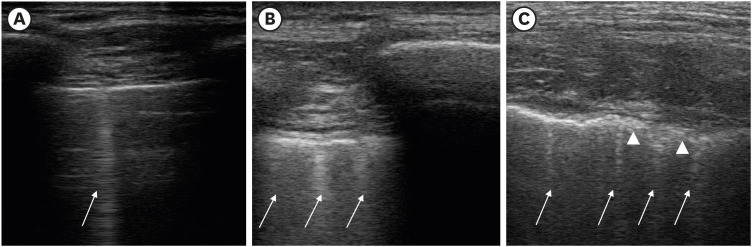
Fig. 1
Scheme for lung ultrasound investigation. Schematic image of the lung acquired from the lateral side of the patients who are in the supine position. The lung is divided into six quadrants by longitudinal AAL and PAL and an axial line (nipple line). The number indicates each quadrant of both the lungs (left or right). Three sections were divided by AAL and PAL: anterior section contains quadrants 1 and 2; lateral section contains quadrants 3 and 4; and posterior section contains quadrants 5 and 6.
AAL = anterior axillary lines, PAL = posterior axillary lines.
![]()
Fig. 2
Lung ultrasound findings with different scores. The modified lung ultrasound scoring system was applied in accordance with the method of Monastesse et al.17 (A) A score of 0, normal aeration (0–2 B-lines); (B) 1, small loss of aeration (≥ 3 B-lines or multiple small subpleural consolidations separated by a normal pleural line); (C) 2, moderate loss of aeration (multiple small subpleural consolidations separated by a thickened or irregular pleural line) by intercostal posterobasal view; no patient exhibited severe loss of aeration corresponding to an lung ultrasound score of 3 points. Arrow: B lines, arrowhead: thickened or irregular pleural line.
![]()
Statistical analysis
Statistical analyses were performed using IBM SPSS Statistics version 26.0 (IBM Corp., Armonk, NY, USA). The sample size was calculated from the mean value of total LUS and standard deviation (SD) in both VCV (mean of 13.1 and common SD of 4.8) and PCV-VG (mean of 10.0 and common SD of 4.9) groups and the primary endpoint was the total LUS assessed at PACU from the previous study of Kim et al.20 Therefore the sample size was derived as 42 in each group using an effect size of 0.63, a significance level (α) of 0.05, and 80% power, considering 5% dropouts using two-tailed t-test. The data were tested for normality using the Kolmogorov-Smirnov test, analyzed using appropriate statistical tests. Categorical variables describing the demographic data were analyzed using χ2 or Fisher's exact tests. Continuous variables describing ventilatory parameters were analyzed using paired t-test and presented as mean ± SD. LUS of the anterior, lateral, posterior, and total lung parts measured at each time point and ABGA parameters were analyzed using repeated-measures analysis of variance with Bonferroni's correction and presented as mean (95% confidence interval [CI]). If the sphericity was not assumed, the Geisser-Greenhouse correction was applied. A P value < 0.050 was considered statistically significant.
Ethics statement
This study was approved by the Institutional Review Board of Ewha Womans University, Seoul, Korea (EUMC 2020-12-024) on January 21, 2021. The trial was registered with the Clinical Trial Registry of Korea (No. KCT0006404) and all patients provided written informed consent. The study was conducted in accordance with the tenets of the Declaration of Helsinki, without any deviation from the study protocol.
RESULTS
Eighty-two eligible patients who provided informed consent participated in the study. We randomly allocated patients to the VCV or PCV-VG group. One patient in the VCV group was excluded since the surgical plan changed unexpectedly to open surgery. One patient in the PCV-VG group who experienced a drop in SpO2 to 92% was also excluded. Fig. 3 illustrates the study process according to the Consolidation Standards of Reporting Trials statement. Patient characteristics, duration of operation, anesthesia in the Trendelenburg position, and type of surgery were similar between the groups (Table 1).


Fig. 3
Consolidation standards of the reporting trials statement.
VCV = volume-controlled ventilation, PCV-VG = pressure-controlled ventilation volume-guaranteed.
![]()
Table 1
Patient characteristic and perioperative data
Values are presented as the mean ± standard deviation, frequency (%), number (%), or median (interquartile range).
BMI = body mass index, ASA PS = the American Society of Anesthesiologists physical status, VCV = volume-controlled ventilation, PCV-VG = pressure-controlled ventilation-volume guaranteed.
![]()
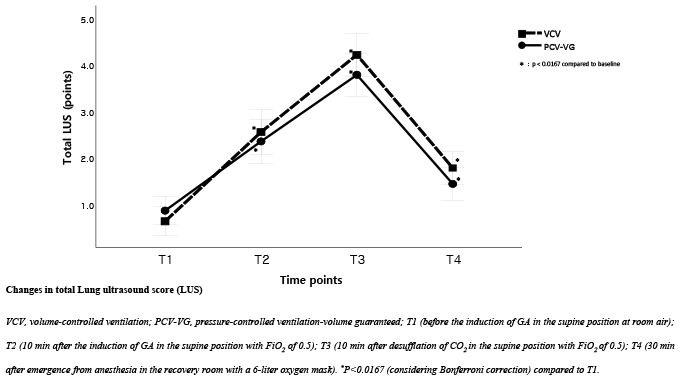
Total LUS at each time point was not significantly different between the VCV and PCV-VG groups (P = 0.432) (Table 2). The total LUS has changed from baseline to T4, 0.63 (95% CI, 0.32, 0.94) to 1.77 (95% CI, 1.42, 2.21) in the VCV group and 0.86 (95% CI, 0.56, 1.16) to 1.43 (95% CI, 1.08, 1.78) in the PCV-VG group (P = 0.170). Total LUS decreased from T3 to T4 in both the groups (P < 0.050), but it was still higher than the baseline LUS (P < 0.0167 considering Bonferroni correction). As shown in Table 2, the posterior lung (quadrants 5,6) had the greatest changes in LUS from the baseline.
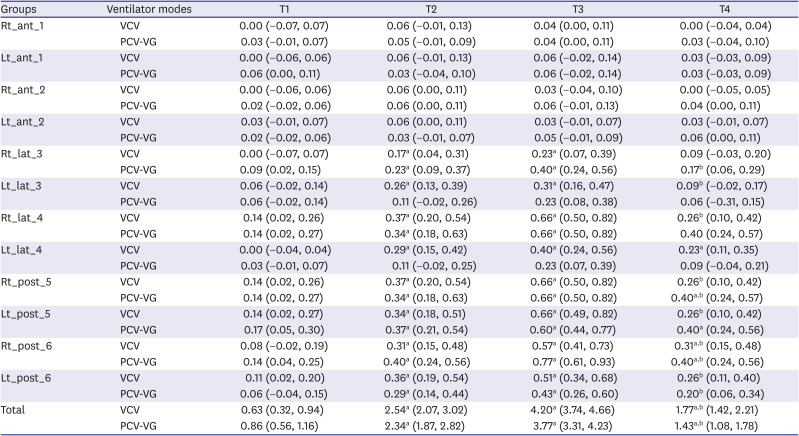
Table 2
Lung ultrasound score
Data are presented as the mean (95% confidence interval) according to repeated measured analysis of variance. Each group was named by rules. First box is right or left lung, second box is lung section (anterior, lateral, posterior) and third box is lung quadrants (one to six) (e.g, Rt_ant_1, right lung_anterior section_quadrant 1).
VCV = volume-controlled ventilation, PCV-VG = pressure-controlled ventilation-volume guaranteed, T1 = before the induction of GA in the supine position at room air, T2 = 10 minutes after the induction of GA in the supine position with FiO2 of 0.5, T3 = 10 minutes after desufflation of CO2 in the supine position with FiO2 of 0.5, T4 = 30 minutes after emergence from anesthesia in the recovery room with a 6-L oxygen mask.
aP < 0.0167 (considering Bonferroni correction) compared to T1; bP < 0.050 T4 compared to T3.
![]()
Ppeak was higher and Cdyn was lower in the VCV group than in the PCV-VG group (P < 0.001 for both) and other ventilatory parameters (Pmean, exhaled TV, RR, ETCO2, and oxygenation factor) were not significantly different between the groups (Table 3). ABGA variables were similar between the groups (Table 4). Oxygenation factor (2.2 ± 0.8 in the VCV group and 2.1 ± 0.6 in the PCV-VG group at T3, P = 0.667) and P/F ratio (mean 437.1, in the VCV group and mean 455.2, in the PCV-VG group at T3) were not significantly different between the groups.
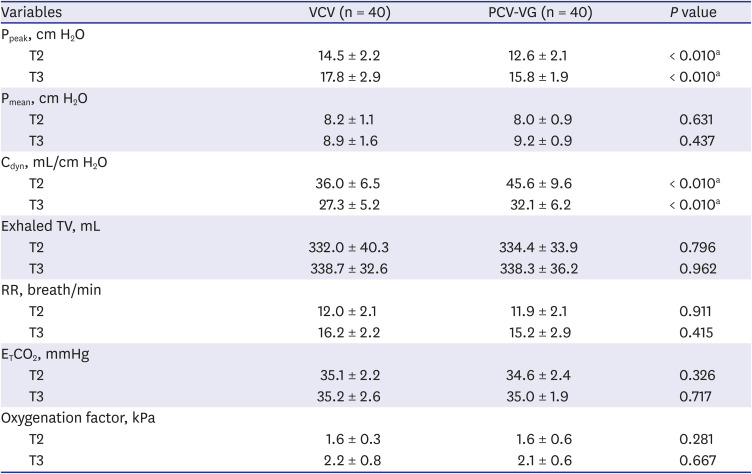
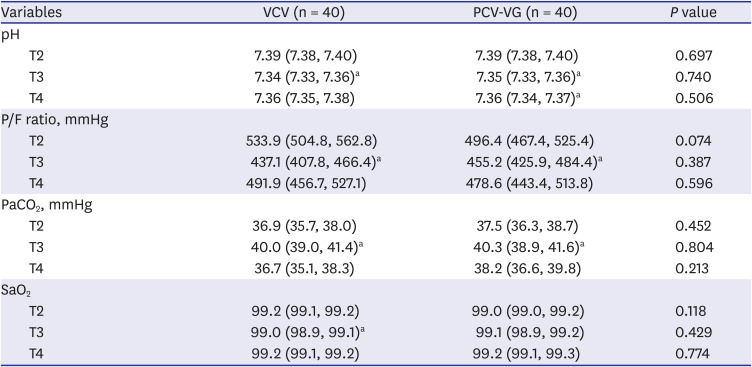
Table 3
Ventilatory parameters
Values are presented as mean ± standard deviation according to independent t-test and paired t-test.
VCV = volume-controlled ventilation, PCV-VG = pressure-controlled ventilation-volume guaranteed, Ppeak = peak inspiratory pressure, Pmean = mean inspiratory pressure, Cdyn = dynamic compliance, Exhaled TV = exhaled tidal volume, RR = respiratory rate, ETCO2 = End tidal CO2, T2 = 10 minutes after the induction of GA in the supine position with FiO2 of 0.5, T3 = 10 minutes after desufflation of CO2 in the supine position with FiO2 of 0.5.
aP < 0.050 compared VCV to PCV-VG.
![]()
Table 4
Arterial blood gas analysis
Data are presented as the mean (95% confidence interval) according to repeated measured analysis of variance.
VCV = volume-controlled ventilation, PCV-VG = pressure-controlled ventilation-volume guaranteed, P/F ratio = arterial oxygen pressure (PaO2)/fraction of inspired oxygen (FiO2), PaCO2 = arterial carbon dioxide pressure, SaO2 = arterial oxygen saturation, T2 = 10 minutes after the induction of GA in the supine position with FiO2 of 0.5, T3 = 10 minutes after desufflation of CO2 in the supine position with FiO2 of 0.5, T4 = 30 minutes after emergence from anesthesia in the recovery room with a 6-L oxygen mask.
aP < 0.0167 (considering Bonferroni correction) compared to T2.
![]()
One out of 82 participants from the PCV-VG group exhibited an abrupt drop in SpO2 to 92% while changing the position from supine to the Trendelenburg position. We performed an RM with an airway pressure of 30 cmH2O for 30 seconds with no change in FiO2. SpO2 returned to normal immediately after RM. The patient's PaO2 was 204.9 mmHg, Ppeak was 17 cmH2O, and LUS was 4 at T3. Although she had no history of pulmonary disease or smoking and her BMI was 24.55 kg/m2, we excluded her data from the analysis, as she met the exclusion criteria.
DISCUSSION
In the present study, we demonstrated that there was no significant difference in perioperative atelectasis using LUS between the ventilator modes with a low VT of 6 mL/kg during pneumoperitoneum surgery in the Trendelenburg position. There was no significant inter-group difference in total LUS over four-time points. PCV-VG did not result in any superiority for improving oxygenation by comparing oxygenator factor and P/F ratio.
Combined Trendelenburg position accompanied with pneumoperitoneum increases intrathoracic pressure, reduces functional residual capacity which induces atelectasis formation primarily in dependent portion.2122 Especially in robotic gynecologic surgery, pneumoperitoneum, and the Trendelenburg position must be kept for the operation time under docking of the robot system, it might possibly cause perioperative atelectasis as our study demonstrated.
Modern ventilation mode of PCV-VG is known as dual-controlled ventilation mode that manufacturer is GE healthcare, similarly, manufacturer of “pressure-regulated volume control ventilation” is Maquet, and volume mode with “auto-flow” ventilation is Dräger.9 Despites the advantages of dual-controlled ventilation that delivering target volume with the lowest possible pressure, there has not been established consensus of the mode of mechanical ventilation reducing PPCs.23 Some of previous studies have reported findings consistent with those in the present study,1011121314 while others have reported different results.202425 We believe that these discrepancies were due to that of elderly or obese participants who have a higher risk of lung diseases, different types and duration of surgeries, and differences in the surgical position such as lateral position. For example, Kim et al.20 demonstrated that LUS in the PCV-VG group was lower than that in the VCV group in elderly patients undergoing hip joint surgery in the lateral position. Unlike young and healthy participants in our study, elderly patients from the study by Kim et al.20 tended to exhibit decreased perioperative pulmonary function and their total LUS was likely to be higher than that reported in our study. Moreover, they measured LUS during hip joint surgery in the lateral position, LUS of dependent lung showed great alteration from baseline which might lead discrepancy to our study. Results from the study by Lian et al.,24 they compared PCV to VCV in prolonged gynecologic laparoscopic surgery their mean Trendelenburg time was 145 minutes which is twice as longer than that of our study. Toker et al.26 investigated the obese patients with BMI of 30 to 40 kg/m2, and the PCV-VG mode was favorable for the obese participants in terms of decreasing airway pressure and improving oxygenation.
Despite the lower Ppeak and higher Cdyn were observed in the PCV-VG group than in the VCV group (P < 0.050 for both), our results showed that the PCV-VG had no superiority over VCV in terms of oxygenation using PaO2, oxygenation factor. Previous studies have been demonstrated that higher Ppeak and lower Cdyn during VCV do not have a harmful effect on lung respiratory dynamics.101326 Ppeak is commonly reflected Cdyn of the entire respiratory system,27 and under isovolumetric conditions, Cdyn is not only related to the elastic properties of the respiratory system but also resistive elements of the respiratory mechanism such as airway pressure.1328 On the other hand, Pmean, the average pressure of the respiratory system throughout the inspiratory phase, corresponds to mean alveolar pressure, and an increase in Pmean seems to be closely related to increased oxygenation by recruiting collapsed alveoli and reducing shunt.272930 Pmean is one of the most critical factors related to gas exchange and it determines the recruitment of collapsed alveoli and redistribution of alveolar blood flow.31 Our results exhibited PCV-VG exhibited no benefits over VCV in terms of Pmean, and these results might suggest that either oxygenation factor or the LUS was not significantly different depending on the ventilator modes. Since oxygenation factor is calculated using the formula PaO2/(FiO2 × Pmean), Pmean incorporates the effects of PEEP, inspiratory: expiratory ratio, VT, and/or Ppeak.18 We predicted that oxygenation factor, a new oxygenation indicator in mechanically ventilated lung function, might be different between the ventilator modes, but we did not find the difference in oxygenation factor between them.
We assessed total LUS according to the method described by Monastesse et al.,17 the total LUS were 2.54, 95% CI (2.07, 3.02) in the VCV group and 2.34, 95% CI (1.87, 2.82) in the PCV-VG group (P = 0.557) at T2. These values are slightly lower than those reported by Monastesse et al.17 (total LUS of 4 at 5 min after GA induction).17 They set a tidal volume of 8 mL/kg PBW and no PEEP via VCV, which was different from our ventilator settings (6 mL/kg PBW and a PEEP of 5 mmHg in both the groups).
Another possible reason is that LUS in the dorsal part of the lung where atelectasis occurs most frequently during anesthesia,32 was possibly underestimated in the supine position due to rib acoustic shadowing. Even though we used the method by Monastesse et al.17, rib acoustic shadowing in the dependent portion of the lung interfered with the B-lines which might lead to underestimation of LUS in the dorsal part of the lung. To overcome this weakness of scanning posterobasal part of the lung, we placed the probe perpendicularly to the two adjacent ribs corresponding hemidiaphragm in the supine position, vertically below the posterior axillary line according to the method by Acosta et al.3 Whereas examining LUS in posterolateral chest by turning the patient to the lateral position was recommended for improving accuracy,32 but we could not scan the lung in the lateral position in terms of the safety concerns. Because the patient was paralyzed during surgery, rotating intubated patient could make her in danger. Previous studies were concerned that the difficulty in the measurement of modified LUS in posterobasal region of the lung.3152333 Acosta et al.3 named the sonographic view as intercostal posterobasal view where the intercostal space of the hemidiaphragm and immediately below the posterior axillary line. The advantage of this view is assessing anesthetized patients’ lungs in the supine position as our study did. Cho et al.34 also reported the difficulty of assessing postererobasal side of the lung. They tried using additional oblique scans along the intercostal space in the posterior region of the lung, but B-lines were still obscured by rib acoustic shadowing.
The present study has some limitations. First, we targeted young, healthy women who underwent elective robotic gynecologic surgery, which might have contributed to lower LUS than previous studies,172023 and the lack of differences in LUS between the groups. Some studies have demonstrated that patients with compromised cardiac or pulmonary function or morbidly obese patients have better oxygenation with PCV or PCV-VG.202535 Moreover, our surgery and Trendelenburg time were relatively short, which might lead to the lack of differences in LUS and reduced LUS comparing to previous studies. Further studies are required for the patients who undergo a longer duration of Trendelenburg time, older patients with compromised pulmonary function, or morbidly obese patients. Second, there is a possibility of underestimating our LUS, since we used the traditional semi-quantitative approach suggested by Monastesse et al.17 using longitudinal scan of intercostal space instead of transverse scans of the lung33 or the new quantitative scoring system32 except for the posterobasal part of the lung.17 New quantitative scoring system is that score 1 to 2 is determined by the percentage of involved pleura which is different from that of our semi-quantitative methods which score 1 to 2 is determined by the number of B-lines or coalescence. They suggested that the transverse scanning has an advantage of the wider and more constant length of pleura which leads scoring 1 instead of 0 corresponding to better identification of B-lines and consolidations.33 Another limitation is that we chose the highest score of LUS between two observers instead of measuring inter-operator agreements of LUS using Inter-Class-Correlaion Coefficient for improving the quality of LUS. The probe orientation, different scoring systems, and inter-operator agreements might have effects on underestimating the LUS of our study, future studies using different scanning and scoring methods are required. Third, the consensus of evaluating atelectasis using LUS has not been established, we only identified the trend of changing LUS in both ventilator groups. Additional studies are required to evaluate perioperative atelectasis quantitively for clinical use in the future. Fourth, we could not measure LUS immediately after insufflation of the pneumoperitoneum due to the difficulty in assessing the lung during the surgery. In case of fall accidents during the robotic surgery, we fastened the patients’ chest belt. Instead of measuring LUS immediately after pneumoperitoneum in the Trendelenburg position, we had no choice but to measure it at T3.
In conclusion, using a low VT of 6 mL/kg during pneumoperitoneum surgery in the Trendelenburg position, we observed no evidence that PCV-VG was superior to VCV in terms of perioperative atelectasis. For young and healthy patients, it seems reasonable to select the ventilator mode according to the anesthesiologist's preference during pneumoperitoneum surgery in the Trendelenburg position in terms of perioperative atelectasis.
 XML Download