

 PDF
PDF Citation
 Print
Print


Introduction
Many patients with diabetes may develop various complications along the course of the disease, including peripheral diabetic neuropathy, diabetic nephropathy, and diabetic retinopathy (DR). DR is a retinal microvascular disease that may eventually lead to loss of vision [1-3]. Some epidemiological studies have recognized several risk factors for DR, including long-standing diabetes, prolonged hyperglycemia, and hypertension. Genetic factors, body mass index, and dyslipidemia might also be risk factors for DR [4, 5].
Advanced glycation end products (AGEs) are the late products of nonenzymatic glycation, which are usually present in a substantially higher level in patients with diabetes. AGEs may promote retinal neuronal cell apoptotic loss. DR can be treated with intravitreal injection of vascular endothelial growth factor (VEGF) inhibitors, photocoagulation, or even pars plana vitrectomy. Nevertheless, these lines of treatment might not be able to preserve useful vision in advanced cases. Tight control of glucose levels is usually considered a corner stone in hindering the progression of DR [6]. Oral hypoglycemic agents and insulin remain the most popular drugs used in treating diabetes. However, hypoglycemia, weight gain, and drug resistance may complicate the use of these drugs. In contrast, several natural herbal medicines have demonstrated promising results in diabetic control with minimal adverse effects [7].
Formerly, there was much interest in natural hypoglycemic agents of plant origin as they were less toxic with few side effects. Ingestion of citrus fruits with their constituent flavonoids was proven to decrease the risk and increase survival in some chronic disorders [8]. A common component of our diet—bioflavonoids—has insulin-like properties and insulin receptor function [9].
Hesp (hesperetin 7-rhamnoglucoside) is a flavonoid that is obtainable from a group of species of citrus, including Citrus aurantium L. and Rutaceae Citrus unshiu [10]. Studies have reported that hesp has several biotic functions, such as antidiabetic, antihyperlipidemic, antioxidant, anticancer, antiatherogenic, and anti-inflammatory effects [11, 12].
This study was designed to assess the efficiency of hesp supplementation in improving histological, ultrastructural, and biochemical retinal impediments in albino rats with diabetes compared with that of insulin treatment alone and to elucidate the possible underlying mechanism.
Materials and Methods
Chemical and drugs
Streptozotocin (STZ) (catalog no. S0130) and hesp (catalog no. H5254) were obtained from Sigma Chemical Co. (St. Louis, MO, USA). Lantus (insulin glargine) was manufactured by Sanofi–Aventis (Frankfurt am Main, Germany). Glycation end product kits (1:200; catalog no. KAL-KH001) were obtained from Cosmo Bio Co, Ltd. (Tokyo, Japan). All chemicals used in the biochemical analysis were purchased from Sigma Chemical Company.
Animals
Eighty 3-week-old male albino rats (body weight, 70±12 g) were incorporated into the experiment. They were placed in stainless-steel cages and kept at room temperature. The animals were fed on standard laboratory pellet diet and tap water ad libitum and were accommodated for 2 weeks before the start of the experiment. The experiment was conducted according to the Guide for the Care and Use of Laboratory Animals [13]. The local ethics committee of the Faculty of Medicine, Zagazig University, Egypt, approved this study (ID: 4476).
Animal grouping
The animals were randomly allocated into four equal groups (20 each) as follows:
Group I: this group was further divided into two subgroups:
Ia (control): The animals were injected intraperitoneally once with saline as a vehicle only.
Ib (positive control): The animals were received hesperidin by orogastric tube at a dose of 200 mg/kg [11].
The remaining 60 rats were treated with STZ to induce diabetes and were randomly divided into three equal groups:
Group II (type 1 diabetes mellitus [T1DM]) consisted of rats with diabetes receiving no treatment.
Group III (insulin-treated diabetes) comprised rats with diabetes receiving daily subcutaneous (SC) injections of 2 units of long-acting insulin [14].
Group IV (insulin- and hesperidin-treated diabetes) consisted of rates receiving daily hesp at a dose of 200 mg/kg by orogastric tube along with a dose of insulin, similar to that in group III [15].
Induction of diabetes
In groups II, III, and IV, T1DM was induced by a single intraperitoneal STZ injection after 12 hours of fasting at a dose of 50 mg/kg diluted in sodium citrate buffer (10 mM, pH 4.5) [16]. The rats were considered diabetic if the concentration of fasting tail blood glucose was higher than 200 mg/dl using a digital glucometer 2 days after the STZ injection [17]. Using a glucometer, blood samples from the tails were obtained weekly for measuring the blood glucose level along the study.
Sampling and histological analysis
The rats’ health parameters were measured and recorded daily. The rats’ weight was measured weekly until the end of the study. At the phase of sacrifice (8 weeks after diabetes confirmation), the animals were anesthetized with phenobarbital. Fasting blood specimens (after 12–14 hours) were taken from a tail vein and processed immediately into two tubes. The first tube contained fluoride for the immediate estimation of fasting blood glucose level, and the other tube was centrifuged after clotting at room temperature. The resulting sera were divided into small glass tubes and stored at −20°C before biochemical assessment. The right eye balls were finely dissected, and then, parts of the retina were snap-frozen in liquid nitrogen and stored at −80°C to measure the mRNA expression of glial fibrillary acidic protein (GFAP) and VEGF. For the light microscopy study, some left eye balls were prepared for routine histological examination and stained with H&E, following the method explained by Bancroft and Gamble [18]. For immunohistochemical study and recognition of AGEs, the sections were incubated using a labeled streptavidin–biotin kit (DAKO, Carpinteria, CA, USA) and were visualized using 3,3’-diaminobenzidine tetrahydrochloride [19, 20]. For the transmission electron microscopy study, small specimens of the retinae were prepared following the technique of Glauert and Lewis [21]. Ultrathin sections were examined using a JEOL-JEM 1010 electron microscope after being stained in the Department of Histology and Cell Biology, Faculty of Medicine, Zagazig University, Egypt.
Morphometric analysis
The thickness of different layers of the retina was measured in three planes of H&E-stained sections—central (100–150 μm away from the optic nerve), peripheral (100–150 μm away from the ora serrata), and mid peripheral sections (midway between the center and peripheral sections)—using “Leica Quin 500 C” image analyzer computer system (Leica Imaging System Ltd., Cambridge, UK). The measurements were recorded using a total magnification of ×400 [22]. The area of positive AGE immunostaining was measured in all retinal layers within 10 fields for each animal at a total magnification of ×400. Five sections obtained from five animals from the same group were used for measuring.
Biochemical analysis
Estimation of oxidant and antioxidant markers in retinal tissue
The left eyeball was prepared according to Saenz-de-Viteri et al. [23]. It was placed on a blotting paper, and an opening was made 5 mm posterior to the limbus to detach the anterior and posterior eye poles. Then, the retina was separated from the choroid complex using a scalpel blade and forceps. Once the retina samples were taken, they were positioned in plastic Eppendorf tubes with cold 0.9% saline phosphate-buffered saline (diluted ratio 1:5 according to their respective weight; pH 7.2). Using a mechanic homogenizer, the tissue was homogenized; then, the homogenate was centrifuged at 3,500 rpm for 15 minutes at 4°C. After centrifugation of the homogenate, the supernatant was collected and recentrifuged under the same conditions. The second supernatant was used for enzyme measurements. The oxidative stress status in the retinal homogenate was assessed by determining malondialdehyde (MDA), superoxide dismutase (SOD), glutathione peroxidase (GSH-Px), and catalase (CAT) using commercially available colorimetric kits (Biodiagnostic, Giza, Egypt) according to the manufacturer’s instructions.
Quantitative estimation of plasma glucose levels
Plasma glucose was assessed using specific colorimetric glucose kit (Bioscience, Cairo, Egypt).
RNA extraction and quantitative real-time polymerase chain reaction (PCR)
For estimating VEGF and GFAP, the gene expression of GFAP and VEGF in retinal tissue was measured using real-time quantitative PCR (qPCR). Total RNA was isolated from frozen retinal tissues using RNeasy Mini Kits (Qiagen catalog no. 74104; Qiagen, Gemantown, MD, USA) according to the manufacturer’s instructions. RNA concentration and purity in each sample were determined using the NanoDrop 2000c Spectrophotometer (Thermo Fisher Scientific, Rockford, IL, USA) using 260- and 260/280-nm ratios, respectively. Reverse transcription PCR was performed on 1 µg of total RNA using a QuantiTect® Reverse Transcription kit (Qiagen). The cDNA product was subjected to real-time PCR for the genes under study using SYBR green PCR master mix (Applied Biosystem SYBR® Green PCR Master Mix 2×, catalog no. 4344463; Life technology, Carlsbad, CA, USA) and primers specific for each gene. The primer sequences for glyceraldehyde 3-phosphate dehydrogenase (GAPDH), GFAP, and VEGF (Table 1). GAPDH was used as the reference gene. Primer sets were purchased from Vivantis Co. (Selangor Darul Ehsan, Malaysia). The real-time PCR program consisted of an initial step of enzyme activation at 95°C for 10 minutes, followed by 40 cycles of template denaturation at 95°C for 15 seconds, annealing at 60°C for 1 minute, and extension at 72°C for 45 seconds. Real-time PCR assays were performed on the Applied Biosystems 7500 real-time PCR detection system (Life technology). The specified gene transcription level was calculated using the comparative threshold method (2−ΔΔCt) according to Livak and Schmittgen [24]. Melting curve analyses were used to verify the specificity of the PCR products.
Statistical analysis
Statistical data analyses were performed using Statistical Package for the Social Sciences (version 17; SPSS Inc., Chicago, IL, USA). The results of multiple groups were compared using one-way analysis of variance, followed by a post hoc test (least significant different test). The P-values of less than or equal to 0.05 were used to denote statistical significance.
Results
Body weight and general conditions
At the end of the study, group II had significantly decreased body weights and showed sluggishness, polyphagia, and polyuria. Fungal skin lesions were found in nine rats in group II, which were treated with topical treatment. Groups III and IV showed improvement in general health conditions. The mean body weight of group IV was significantly higher than that in groups II and III (Table 2).
Histological results
H&E-stained sections
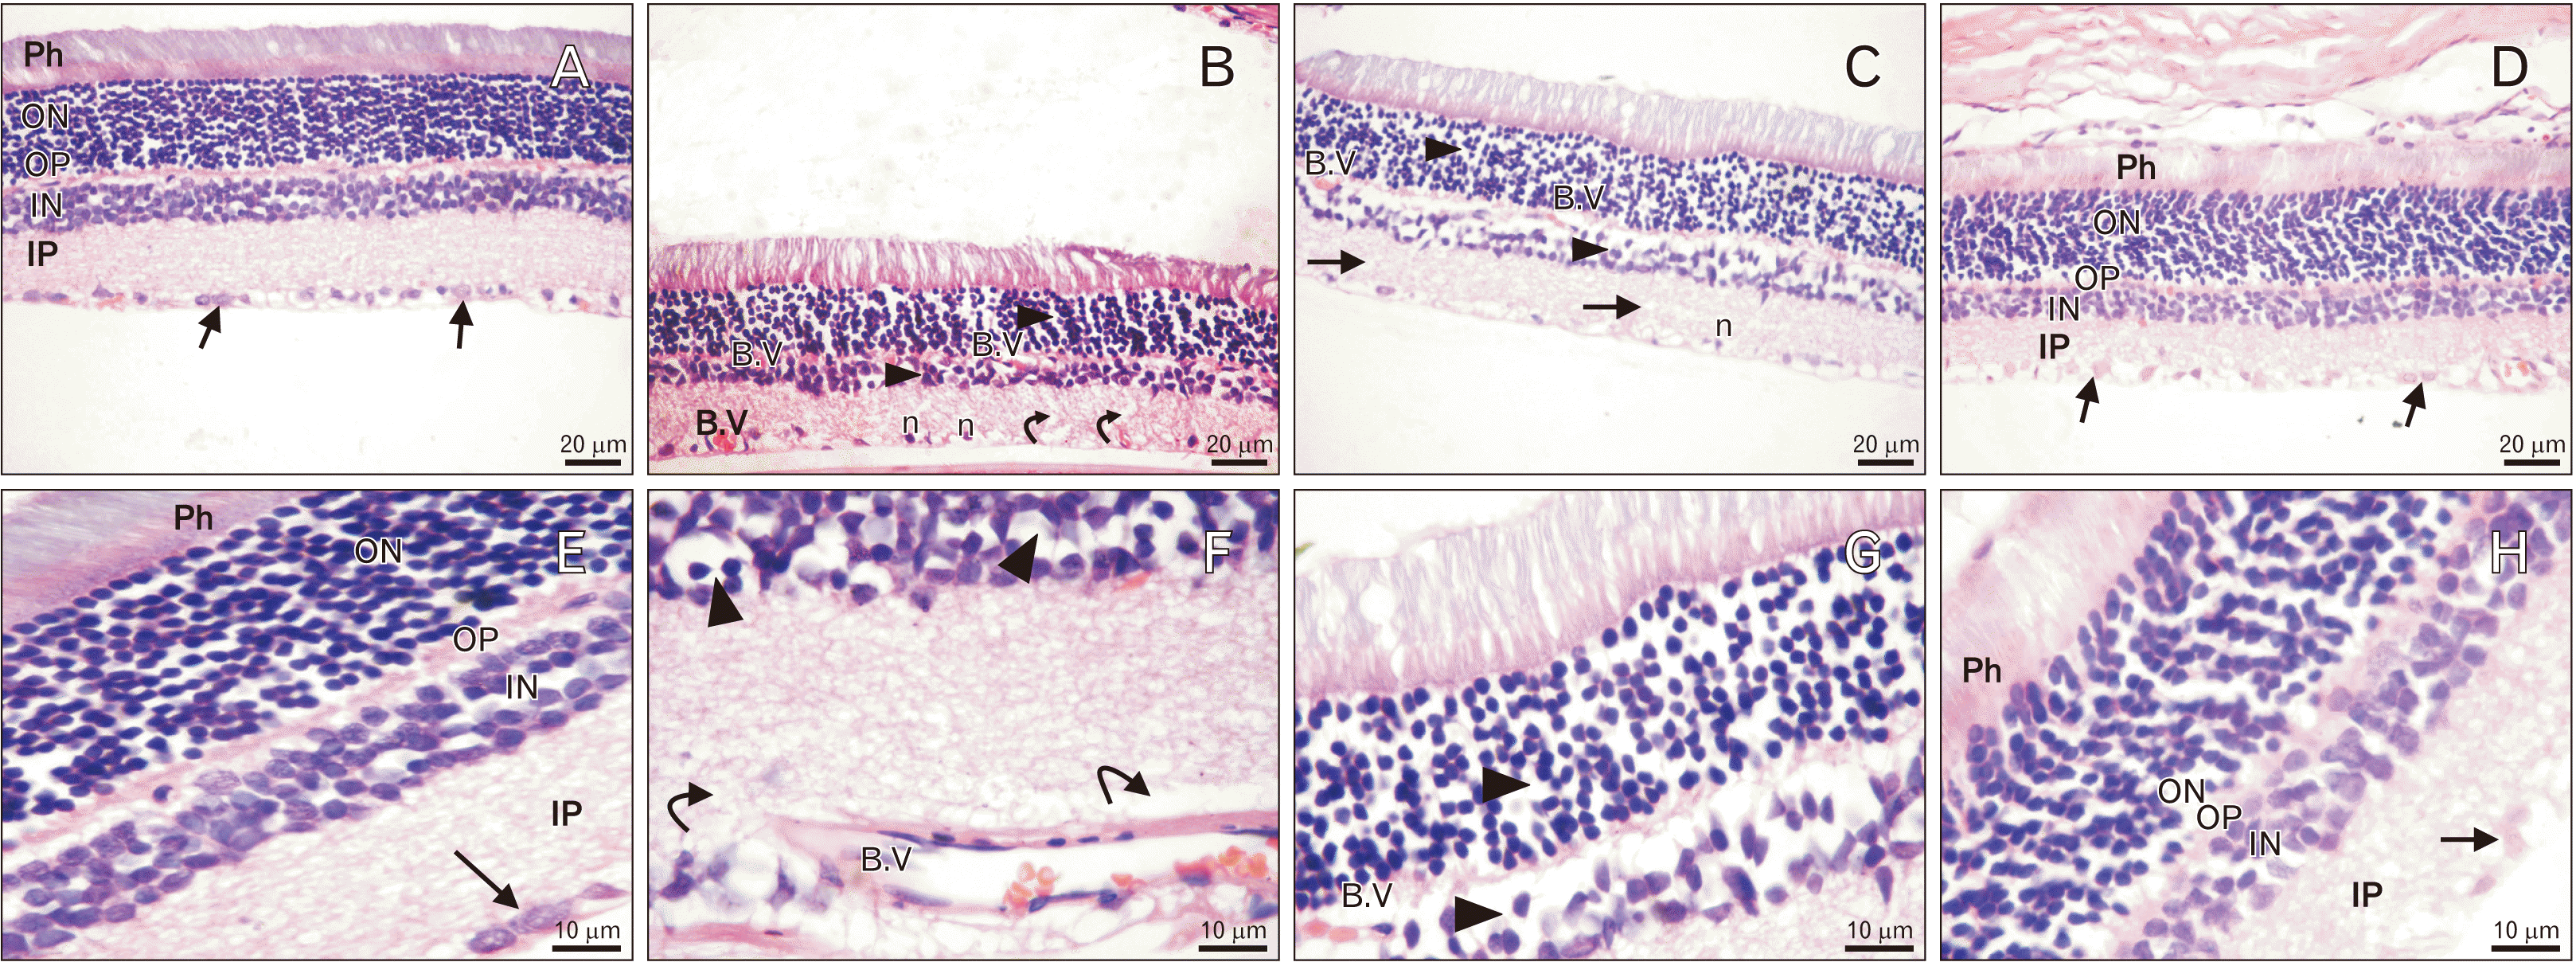
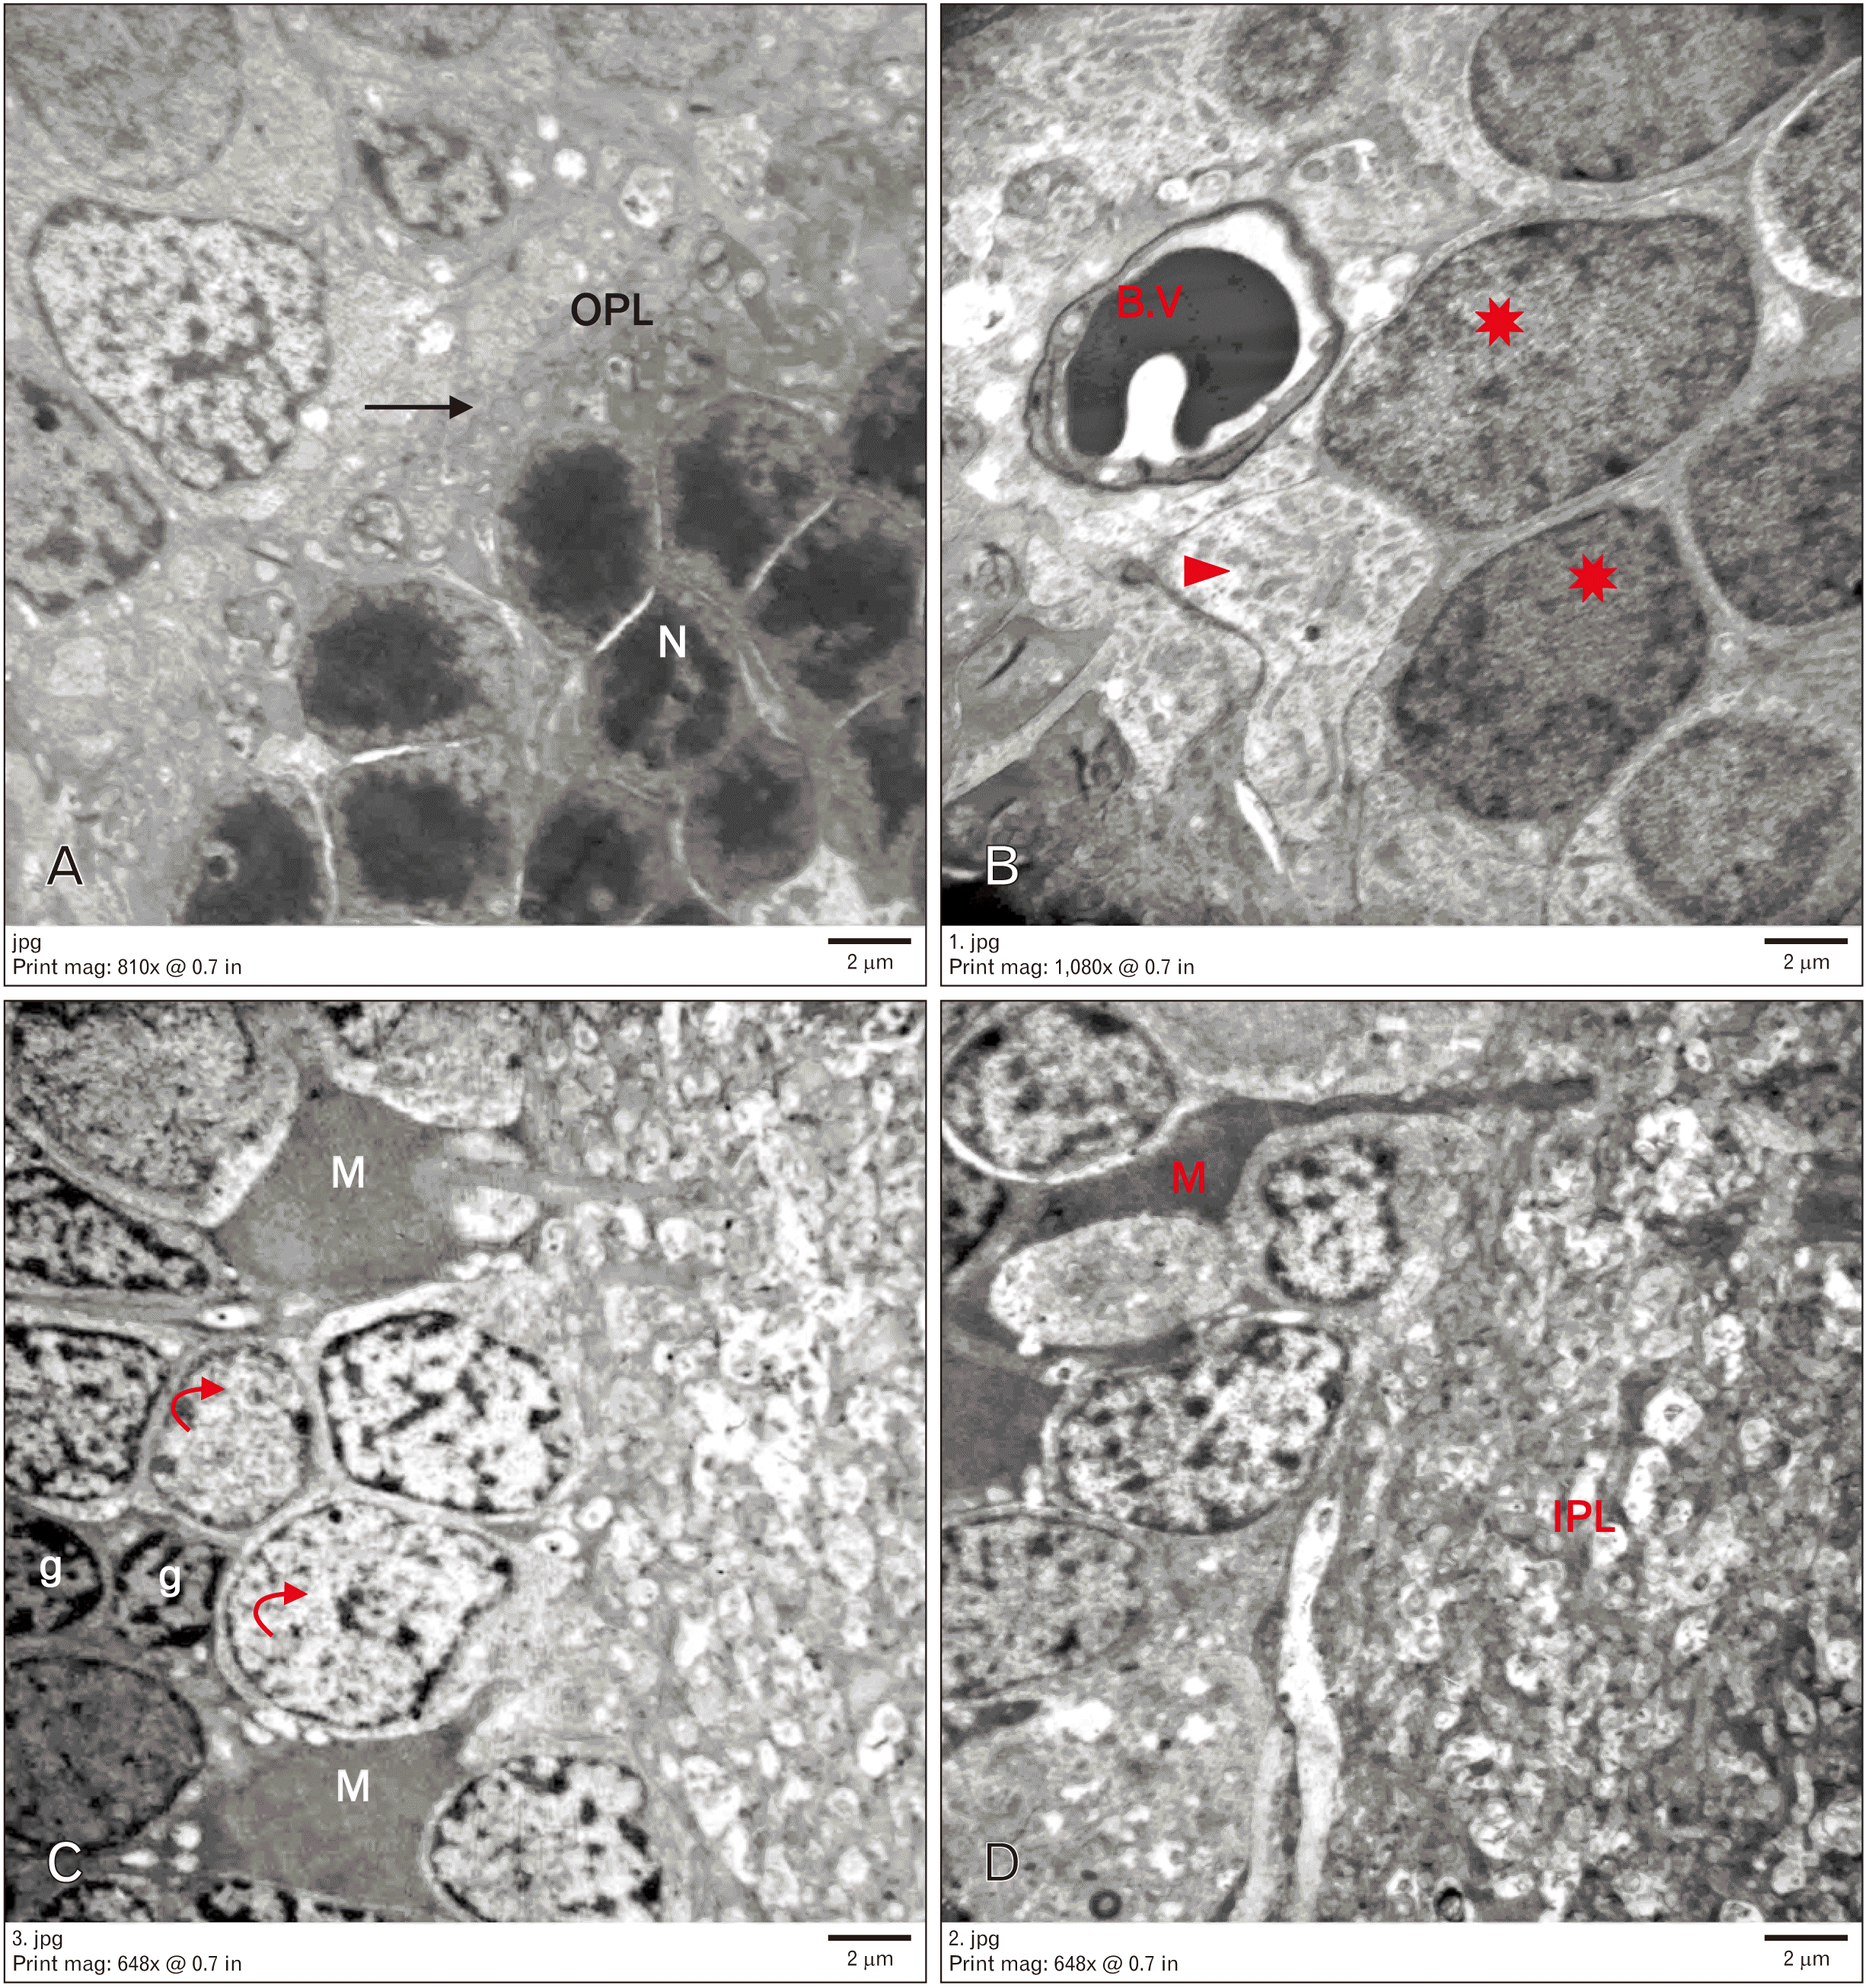
Comparable histological results were obtained in both control groups (Ia and Ib); thus, group Ia was chosen as the control group in the analysis of the results. The histological structure of retinal layers of the control group consisted of photoreceptor outer segment (POS), outer nuclear layers (ONL), outer plexiform layers (OPL), inner nuclear layers (INL), inner plexiform layers (IPL), and ganglion cell layers (GCL) (Fig. 1A, E).
Group II (T1DM) expressed an observable reduction in the thickness of all retinal layers. The ONL displayed fewer nuclei, most of which were dark. Furthermore, the nuclei of INLs were few and darker than those of the control and widely separated. The IPL showed widening of the spaces between nerve fibers. The GCL showed few cells with small nuclei. Some congested retinal blood vessels were observed (Fig. 1B, F). Similar retinal changes were noticed in group III (Fig. 1C, G). Group IV showed retinal layers with restored normal histological structure and thickness compared with groups II and III (Fig. 1D, H).
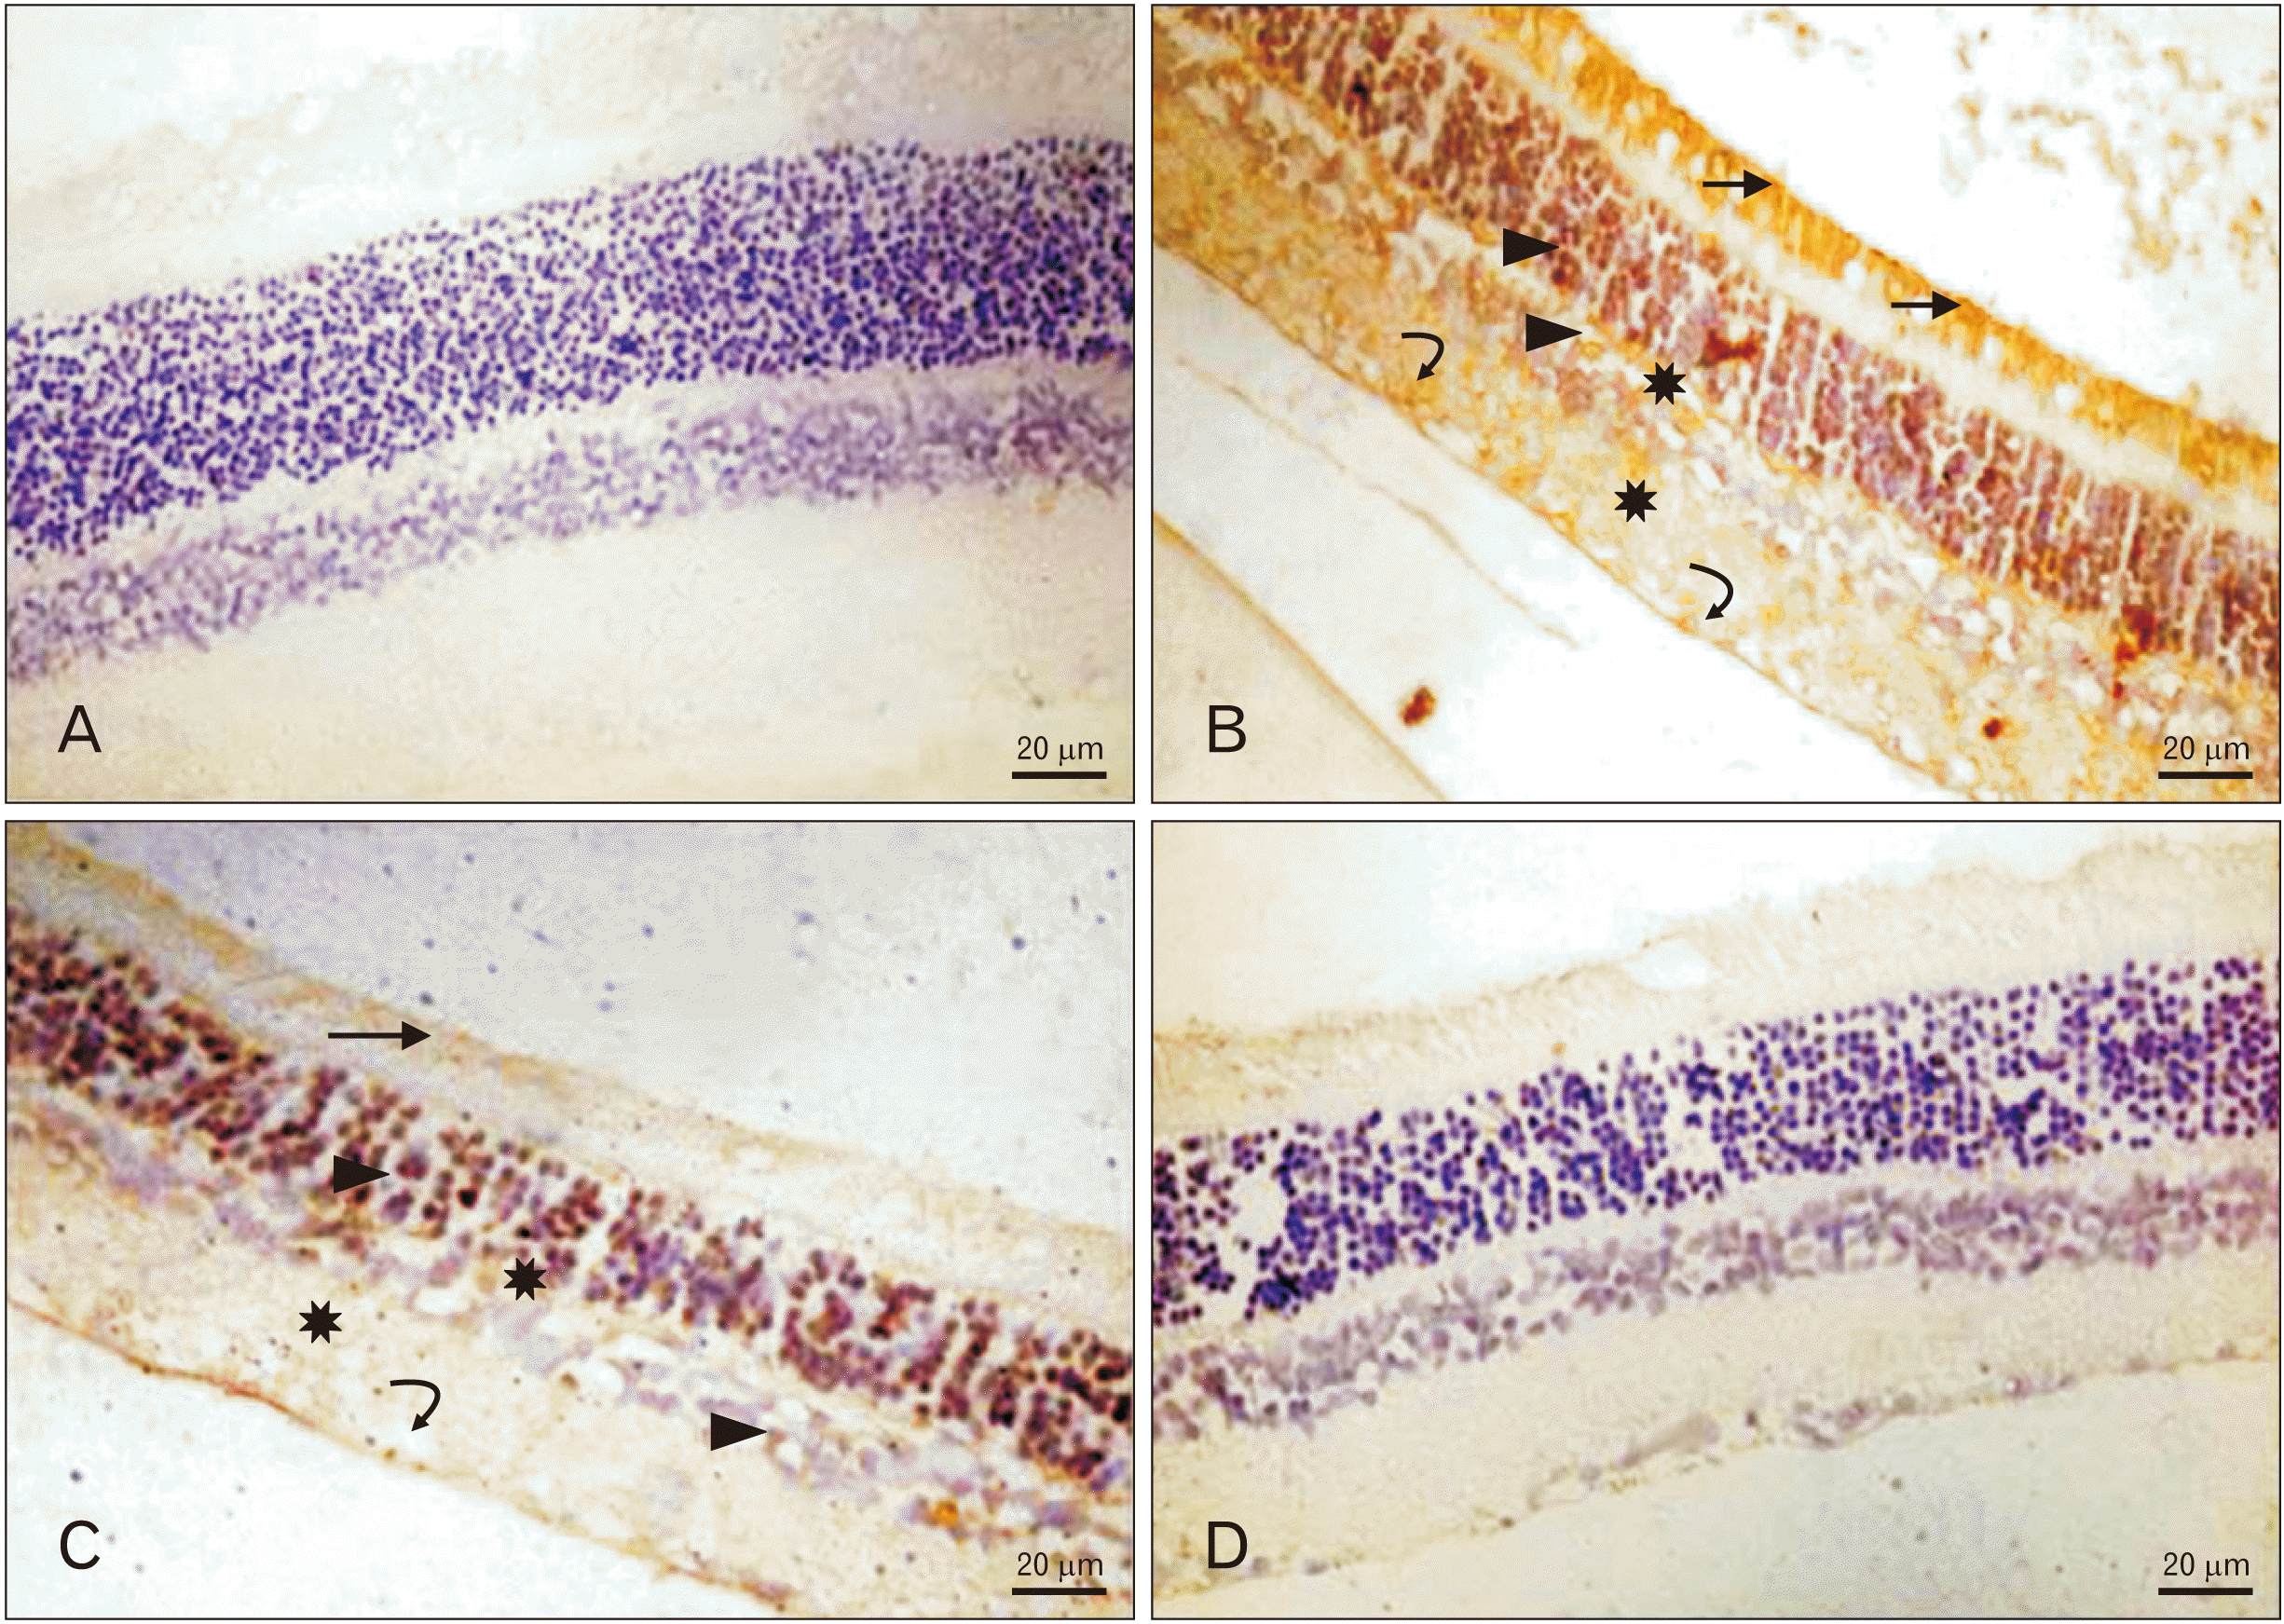
Immunohistochemical localization of AGEs
Immunoreactivity in all retinal layers was negative in groups Ia and IV, strongly positive in group II, and mildly positive in group III in which immunoreactivity was noticed in the ONL and inner limiting membrane (Fig. 2).
Ultrastructural results
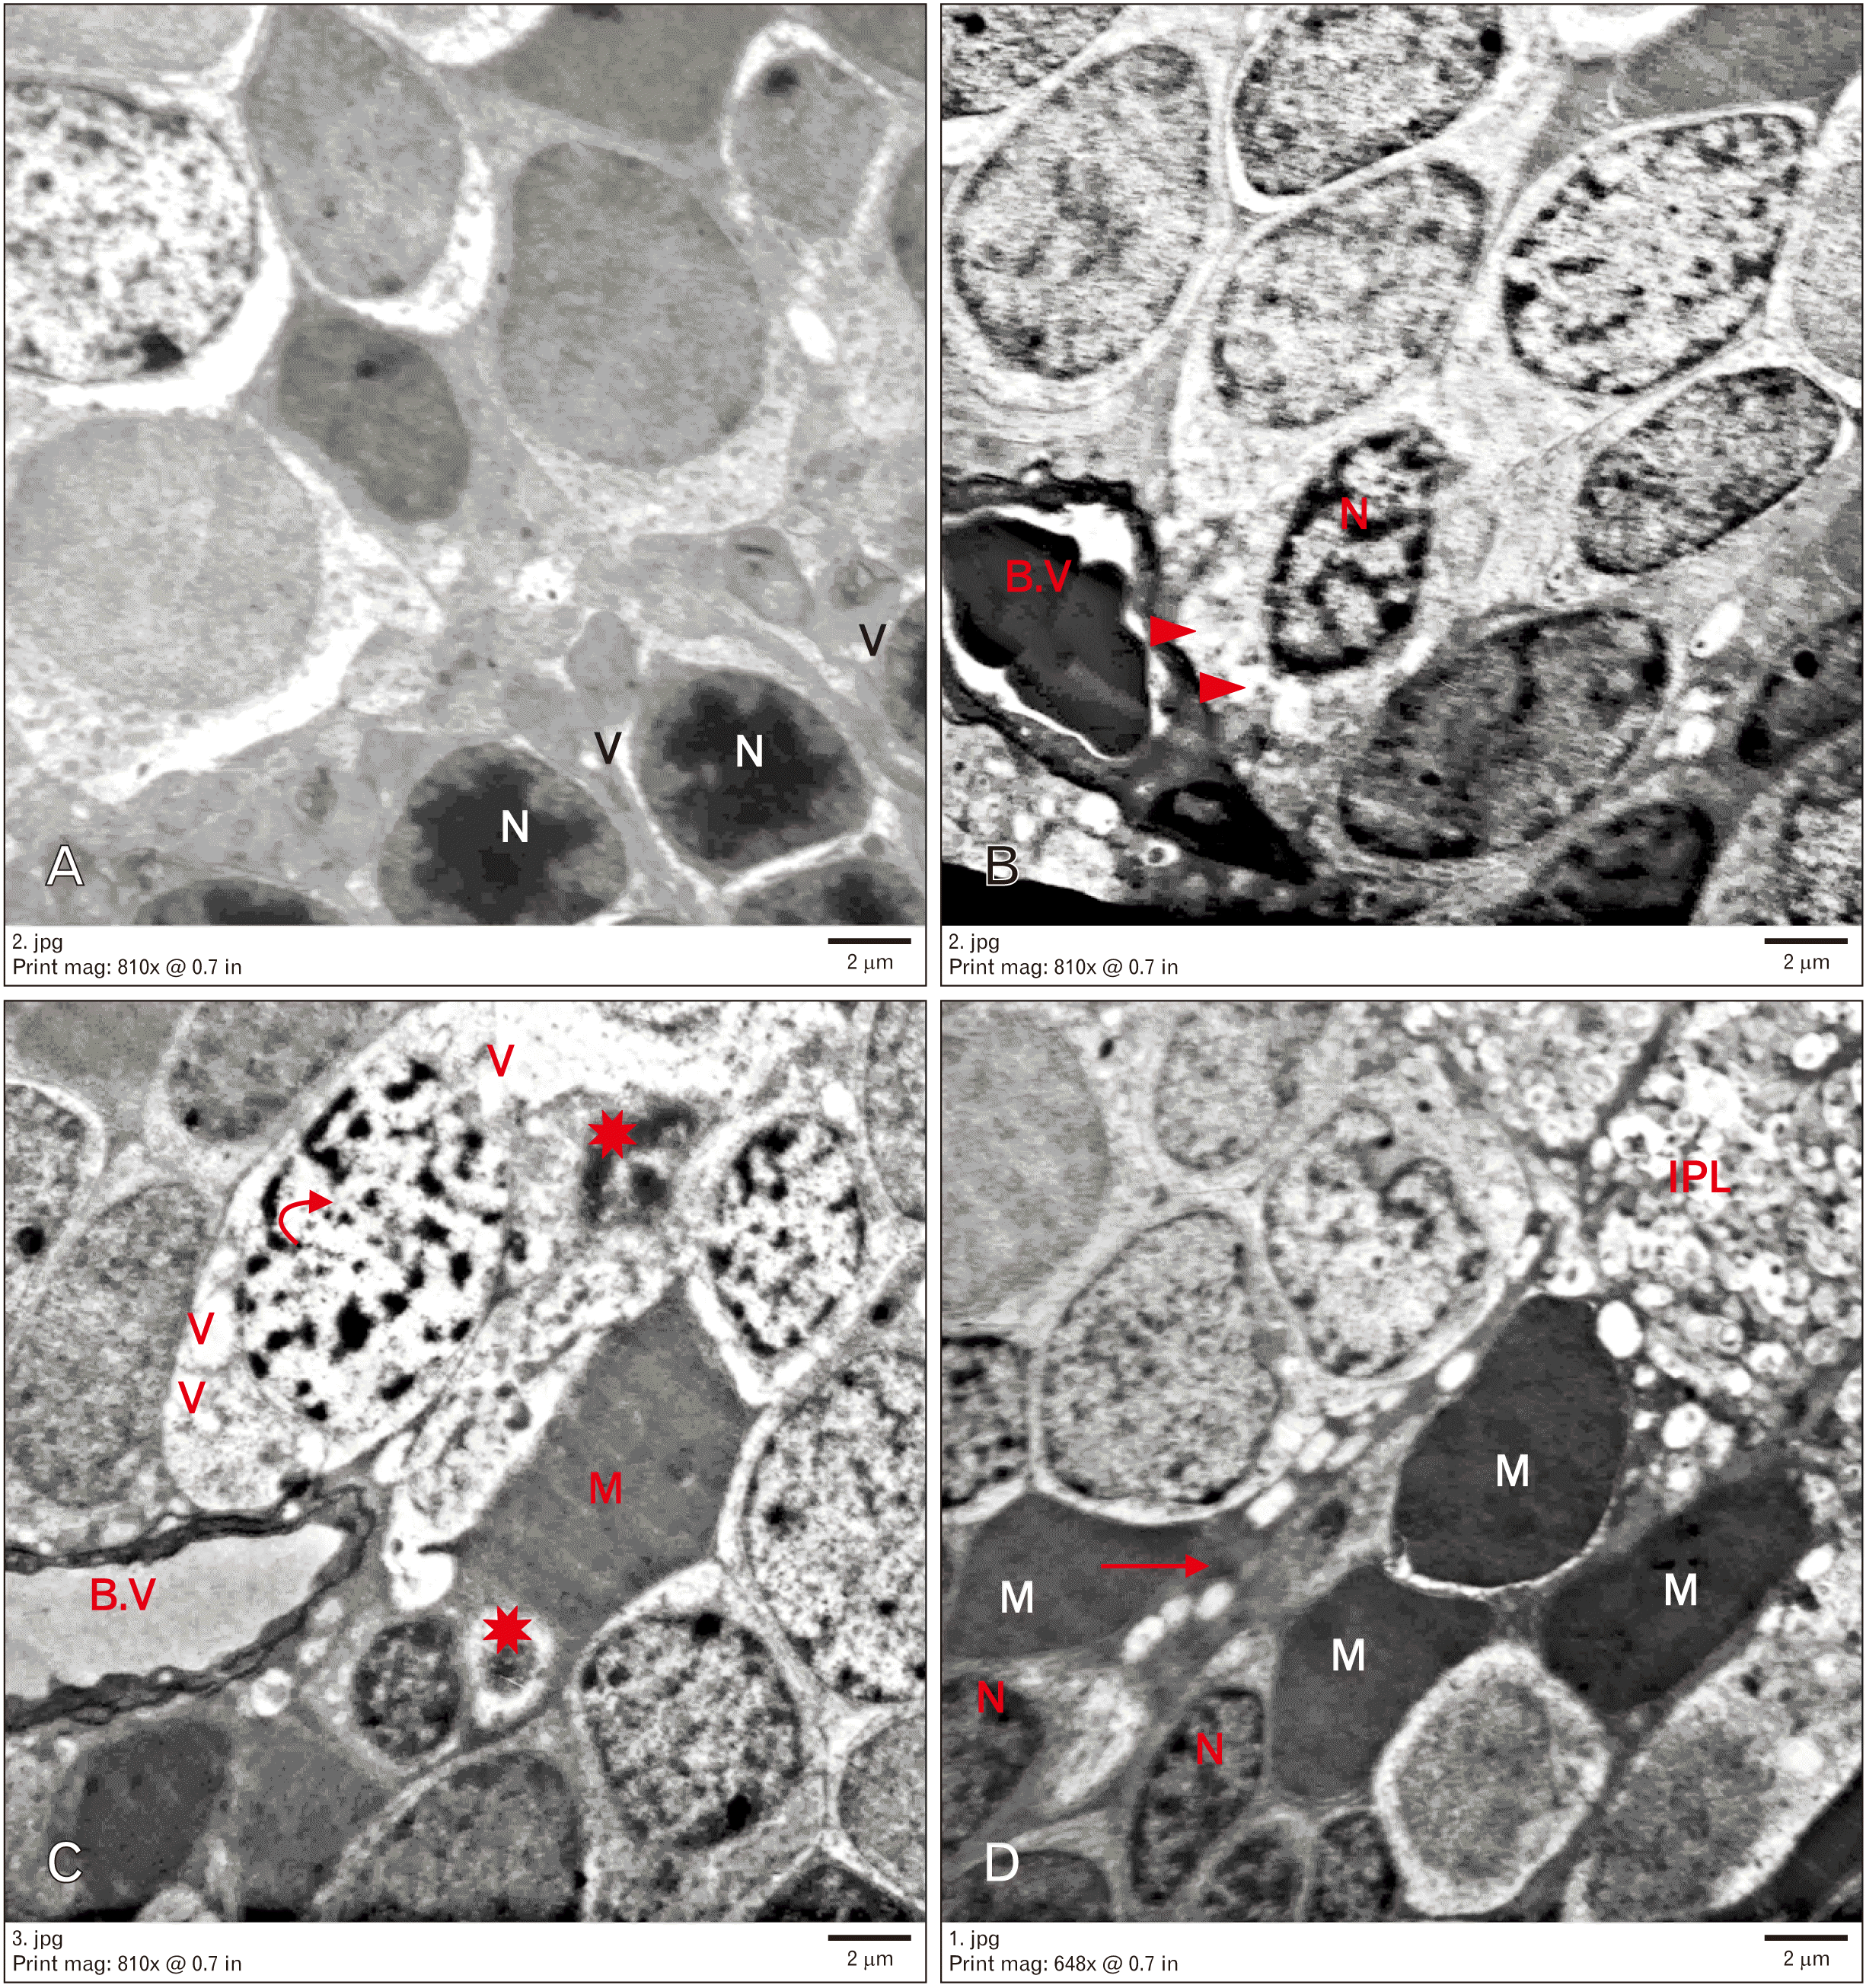
Electron microscopic examination of the control group revealed rod nuclei. They were small with highly condensed heterochromatin with a thin rim of cytoplasm around. The OPL appeared organized. The INL contained different neurons. The bipolar neurons showed large ovoid euchromatic nuclei with peripheral heterochromatin, few mitochondria, and few ribosomes. Müller cells showed oval electron-dense nuclei with abundant cytoplasmic processes. Amacrine cells were characterized by large indented nuclei. Retinal blood capillaries were noticed. The IPL seemed a thick layer of synaptic nerve fibers (Fig. 3).
Group II showed nuclei of rods widely separated and surrounded by vacuolated cytoplasm. The OPL appeared disorganized. Many neuronal alterations were found in the INL. Some neurons appeared degenerated with rarefied cytoplasm and dark nuclei. Other neurons seemed to have heterochromatic apoptotic nuclei. The cytoplasm of these cells contained irregular vacuoles. Neuronal nuclei with clumped chromatin were observed. Furthermore, dilated congested blood vessels with thick basement membrane were noted. Many Müller cells were electron dense with their processes migrated in between INL. Microglia with dense nuclei and IPL were also observed (Fig. 4).
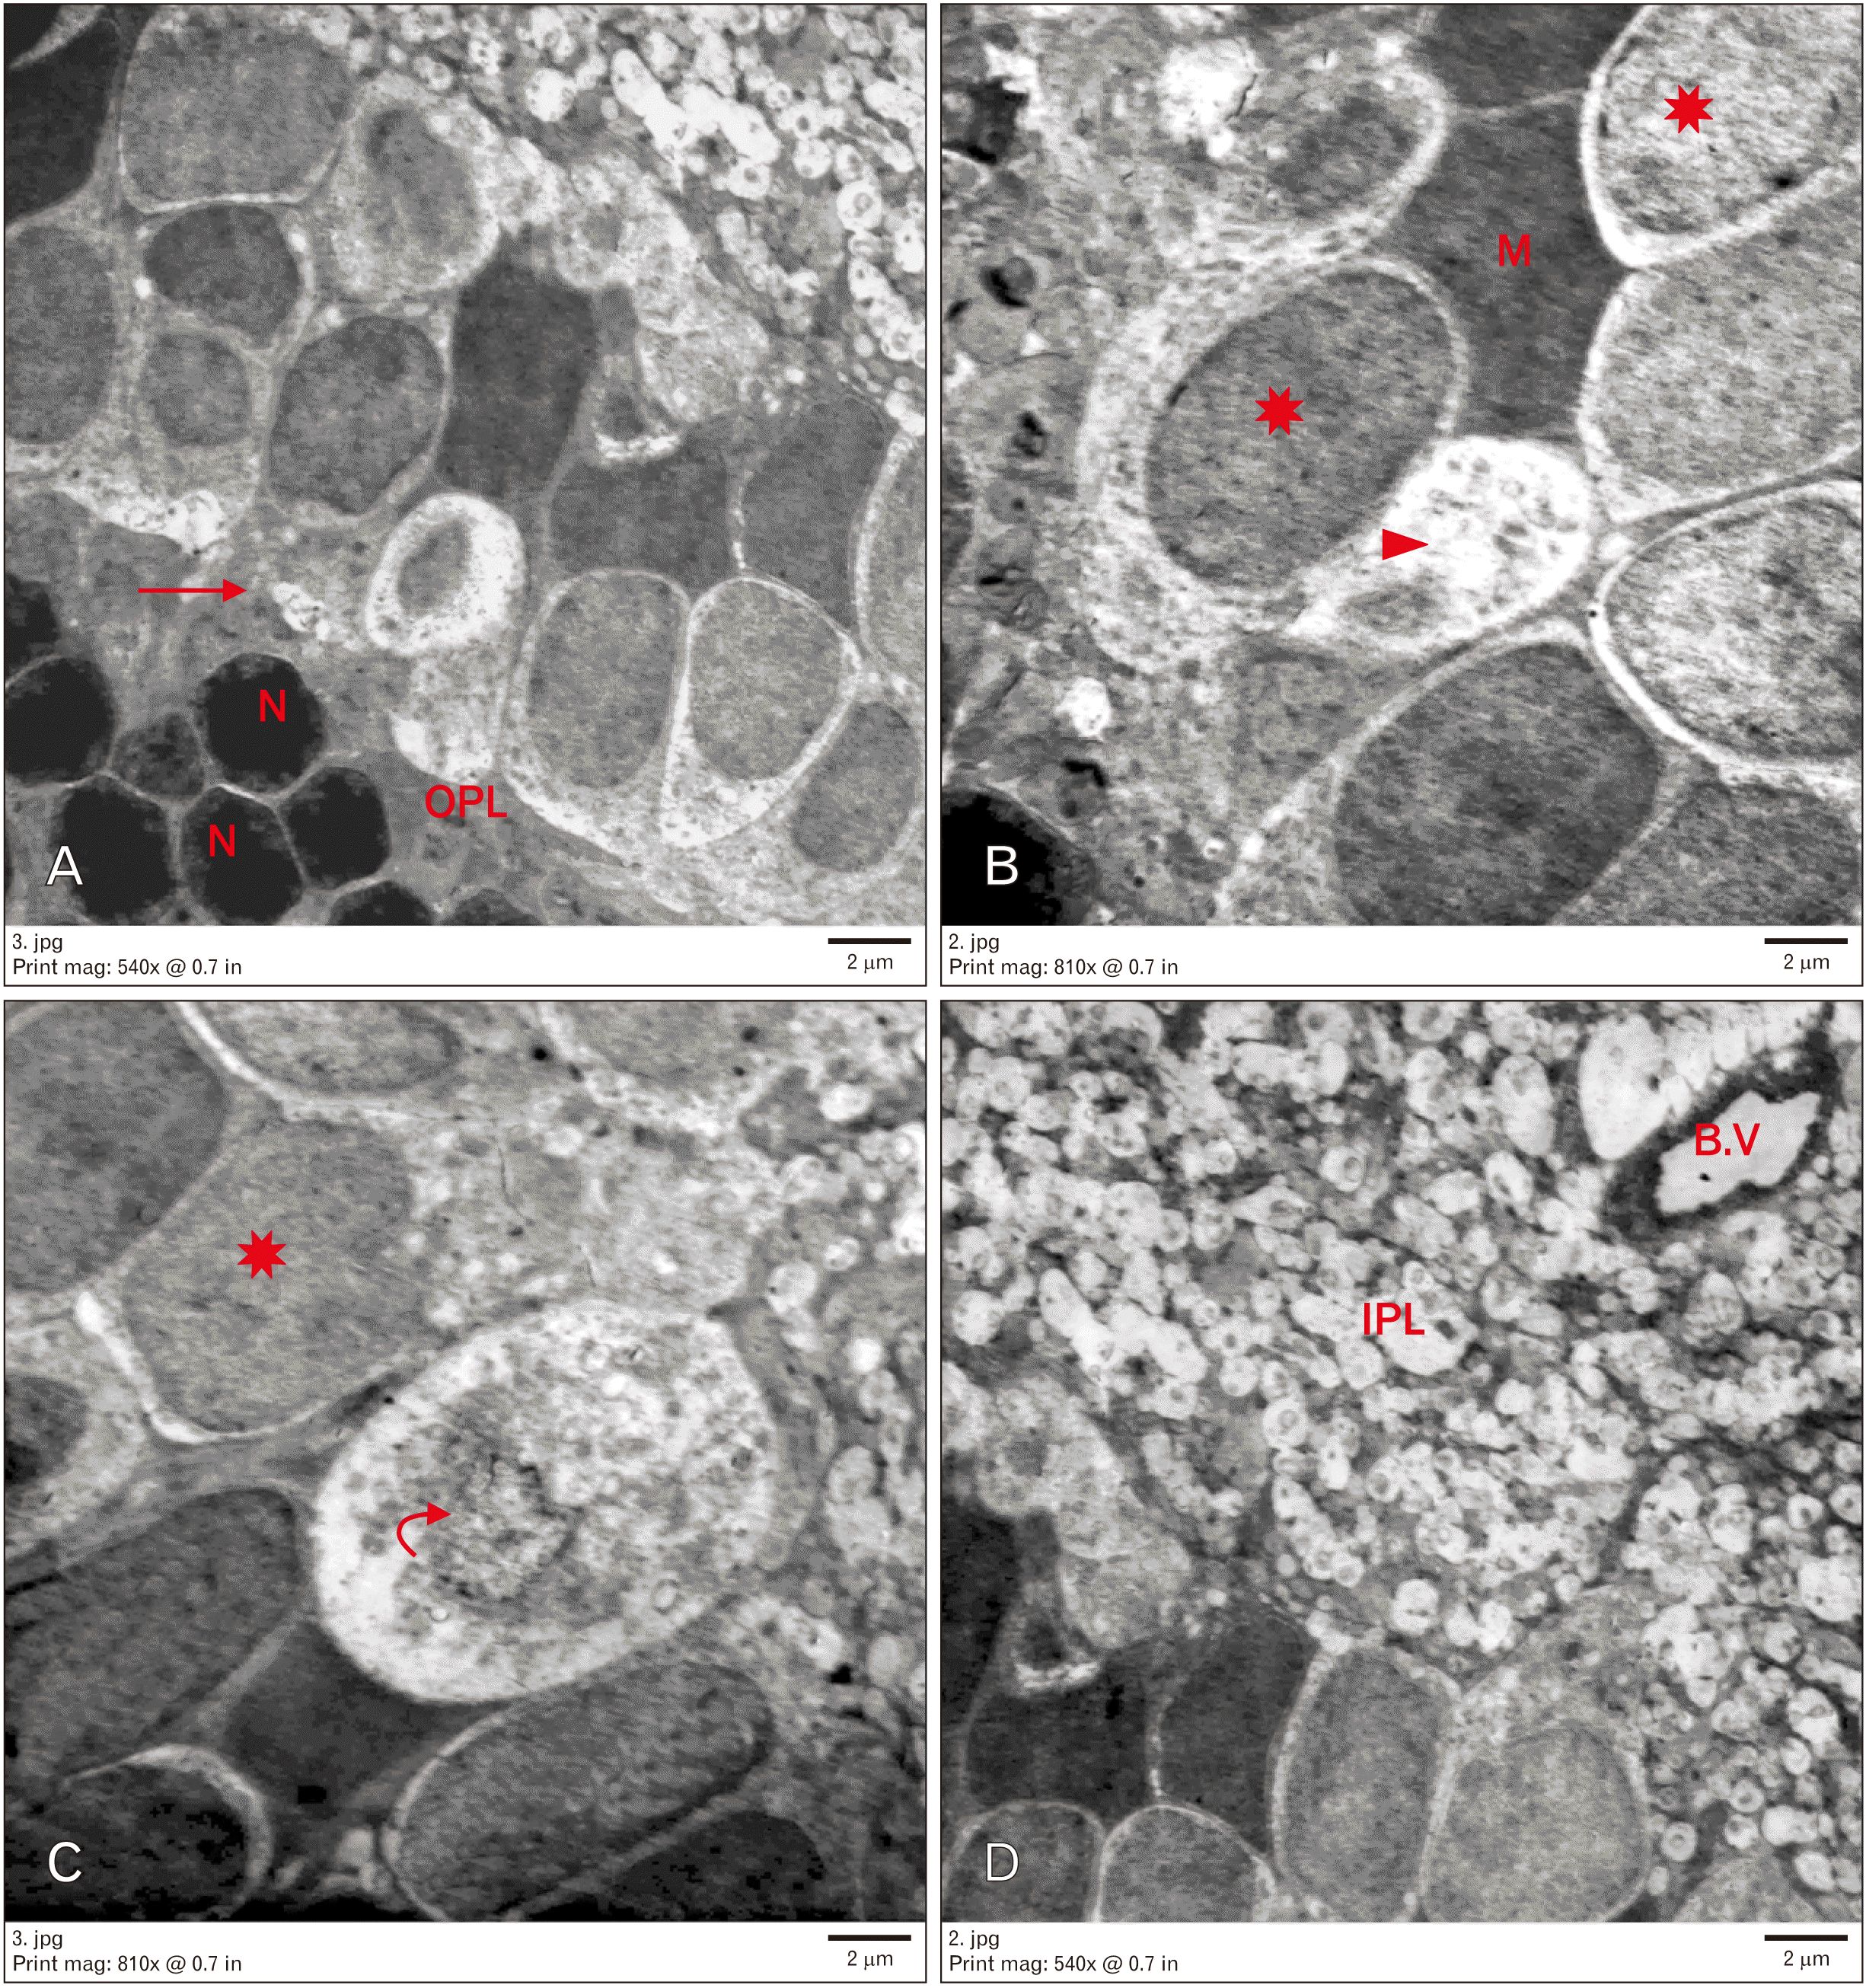
Group III showed rods with small electron-dense nuclei and a narrow OPL. Some neurons in the INL had rarefied vacuolated cytoplasm and nucleic remnants. Other cells appeared normal. Some blood vessels with normal diameter and intact basement membrane were observed. Furthermore, Müller cells were noted (Fig. 5).
Group IV revealed preserved ultrastructure of most retinal layers similar to that observed in the control group. The ONL contained electron-dense rod nuclei. The OPL appeared to have normal thickness and organization. Regarding the INL, many cells were found with electron-lucent cytoplasm and euchromatic nuclei, whereas others appeared to have heterochromatic nuclei. Furthermore, bipolar, amacrine, Müller, and microglial cells were noted. Many blood vessels appeared to have a normal basement membrane (Fig. 6).
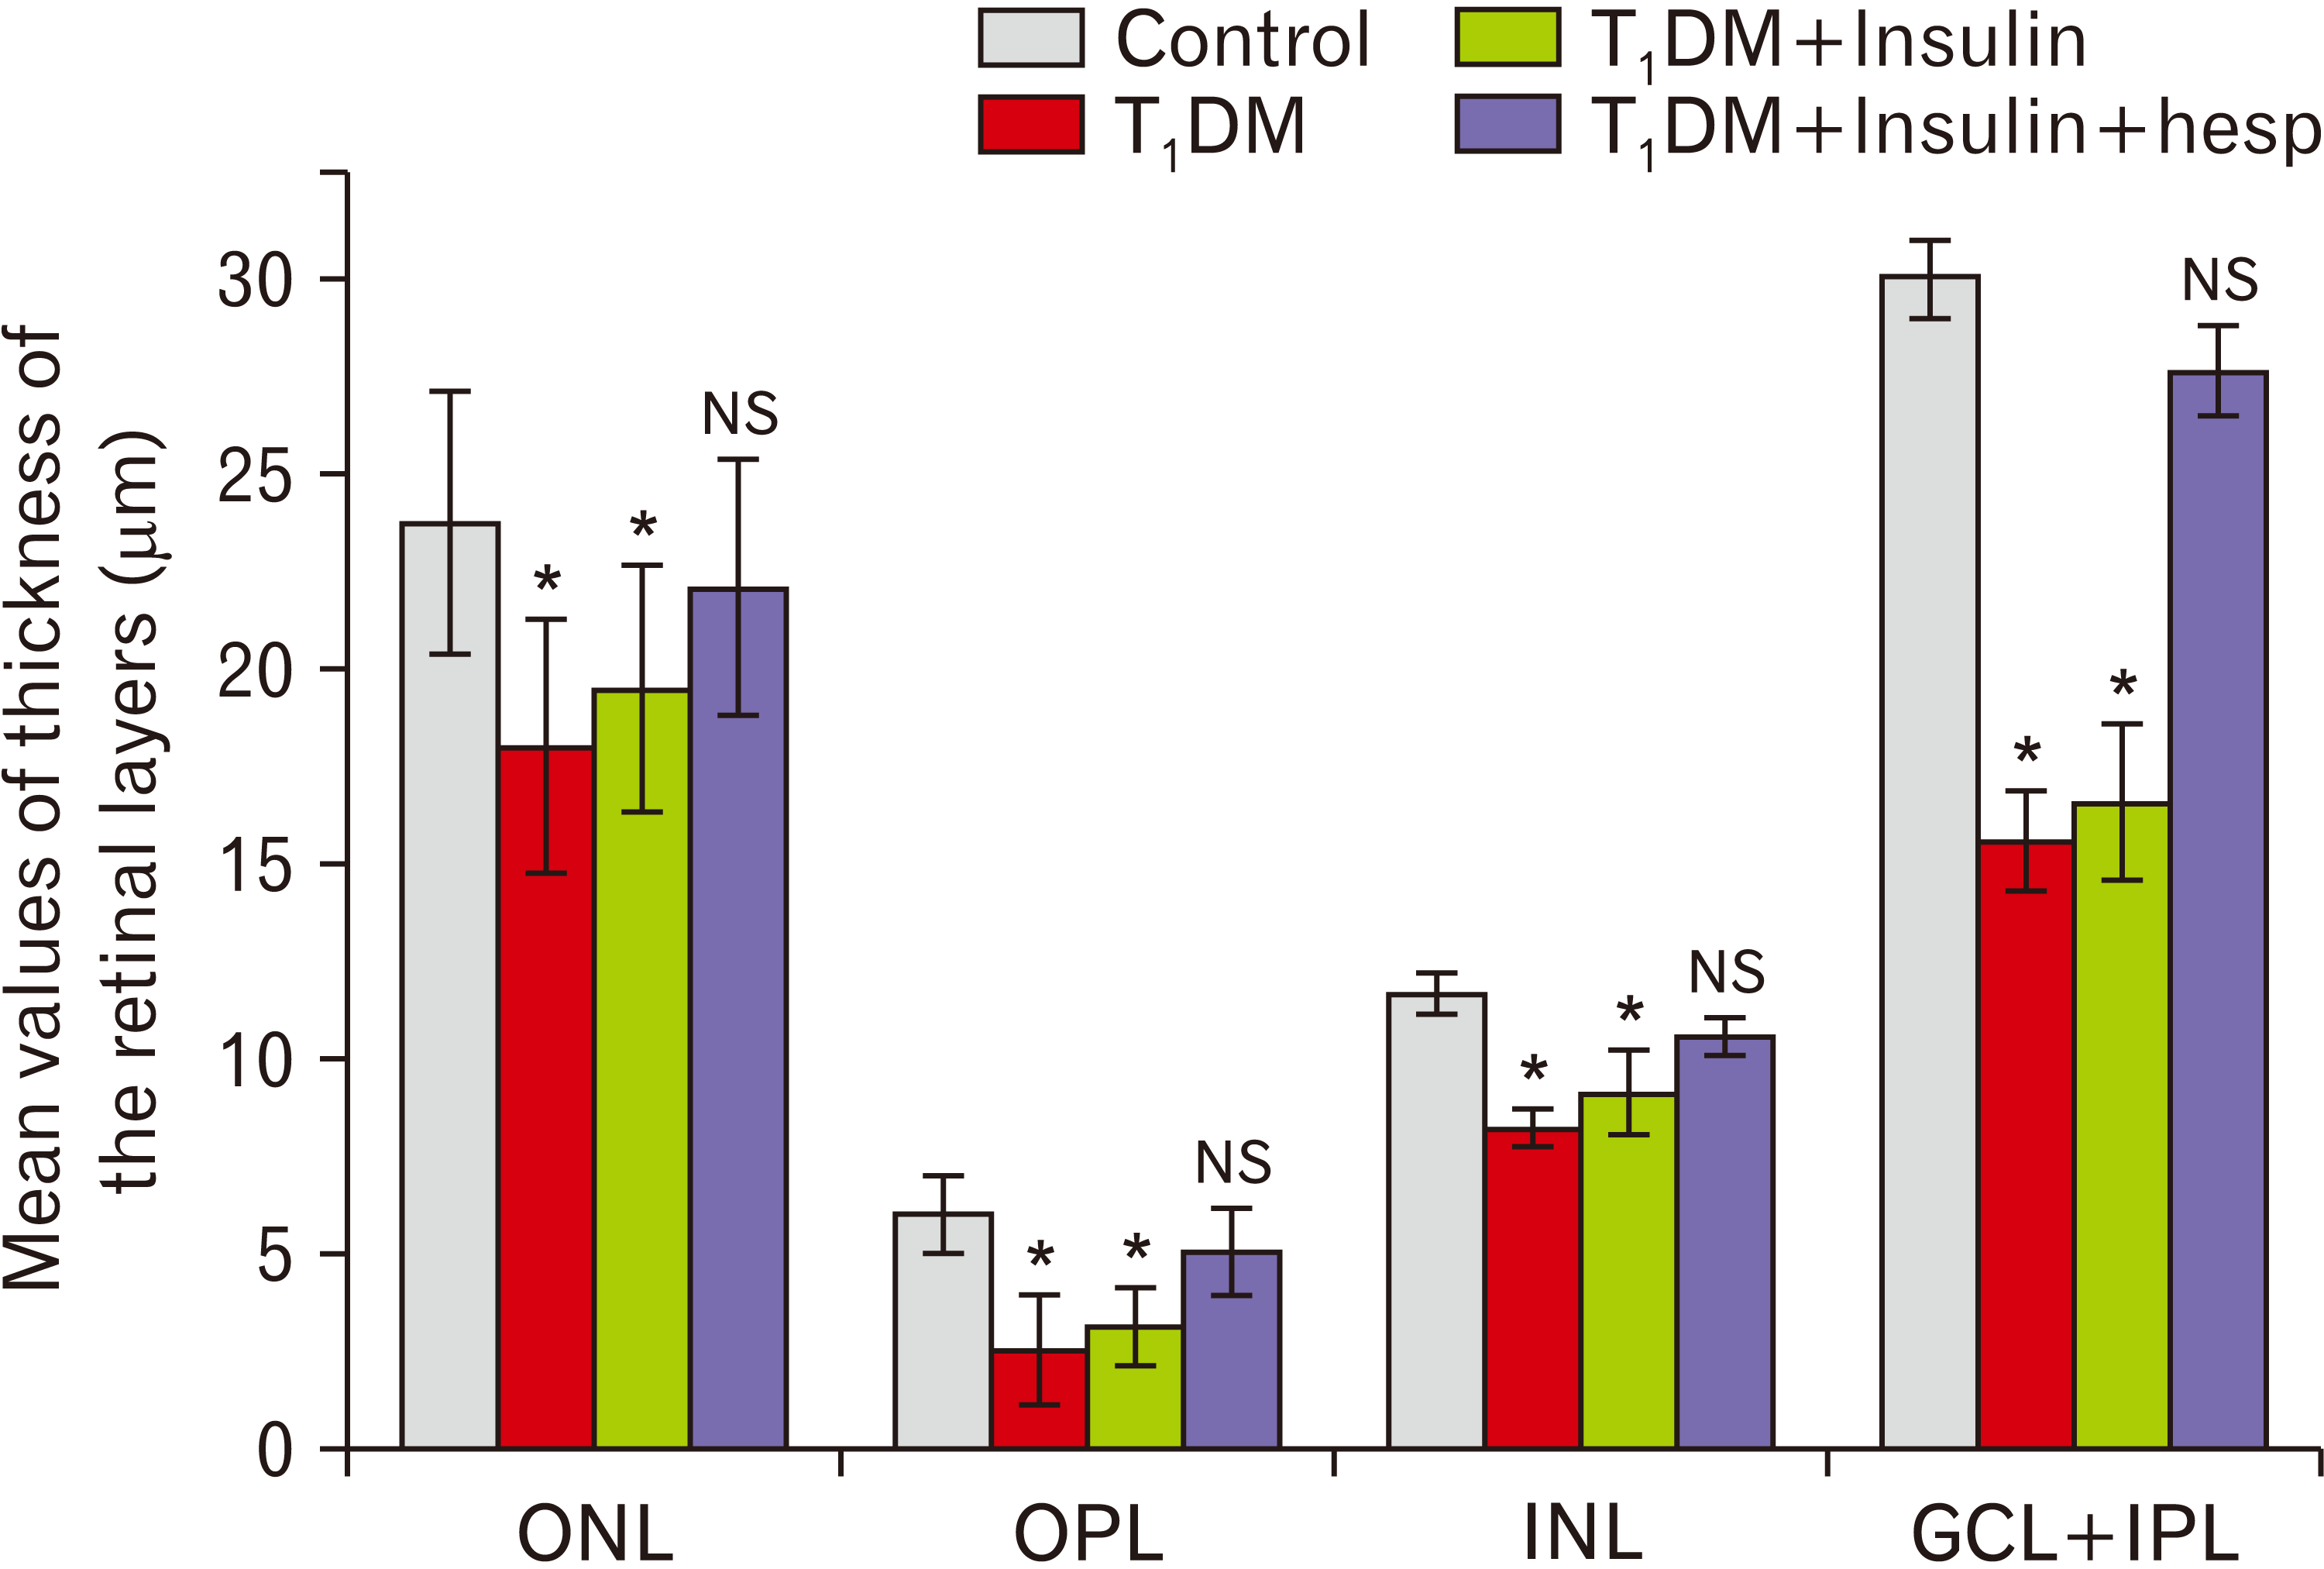
Morphometrical results
The differences in measurements between the two control subgroups were statistically insignificant. So, the records of group Ia were used as the control group in the statistical analysis. The thickness of all retinal layers was statistically decreased in groups II and III (P<0.05). A significant increase in the thickness of the retinal layers was observed in group IV (P<0.05) without a statistically significant difference between groups IV and I (Fig. 7). The area of AGE-positive immunostaining in group II was statistically larger than that in group I (P<0.05). The area of AGE-positive immunostaining in group IV was statistically smaller than that in group II (P<0.05). The difference in the area of AGE-positive immunostaining between groups III and II was statistically insignificant (Table 2).
Biochemical results
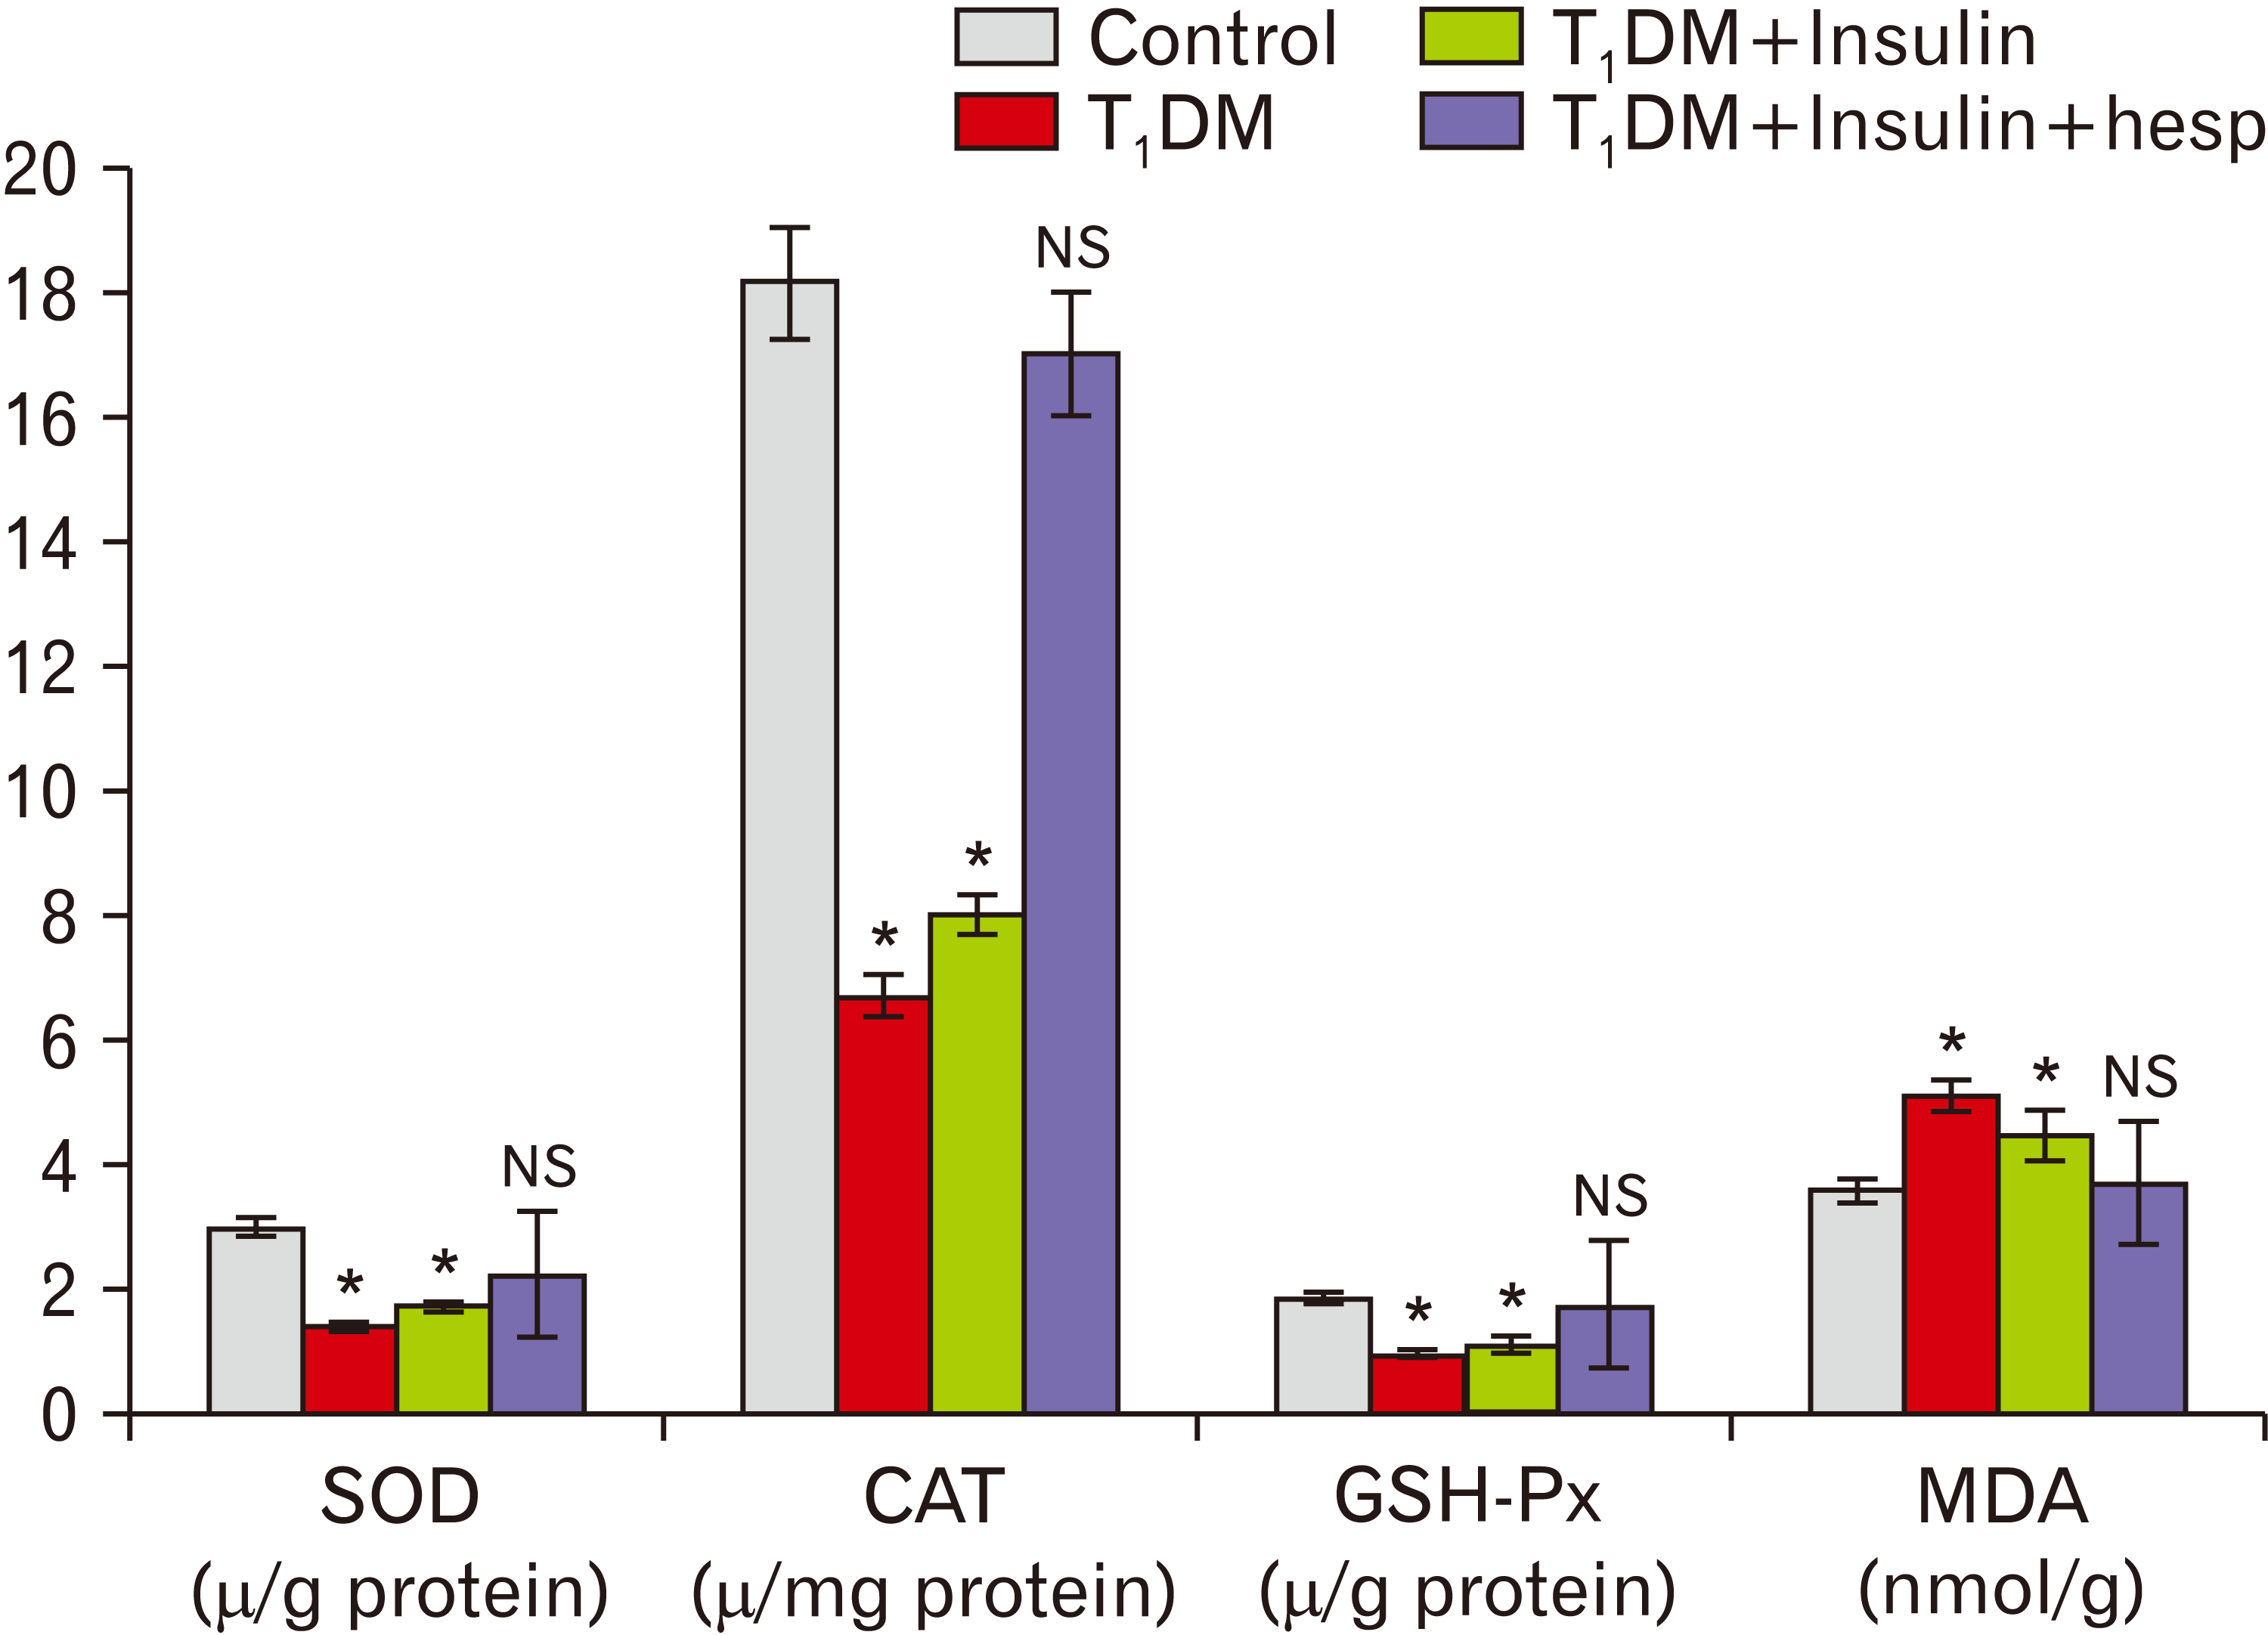
Serum glucose and oxidative stress markers
The injection of STZ increased the mean serum glucose level to 350.62±65.5 mg/dl (Table 2) and reduced the mean serum insulin level as matched to the control group (data not shown). These levels returned to control values in groups III and IV (Table 2). A statistically significant decrease in the levels of antioxidant enzymes (i.e., GSH-Px, SOD, and CAT) was observed in groups II and III compared with those in group I (P<0.05). However, a statistically significant increase in the levels of antioxidant enzymes was observed in group IV compared with those in group II (P<0.05). No significant difference in antioxidant levels was observed between groups II and III. MDA significantly increased in groups II and III compared with that in the control group (P<0.05). However, a significant reduction in MDA level was observed in group IV compared with that in group II (P<0.05). No significant difference in MDA level was observed between groups II and III (Fig. 8).
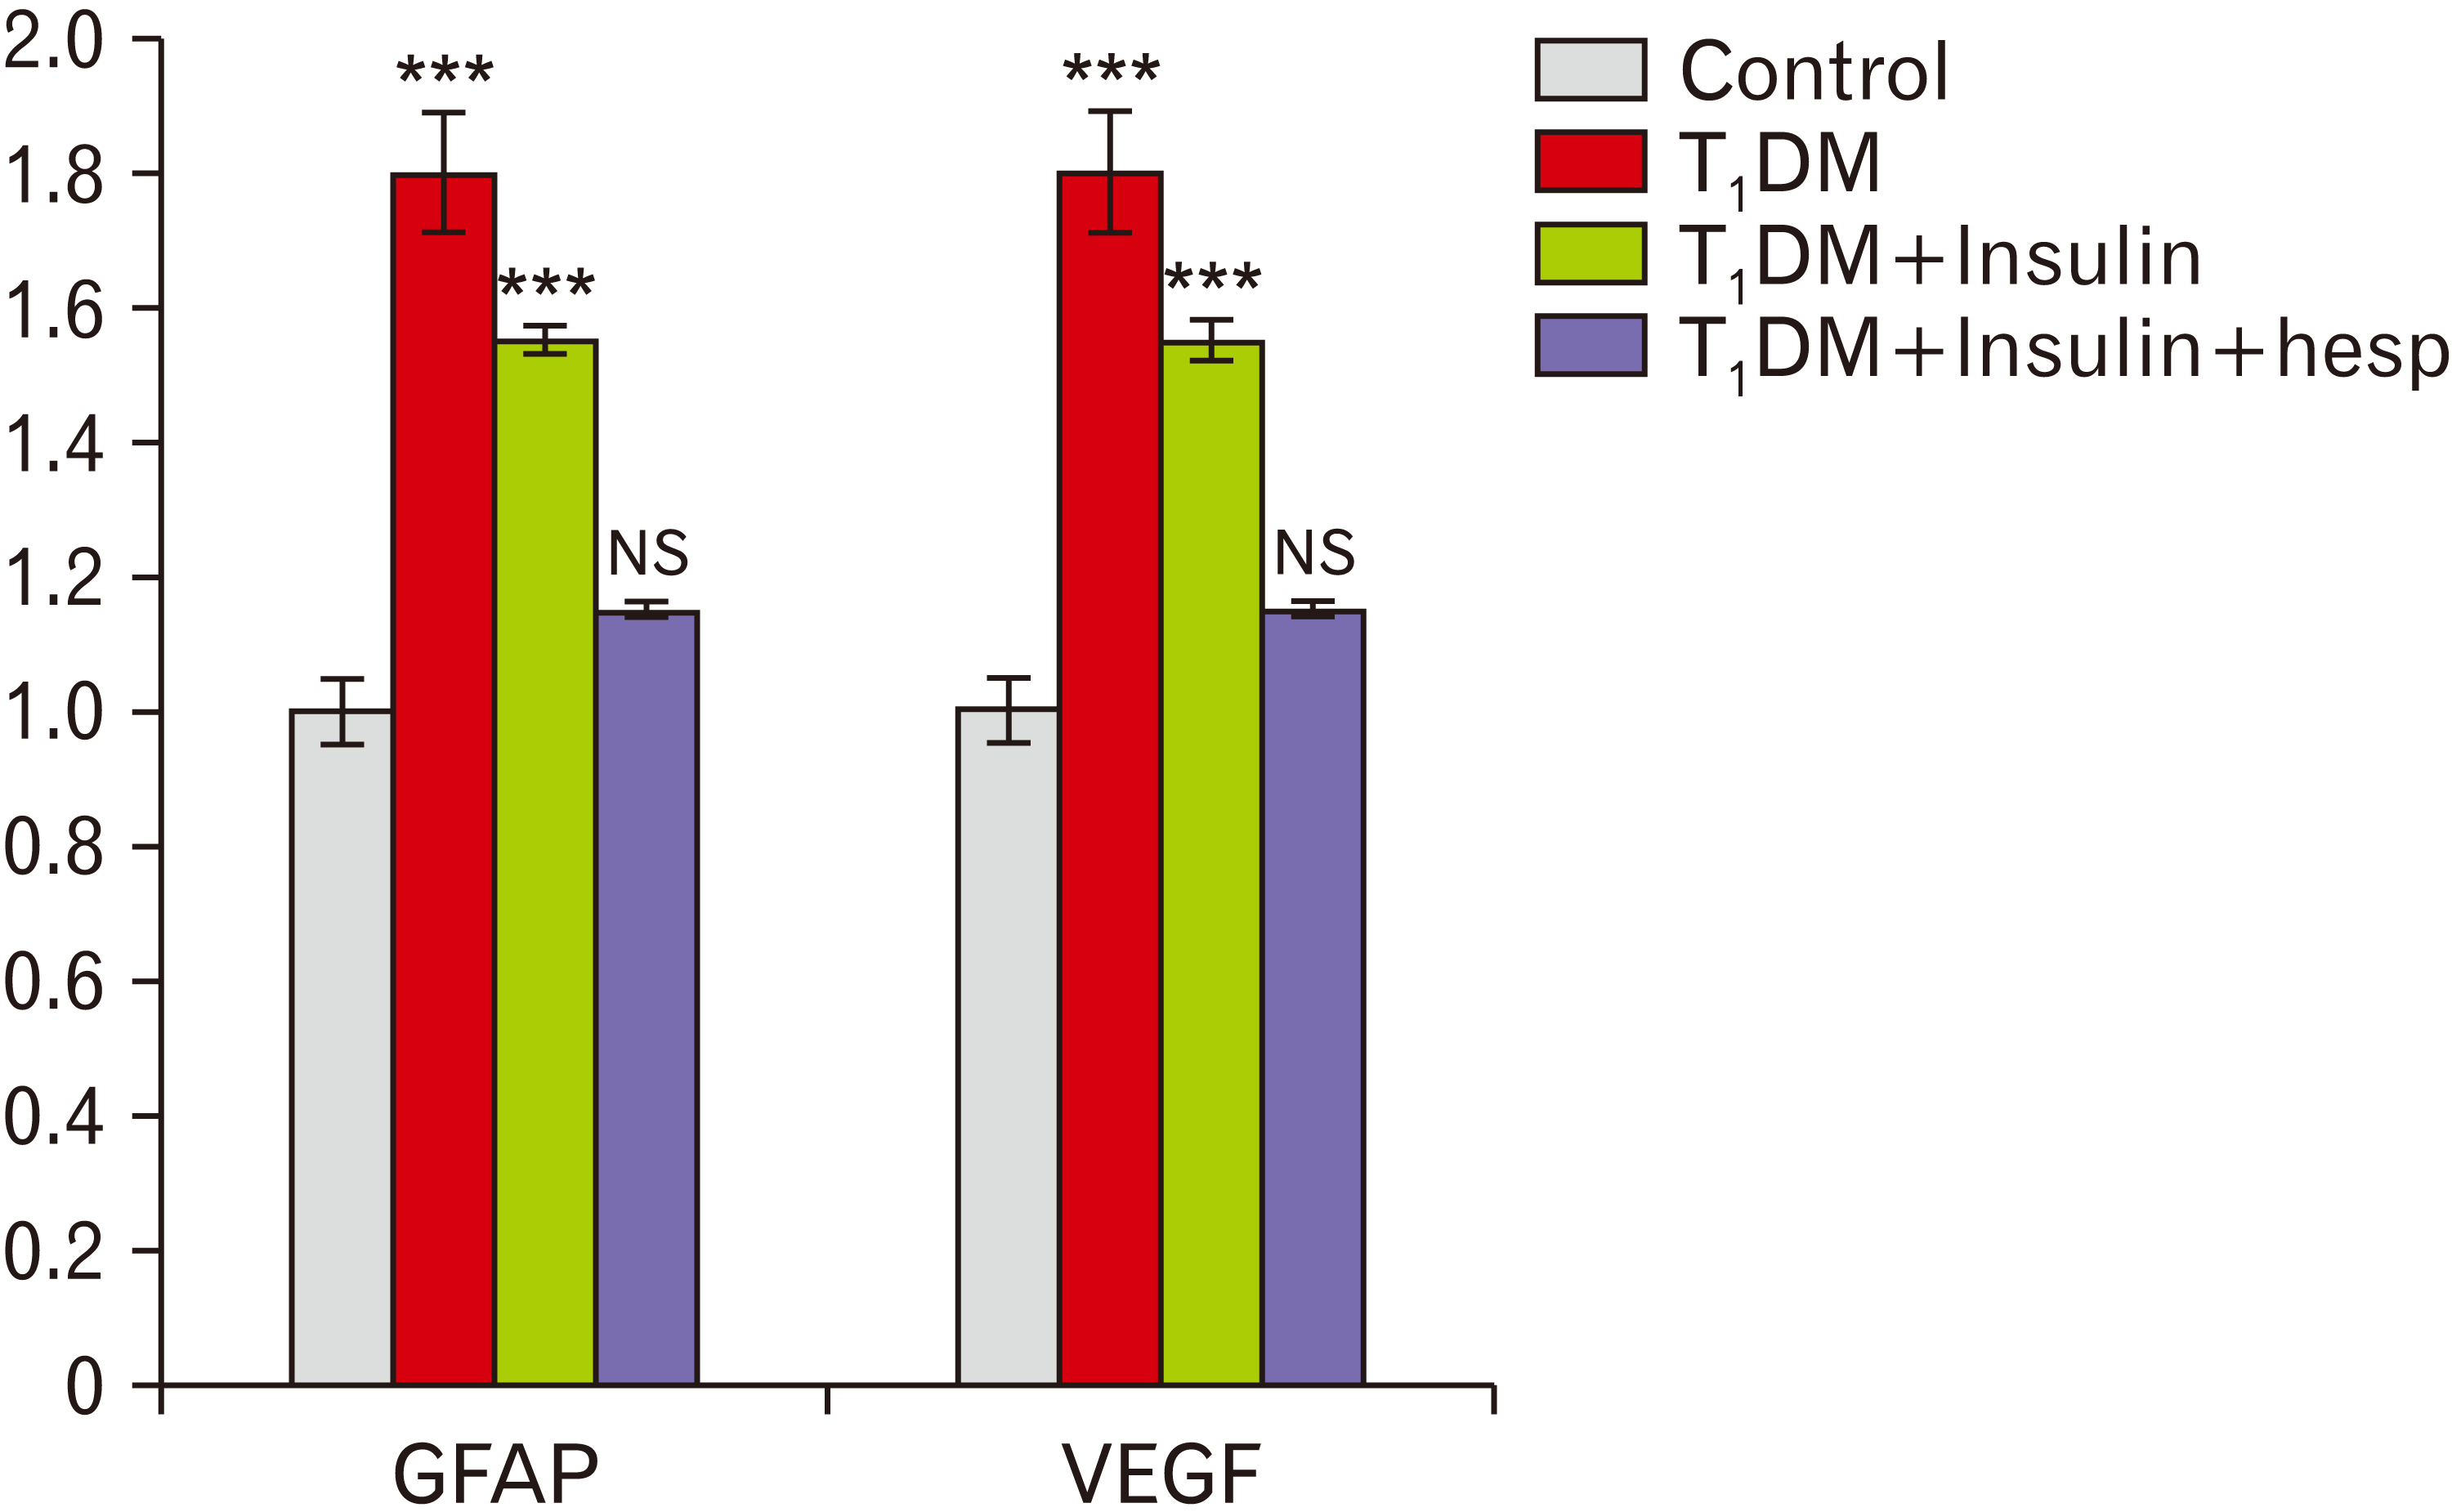
GFAP gene expression levels in rat retina
Retinal gene expression of GFAP was significantly increased in groups II and III compared with that in group I (P≤0.001). GFAP expression in group IV decreased to values similar to those in the control group I. However, insulin could not return GFAP expression to normal levels (Fig. 9).
VEGF gene expression levels in rat retina
Retinal gene expression of VEGF was significantly increased in groups II and III compared with that in group I (P≤0.001). Furthermore, a significant increase in VEGF gene expression was observed in group III compared with that in group IV (P≤0.001). VEGF gene expression in group IV decreased to a level similar to that in group I (Fig. 9).
Discussion
DR is an important substantial microvascular impediment of diabetes mellitus. All patients with diabetes are at risk of retinopathy; however, patients with T1DM are at a higher risk [25].
This study was designed to assess the probable ameliorative influence of hesp along with insulin compared with that of insulin alone on diabetic retinal changes in rats with T1DM.
STZ was used in this study as it is the most commonly used agent in animal models to induce biochemical and pathological changes simulating the onset of DR arising in humans [26].
Regarding positive control rats, hesp administration has no influence on retinal histological structure and biochemical markers (data were not shown). This finding conforms to the findings of Ali et al. [27]. Group II (T1DM) in this study exhibited several histological and ultrastructural retinal changes associated with hyperglycemia. Similar results were reported in published studies [28, 29]. Roy et al. [30] have clarified that DR is accompanied by mitochondrial dysfunction and endoplasmic reticulum stress. This study revealed a significant decrease in the thickness of different retinal layers compared with that in the control group. Such findings have been confirmed by morphometric analysis and conform to previous reports, which concluded increased apoptotic retinal neurons in rats with diabetes. The neuronal pathology of diabetic retinal changes is a sequence of oxidative stress [31]. In contrast, Toyoda et al. [32] have reported that long-term hyperglycemia causes retinal thickening due to the escape of blood constituents from retinal vessels.
Our biochemical results have shown an increase in oxidative levels and a decline in antioxidant enzymes. The imbalance between both oxidants and antioxidants is a significant cause of the initiation and progression of DR [33]. The retina is more susceptible to develop oxidative stress due to its high oxygen demands, the large amounts of polyunsaturated fatty acids in its structure, and the natural continuous light exposure [34].
This study revealed a significant increase in GFAP gene expression in group II, which was supported by the findings of previous studies [30, 35]. Hyperglycemia leads to the activation of Müller cells and subsequent gliosis so that GFAP overexpression can be measured as a retinal injury marker [36]. Some authors have correlated these changes to deficient neurotropic factors in DR, which could stop the degeneration of retinal photoreceptor cells and promote the axonal regeneration of ganglion cells [37].
The current results showed a significant increase in the level of VEGF in group II compared with that in the control group. VEGF is a proangiogenic factor regulator that damages the blood-retina barrier (BRB) by several mechanisms, leading to increased vascular permeability and the development of retinal edema. An imbalance between proangiogenic mediators and ischemia result in the growth of abnormal leaky blood vessels, eventually leading to retinal neovascularization [3, 38].
This study showed a significant rise in AGEs in group II. These results conform to those of Yamagishi et al. [39]. AGEs provoke pathogenic mechanisms, including diminished endothelial nitric oxide synthase (eNOS) activities, pericyte death, decreased nerve growth factor (NGF) and elevated expression of GFAP [40].
Examination of the retina of group III showed little improvement in ultrastructure and biochemical results. Furthermore, many neuronal alterations were found. These findings are inconsistent with those reported by Kuo et al. [41].
Group IV showed an almost normal retinal histological and ultrastructural picture with improvements in the biochemical results. This conforms to the findings of Xin et al. [42], who suggested that hesp plays a key role in inhibiting apoptosis in the retinae by decreasing both caspase-9 and caspase-3. Hesp has a stronger antioxidant activity than other flavanones [43]. Recent studies have shown that hesp could normalize hyperglycemia in rat models with STZ-induced diabetes by changing the action of glucose-moderating enzymes and decreasing lipid levels in both the serum and liver [11]. Furthermore, Liu et al. [44] have reported that hesp regains mitochondrial function by preventing the dissipation of membrane potential in the mitochondria and enhances the secretion of cytochrome c into cytosol. The therapeutic actions of hesp in the rescue of retinal neuroinflammation, oxidative stress, apoptosis, and edema have been clearly shown in the studies by Kumar et al. [45]. They have concluded that hesp can be useful for preventing neurovascular problems, such as DR. Moreover, hespsignificantly suppressed BRB damage in cases of DR [46]. Furthermore, hesp was suggested to increase ocular blood circulation, which leads to retinal function improvement through nitric oxide (NO) bioavailability enhancement [47].
In contrast, nitric oxide synthase‐2 (NOS‐2) was suggested to be the result of cell death by increasing oxidative stress via caspase activation and mitochondrial dysfunction [48].
Furthermore, this study revealed a significant decrease in AGE-positive immunoreactivity in all retinal layers in group IV. It has been suggested that hesp decreases the formation of AGE in vitro in animal trials [49]. Furthermore, it significantly decreases HbA1c levels, thus permitting its neuroprotective action [50]. The retina has a highly potent antioxidant defense system, including free radical scavengers, such as α-tocopherol, GSH, ascorbic acid, and antioxidant enzymes, such as GSH-Px, SOD, and CAT [51]. The rats with diabetes in this study showed reduced GSH levels and decreased activity of SOD and CAT compared with healthy rats. These variations in antioxidant parameters agree with previous studies [52, 53]. Hesp-treated retinae showed recovery of the antioxidant defense system to normal levels and the prohibition of retinal inflammatory transformations. Hesp being a flavanone provides a potent antioxidant action, which moderates the enzymatic activity efficiently [54, 55]. Similarly, in this study, a positive inflection of GSH and antioxidant enzymes was detected. Moreover, this study demonstrated the therapeutic qualifications of hesp in rescuing retinal oxidation and apoptosis as a result of uncontrolled diabetes mellitus.
In conclusion, it can be assumed that dietary flavonoids, such as hesp, can be combined with insulin for effectively inhibiting diabetes-associated neurovascular impediments, such as DR. Moreover, it supports the potential of hesp to inhibit receptor of AGEs (RAGE)-mediated cellular cascades causing improved retinal changes, including angiogenesis, hypoxia, and cellular apoptosis, in animal models with STZ-induced diabetes.

 XML Download