Journal List > Int J Thyroidol > v.14(2) > 1148542

Jeong, Lee, Kim, Lee, Park, Kim, Lee, and Jo: Cooperative Subtype Switch of Thyroid Hormone Receptor and Nuclear Receptor Corepressor Related Epithelial–Mesenchymal Transition in Papillary Thyroid Cancer

Abstract

Background and Objectives

Although thyroid hormones affect human cancer progression, the regulatory mechanism of thyroid hormone receptors in carcinogenesis has not been elucidated. This study aimed to evaluate the expression pattern of the thyroid hormone receptor (TR) and its corepressors, and to investigate the clinical and biological functions of TR.

Materials and Methods

Transcriptomic and clinical data for thyroid cancer were downloaded from The Cancer Genome Atlas. Paraffin-embedded tissue sections from patients who underwent thyroidectomy were used for immunohistochemistry. BCPAP cells were treated with T3 to investigate the thyroid hormone target genes. Thyroid hormone receptor alpha (THRA) and Thyroid hormone receptor beta (THRB) were knocked down by transient siRNA transfection.

Results

THRA and THRB expression was lower in thyroid cancer tissues than in normal tissues. However, strong focal staining of TRβ was observed in the invasive front. High THRB expression was associated with high Silencing Mediator for Retinoid or Thyroid hormone receptor (SMRT) expression, older age, a high MACIS (distant Metastasis, patient Age, Completeness of resection, local Invasion, and tumor Size) score, more aggressive histological subtypes, more frequent extra-thyroidal extension, and advanced TNM stage. THRB expression was positively correlated with Hypoxia Inducible Factor 1 Subunit Alpha (HIF1A), L1 Cell Adhesion Molecule (L1CAM), and Lysyl Oxidase (LOX) expression. Thyroid hormone-induced HIF1A, L1CAM, and LOX upregulation was abolished by siTHRB but not siTHRA in BCPAP cells. High SMRT and high THRB groups (SMRT/THRB) presented more aggressive clinical features and showed an upregulation of HIF1A, L1CAM, and LOX, as well as of epithelial-mesenchymal transition (EMT)-related genes, causing changes in the tumor microenvironment.

Conclusion

Cooperative subtype switching from NCOR1/THRA to SMRT/THRB was thus related to aggressive clinical and molecular features, possibly related to EMT and EMT-related tumor microenvironment.

Introduction

The thyroid hormone receptor (TR) is a representative type of nuclear receptor (NR) activated by thyroid hormone (TH).1) TR functions as a transcription factor affecting gene transcription in nearly every cell in the body for cell type-specific target genes.2) TR has two representative classes, TR alpha and beta (TRα and TRβ, respectively).3) These subtypes are differently distributed in the body. For example, TRα (THRA) is mainly localized in cardiac and skeletal muscle, brown fat, and bone, whereas TRβ (THRB) is widely expressed in the brain, liver, and kidney. TRβ2, an isoform of TRβ, is highly expressed in the hypothalamus and pituitary glands.4)
The nuclear receptor co-repressor 1 (NCOR1; Thyroid Hormone and Retinoic Acid Receptor-Associated Corepressor 1 [TRAC-1]) encoded by NCOR1, is a transcriptional co-repressor with several nuclear receptor interacting domains.5-7) The nuclear receptor co-repressor 2 (NCOR2), also referred to as a silencing mediator for retinoid or thyroid-hormone receptors (SMRT) or TRAC-1, is a member of the NCOR1 family and is also a transcriptional coregulatory protein, assisting nuclear receptors in the downregulation of target gene expression. As their names imply, NOCR1 and SMRT are known to play an important role in the functioning of TR and TH.8)
The relationship between thyroid dysfunction and cancer incidence has been investigated recently. Some investigators have reported that thyroid dysfunction is associated with an increased risk of thyroid, breast, and prostate cancers.9) However, phenome- wide association analysis from the UK Biobank indicated that a polygenic score for higher TSH levels is associated with a reduced risk of thyroid cancer.10) A two-sample Mendelian randomization study provided evidence of a causal association between thyroid dysfunction and estrogen receptor-positive breast cancer risk.11) The physiological function and regulatory mechanism of TR and its repressor have been extensively investigated. Further, the causal relationship between thyroid dysfunction and cancer risk has been recently elucidated. However, the molecular biological aspects of TH and TR in tumors require further exploration.
In this study, thyroid cancer (THCA) data from The Cancer Genome Atlas (TCGA)12,13) were used to investigate the gene expression status of TR subtypes and their repressors (NCOR1/SMRT).

Materials and Methods

Analysis of Public Repository Data

The mRNA expression values (transcripts per million [TPM]) and clinical information of 505 patients with THCA were downloaded from TCGA (https://tcga-data.nci.nih.gov/tcga/).12) We evaluated the stromal, immune, and ESTIMATE scores of TCGA THCA from the Estimation of STromal and Immune cells in MAlignant Tumours using Expression data (ESTIMATE) (https://bioinformatics.mdanderson.org/estimate/).14)

Immunohistochemical (IHC) Staining

The immunohistochemical staining on paraffin-embedded tissue sections (IHC-P) was performed using cancer tissue from a patient who underwent thyroidectomy from April to October 2010, at the Yonsei Cancer Center (Seoul, Korea). The sections were stained with TRα (PA1-211A, Invitrogen, Waltham, MA, USA) and TRβ (sc-737, Santa Cruz Biotechnology, Dallas, TX, USA) antibodies according to the manufacturer’s recommendations. Stained slides were scanned with an Aperio Scanscope AT Turbo system and Imagescope software was used for analysis (Aperio Technologies, Vista, CA, USA). The research protocol was approved by the Yonsei University Cancer Center Institutional Review Committee, and the prior consent requirement was exempted due to the nature of the study.

Cell Culture and Reagents

BCPAP, a human papillary thyroid carcinoma cell line, was cultured in RPMI1640 (Hyclone, Logan, UT, USA) supplemented with 10% fetal bovine serum, 1% penicillin and streptomycin (Life Technologies, Carlsbad, CA, USA). Cells were maintained in a humidified atmosphere with 5% CO2 and 95% air at 37°C. T3 (3,3,5-Triiodo-L-thyronine sodium salt, T6397) was purchased from Sigma-Aldrich (Ann Arbor, MI, USA).

Short Interfering RNA (siRNA) Transfection

To knockdown the endogenous THRA and THRB expression, cells were transiently transfected with 10 μM of chemically synthesized siRNAs (THRA, s14116; THRB, 3918; Thermo Fisher Scientific Inc., Waltham, MA, USA) targeting THRA and THRB, respectively, or with non-silencing control siRNA, using the RNAiMAX transfection reagent (Invitrogen, Carlsbad, CA, USA) according to the manufacturer’s protocol. All experiments were performed in duplicate and were repeated at least thrice.

RNA Isolation and Real-Time PCR

Total RNA from cells was extracted using TRIzol (Invitrogen) and cDNA was synthesized from total RNA with SuperScript III First Strand Synthesis Kit (Invitrogen). For a list of primers used in the experiment, refer to the supplementary materials (Supplementary Table 1). Real-time PCR was performed using Power SYBR Green Master Mix (Applied Biosystems, Foster City, CA, USA) on the StepOneTM Real-Time PCR System (Applied Biosystems, Foster City). The comparative CT (cycle threshold) method was used to evaluate relative quantification. Real-time PCR experiments were repeated three times, and each experiment was performed in triplicate. GAPDH was used as an internal control.

Statistical Analysis

SPSS Statistics Version 26 (IBM, Armonk, NY, USA) or GraphPad Prism (GraphPad Software, San Diego, CA, USA) were used for all statistical analyses. Statistical comparisons of mean values were performed using Student’s t-test (two-tailed), and group comparisons were performed using a two-tailed chi-square test, Fisher’s exact test, or linear-by-linear association. Pearson’s correlation coefficient was used to examine the association between genes. All p-values were two-sided.

Results

Cooperative Subtype Switch of THR and NCOR1/SMRT Expression in Papillary Thyroid Cancer

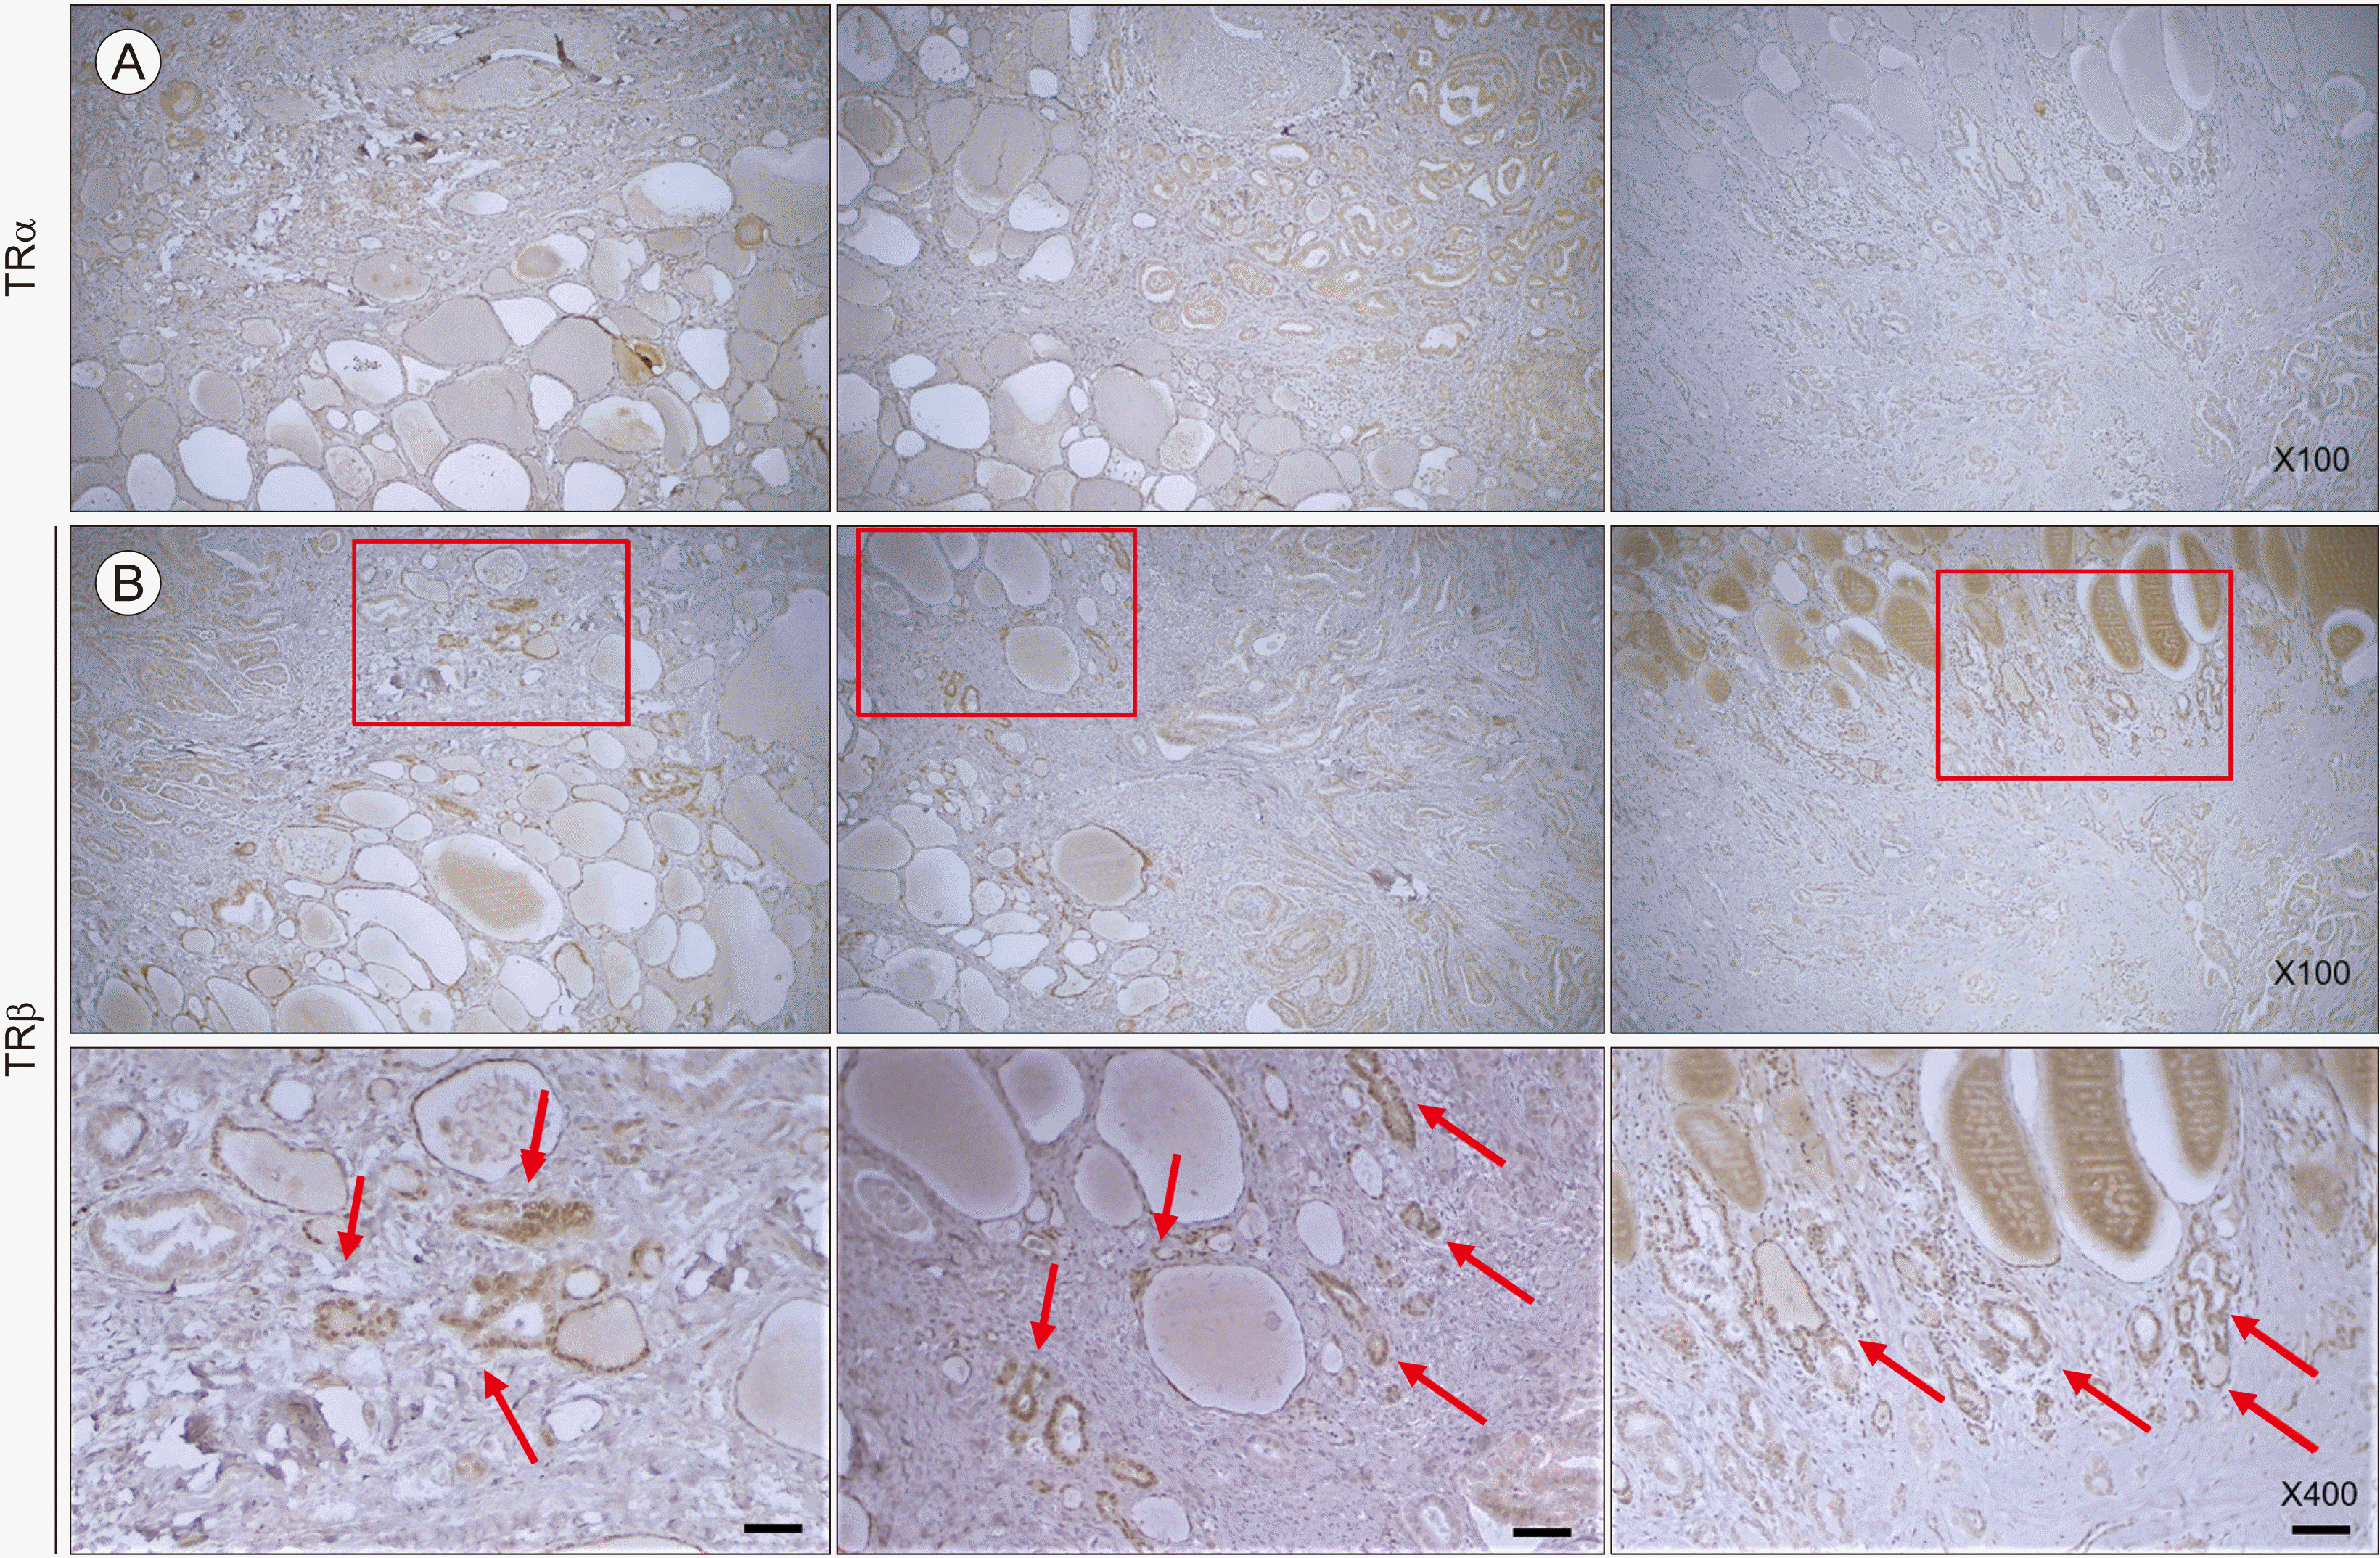
First, we analyzed the expression of THRA, THRB in normal and tumor tissues using the TCGA THCA data to understand their role in papillary thyroid cancer (PTC). Compared to normal tissues, unpaired and paired comparisons showed decreased mRNA expression of THRA, THRB in the tumor tissues (Fig. 1A, B). In the analyses of NCOR1/SMRT, NCOR1 expression was decreased in PTC, whereas SMRT was upregulated in PTC by unpaired and paired comparisons (Fig. 1C, D). As described in the Introduction, thyroid hormone might affect tumor behavior even though the exact causal mechanism is not elucidated.9-11) As TCGA data reflect the expression of the entire tumor, we postulated that the ability to predict localized TRα and TRβ expression might be insufficient. To overcome this putative limitation of TCGA data, we performed immunochemical staining of TRα and TRβ in patient samples to understand the heterogeneity of TRα and TRβ expression in tumor cells and in the tumor microenvironment (TME). Consistent with the results obtained using TCGA THCA data, no or faint staining intensity of TRα was observed in PTC cells (Fig. 2A). TRβ staining was not detected in most tumor cells (Fig. 2B). However, focal staining with strong intensity was observed for TRβ at the invasive front of PTC (Fig. 2B), suggesting that TRβ function might be related to PTC invasion.

Clinicopathological Characteristics according to THRA, THRB, and NCOR1/SMRT Expression in Papillary Thyroid Cancer

As we observed changes in THRA, THRB, and NCOR1/SMRT expression in PTC, we investigated the clinical and molecular impacts of these expression changes. First, we analyzed the clinicopathological features of THCA according to the NCOR1 expression status. Most of the clinical features showed no difference, but PTC with low NCOR1 expression presented more frequent extra-thyroidal extension (ETE) (Supplementary Table 2). PTC with high SMRT expression showed a high MACIS score, more aggressive histological subtypes, and advanced tumor-node-metastasis (TNM) stage compared to PTC with low SMRT expression (Supplementary Table 3). These data suggest that expression change to low NCOR1 and high SMRT might contribute to the aggressive clinical features of PTC. In the case of TRα, PTC with low THRA expression showed high SMRT expression, more aggressive histological subtypes, more frequent ETE, more frequent multifocality, and advanced T-, N-, and TNM stages (Table 1). These data suggest that the decreased expression of THRA is related to an increased expression of SMRT and that it contributes to the aggressive clinical features in PTC. Supporting our hypothesis, the molecular features of PTC with low THRA expression indicated a high frequency of BRAFV600E and TERT promoter mutations, BRAFV600E-like BRAFV600E-RAS score (BRS), a higher ERK score, lower differentiation score, and more frequent residual tumors (Supplementary Table 4). In fact, THRB expression was decreased in tumors compared to that in normal tissues in THCA data; however, because we detected a strong focal intensity of TRβ at the invasive front in PTC, we also analyzed the clinicopathological and molecular features according to THRB expression. Interestingly, PTC with high THRB expression was associated with high NCOR1/SMRT expression, older age, high MACIS score, more aggressive histological subtypes, more frequent ETE, and an advanced TNM stage (Table 2). PTC with high THRB expression also showed a high frequency of BRAFV600E mutation, BRAFV600E-like BRS, a higher ERK score, and lower differentiation score.

Subtype Change of TR from THRA to THRB is Linked with Epithelial to Mesenchymal Transition

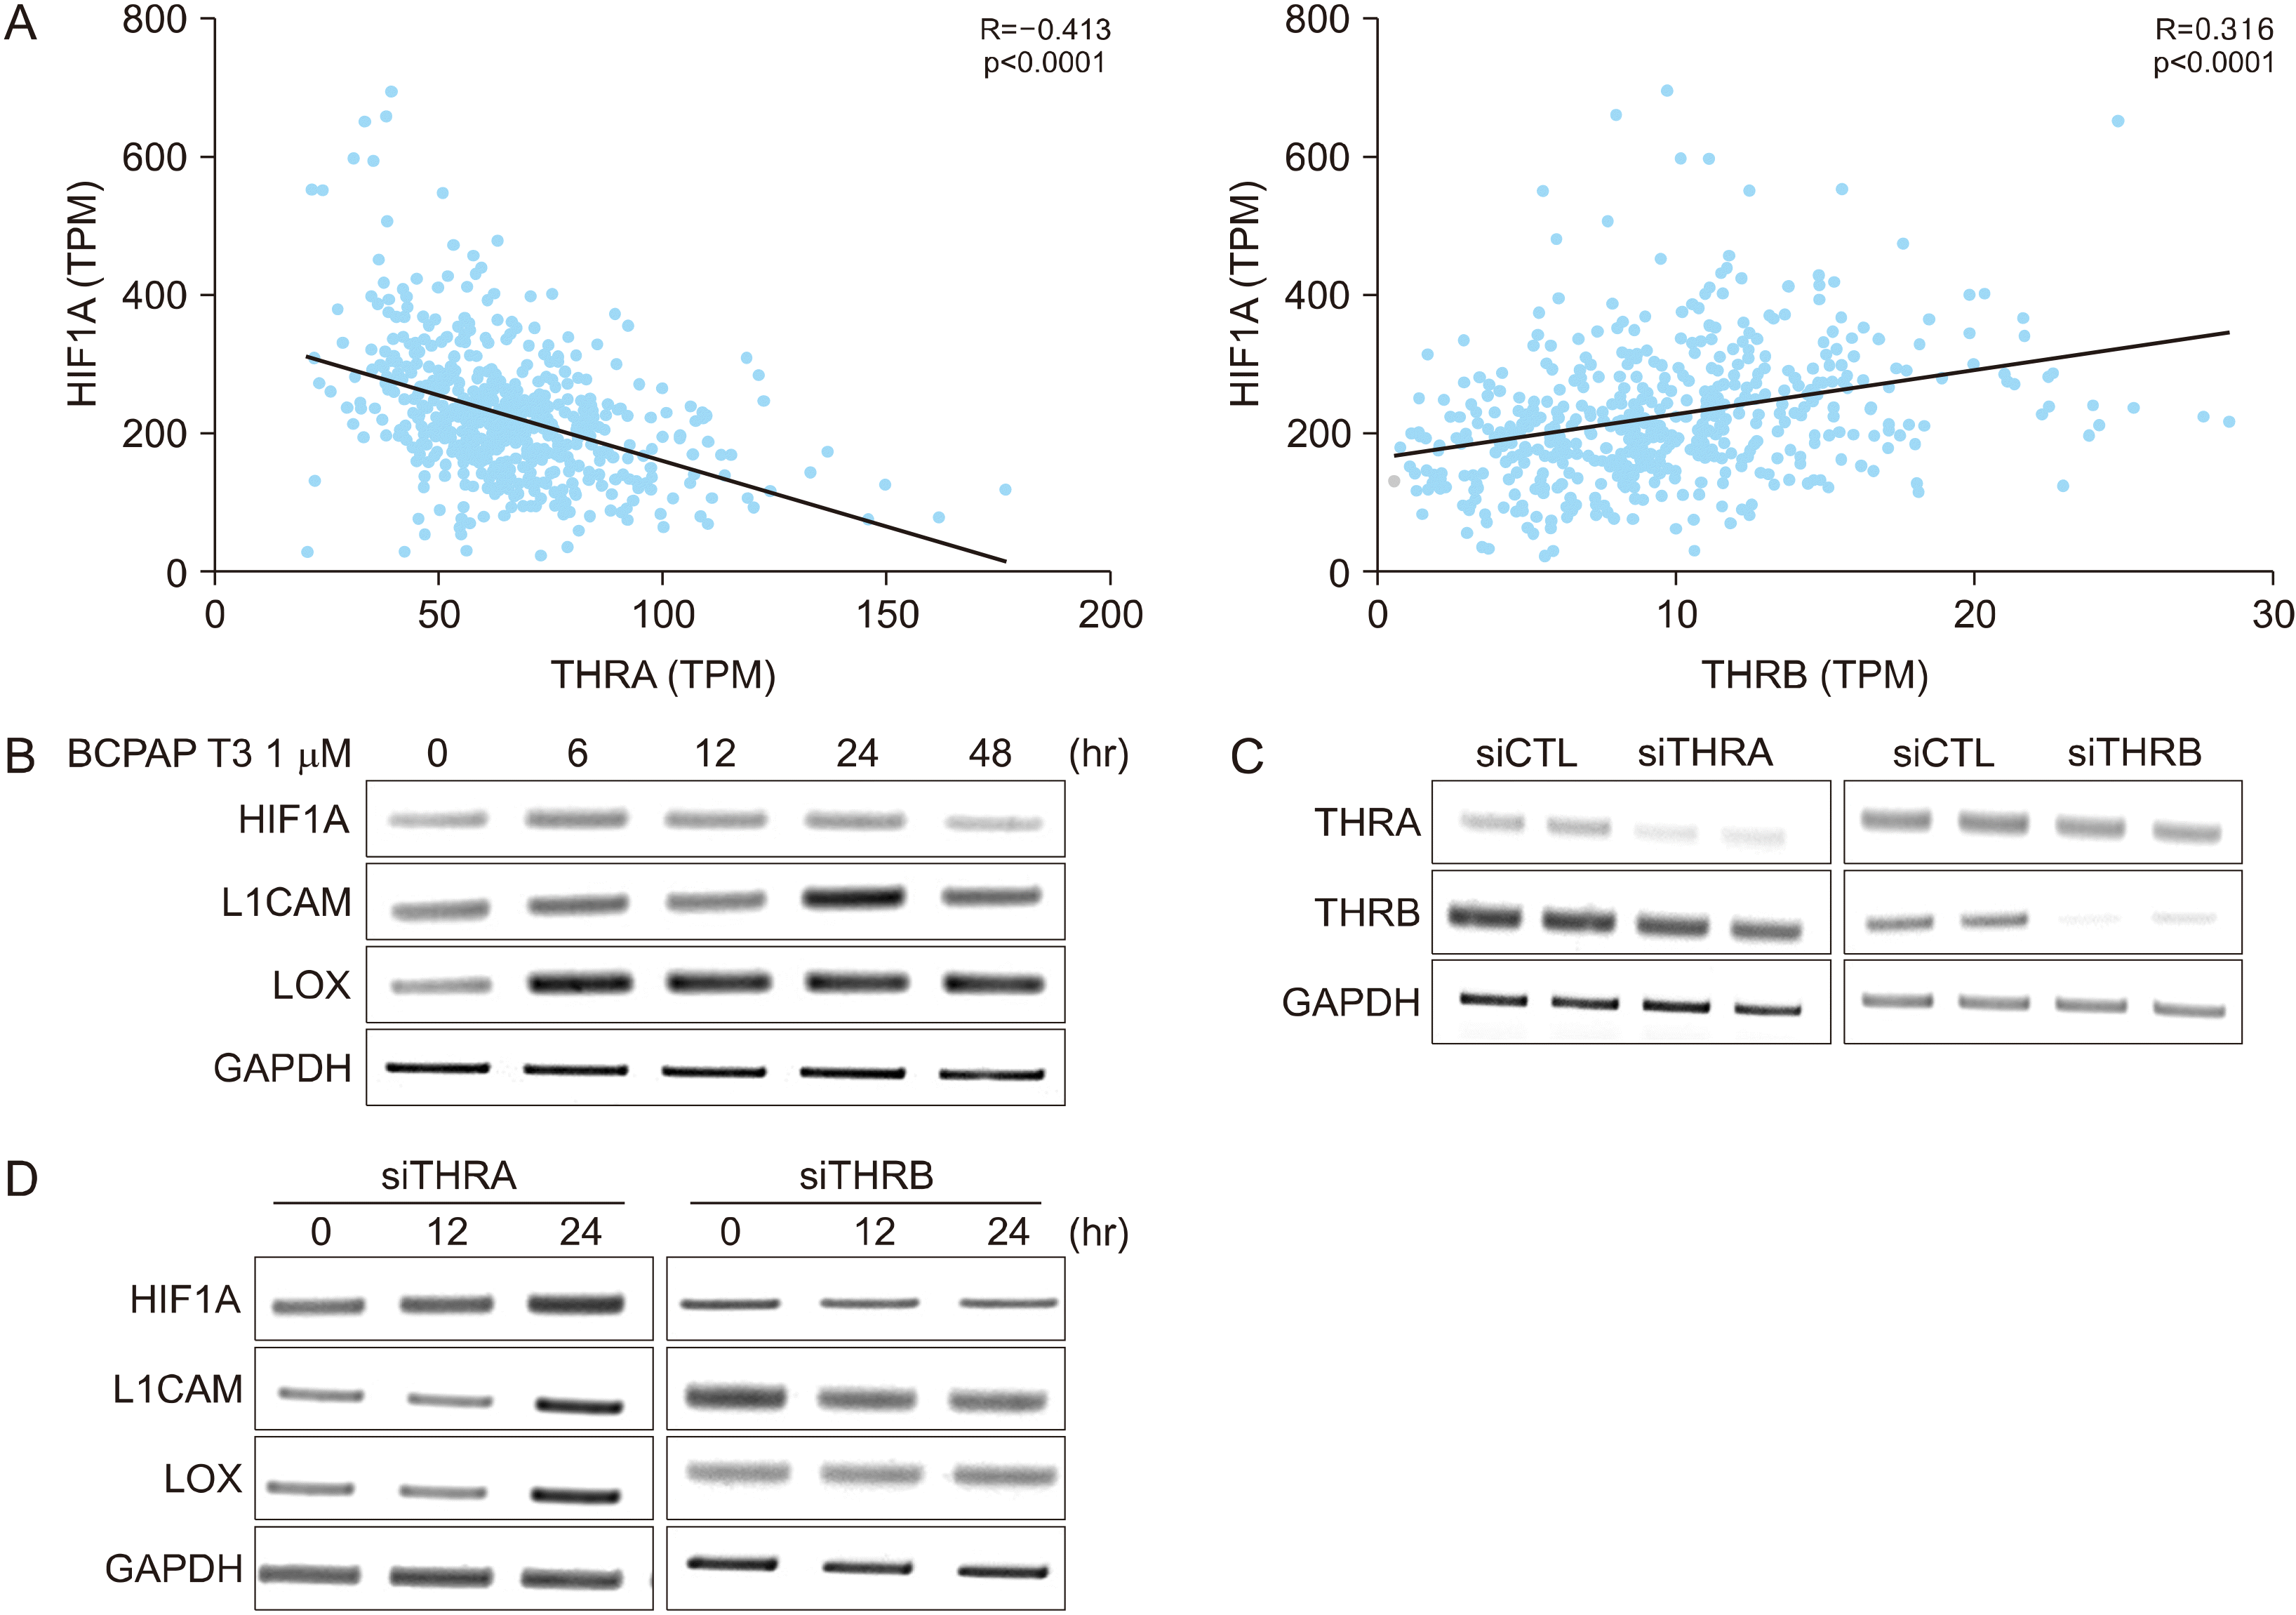
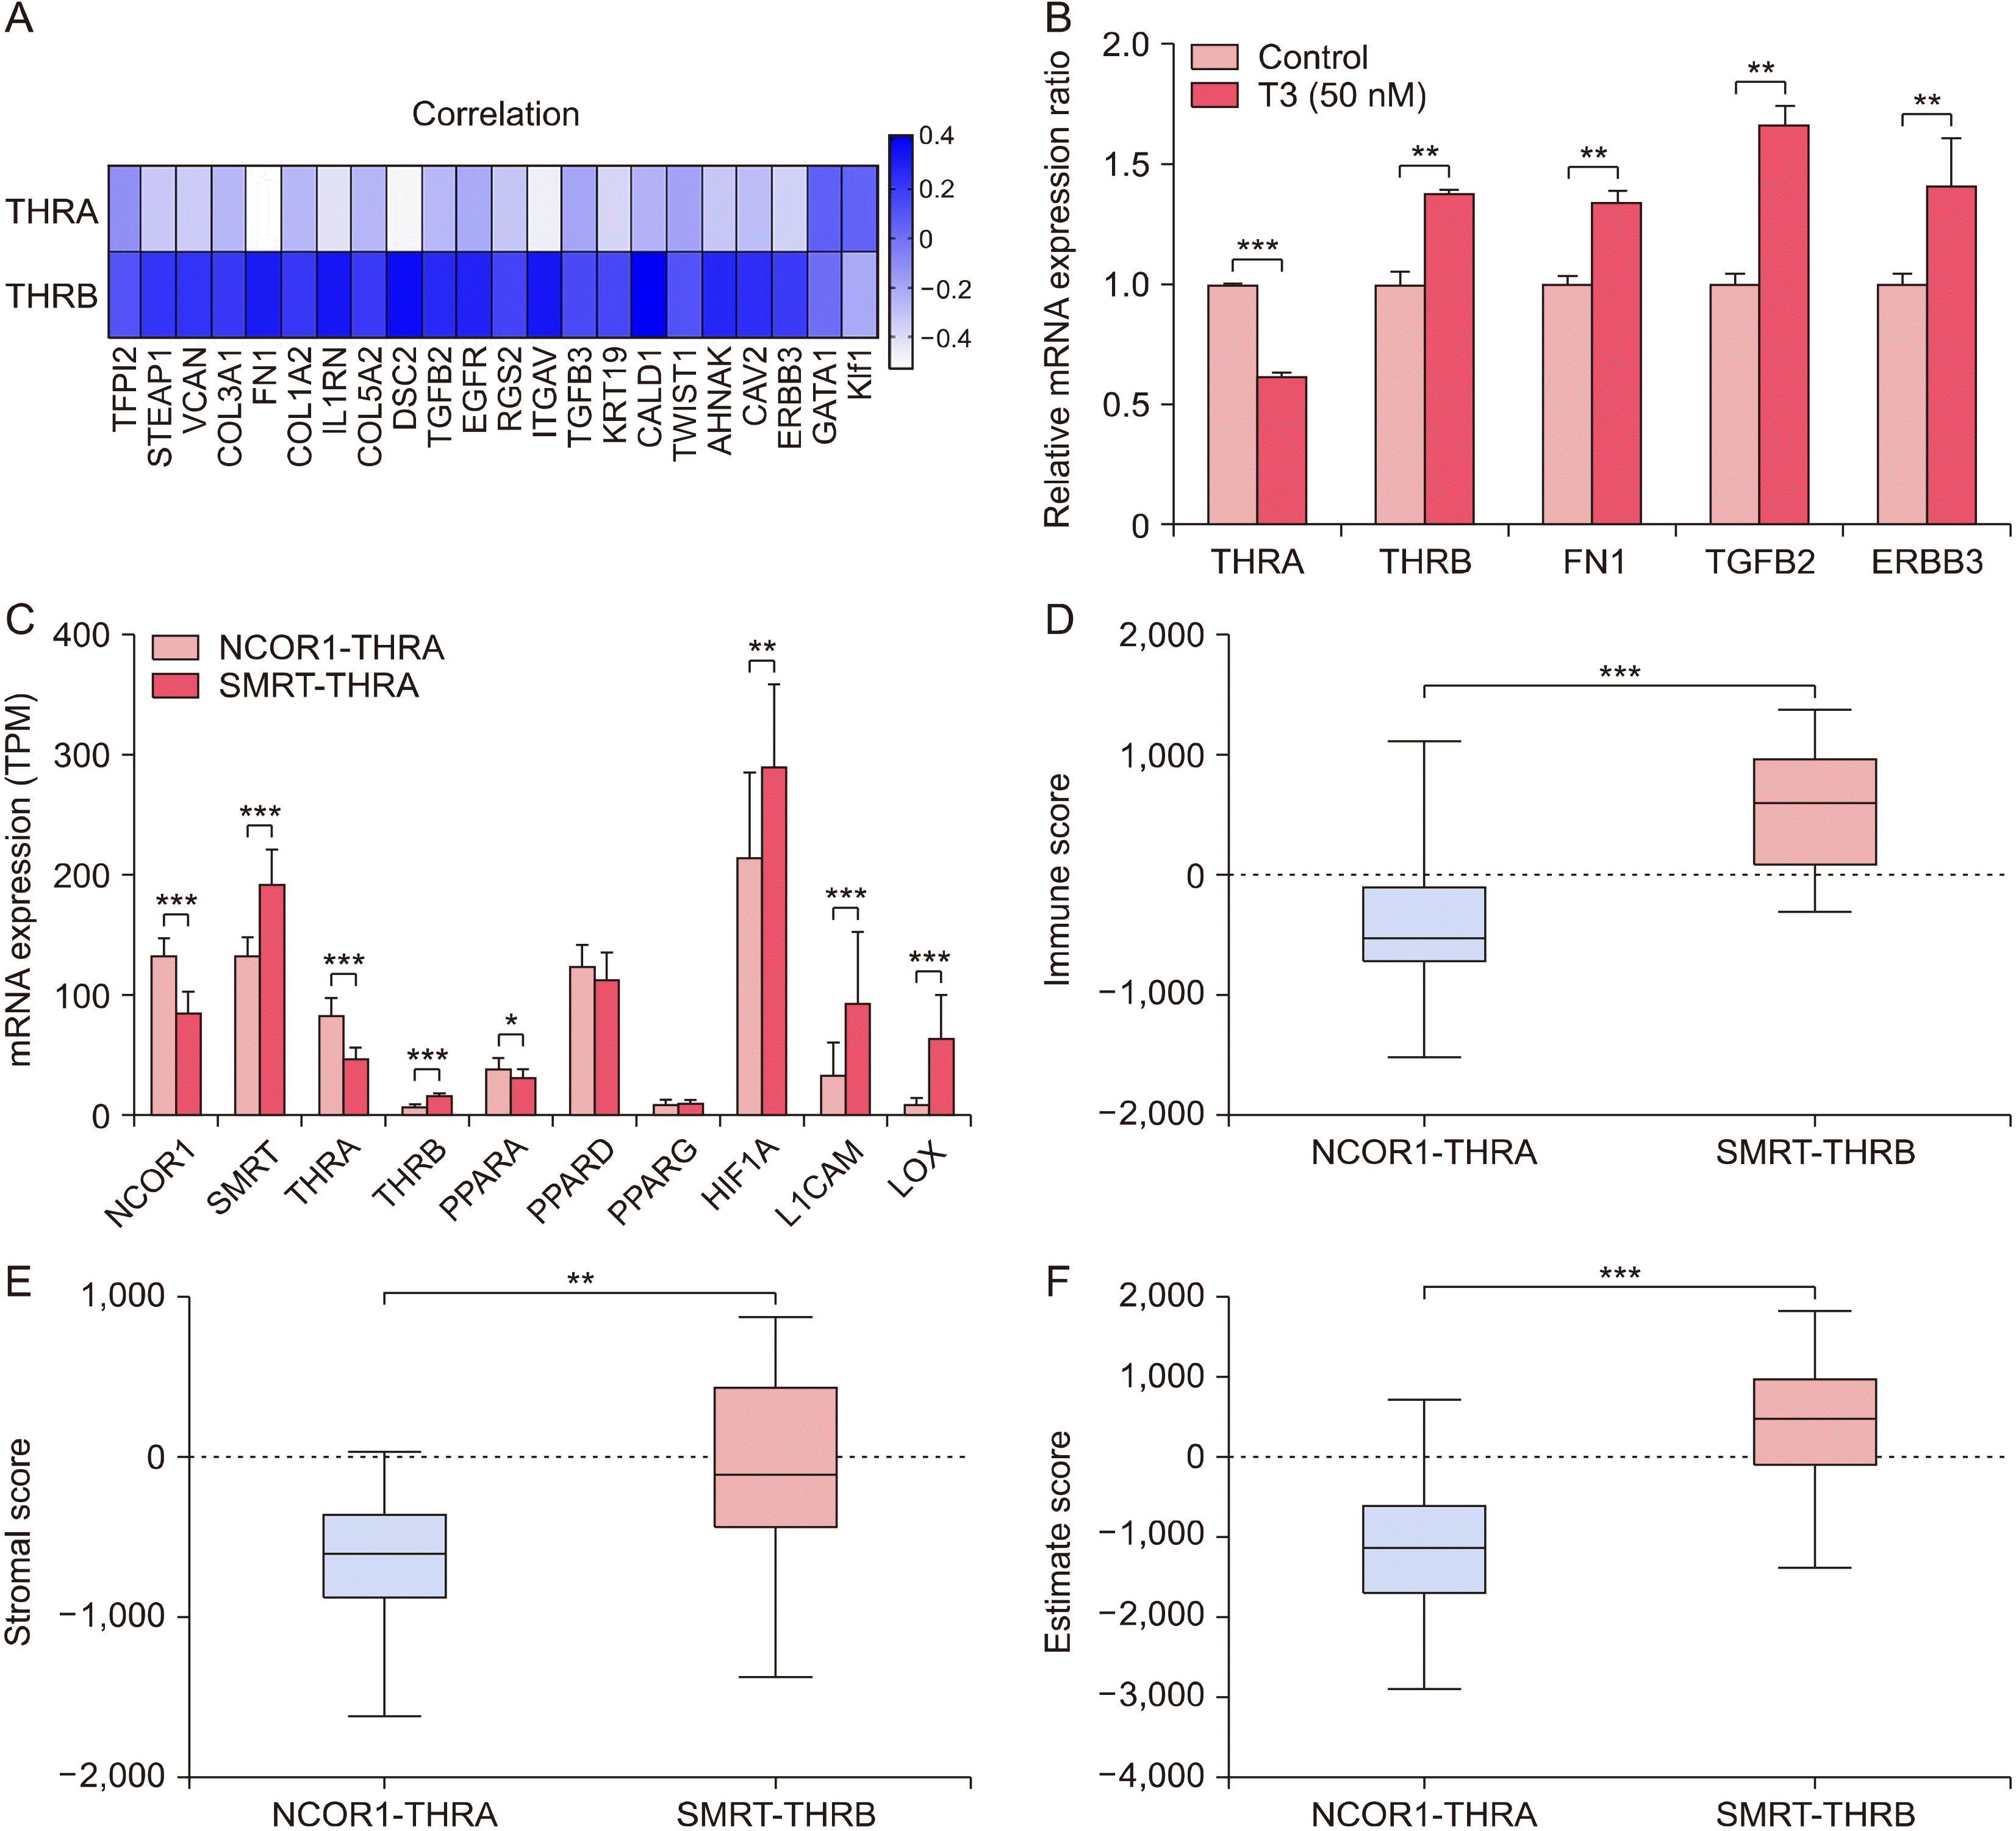
As we observed TRβ staining signals at the invasive front of PTC tissues, we postulated that THRB might play a role in the migration and invasion of cancer cells. Based on a literature review, we selected putative targets of TRβ transactivation, including hypoxia-inducible factor 1-alpha (HIF1A), L1 cell adhesion molecule (L1CAM), and Lysyl oxidase (LOX).15) All these genes have been reported as putative TH targets and as epithelial–mesenchymal transition (EMT)-related genes.16,17) In the TCGA THCA data, HIF1A expression showed a significant negative correlation with THRA expression but a significant positive correlation with THRB expression (Fig. 3A). The correlation of L1CAM and LOX expression with THRA and THRB expression also showed a pattern similar to that of HIF1A (data not shown). To validate our hypothesis, we treated BCPAP PTC cells with triiodothyronine (T3). Interestingly, T3 treatment increased the selective targets of TRβ, such as HIF1A, L1CAM, and LOX (Fig. 3B). Next, we transfected the cells with siTHRA and siTHRB to validate the selective dependency of the target genes on TRβ. As shown in Fig. 3C, siTHRA and siTHRB effectively eliminated THRA and THRB expression, respectively, indicating that these siRNAs were effective in suppressing their targets. Experiments using siTHRA and siTHRB showed that siTHRA had no impact on the upregulation of target genes, whereas siTHRB almost completely abolished the upregulation of the target genes induced by T3 (Fig. 3D). Taken together, our data suggest that the subtype change from THRA to THRB might be linked to the T3-induced transcriptome in cells under EMT. To support our in vitro experiments based on the literature review, we performed comparison analyses between TR and EMT-related genes using TCGA THCA data. From these analyses, we selected representative EMT-related genes that were positively correlated with THRB expression including fibronectin 1 (FN1) and transforming growth factor beta 2 (TGFB2), Erb-B2 receptor tyrosine kinase 3 (ERBB3) (Fig. 4A).18,19) When BCPAP cells were treated with T3, the expression of these representative genes was also found to be increased (Fig. 4B).

Clinicopathological and Molecular Characteristics of the Cooperative Subtype Switch from NCOR1/THRA to SMRT/THRB

Based on our analysis for the expression change of TR and its repressors, PTC showed a subtype shift from NCOR1 and THRA to SMRT and THRB, respectively. To understand the implications of this cooperative subtype switching from NCOR1/THRA to SMRT/THRB, we generated two groups from TCGA THCA data: the high NCOR1 and high THRA (NCOR1/THRA) group vs. the high SMRT and high THRB group (SMRT/THRB). Upon the comparison of clinicopathological characteristics between these groups, SMRT/THRB presented an increased frequency of male patients, more frequent ETE, and advanced T-, N-, and TNM stages (Table 3). Comparisons of molecular features showed no RAS mutation in SMRT/THRB, which was consistent with the lower BRS and higher ERK scores in SMRT/THRB. The differentiation score was also lower in SMRT/THRB, indicating its aggressive features (Table 4). SMRT/THRB also showed an upregulation of TRβ target genes including HIF1A, L1CAM, and LOX (Fig. 4C). TR has been reported to crosstalk with other metabolically important nuclear receptors including peroxisome proliferator-activated receptor (PPAR). SMRT/THRB showed a slight downregulation of peroxisome proliferator-activated receptor alpha (PPARA) but induced no change in other PPARs (Fig. 4C).5) Upregulation of EMT-related genes can cause changes in the TME, such as altered immune cells including tumor-infiltrating lymphocytes (TILs) and cancer-associated fibroblasts (CAFs). The recently developed ESTIMATE algorithm identifies differentially expressed genes (DEGs) from immune cell- and infiltrating stromal-related genes, and evaluates the estimated tumor purity (ESTIMATE score) and levels of stromal cells (stromal score) and immune cells (immune score) in the admixture from the expression data.14) Upon applying this algorithm to our two groups, SMRT/THRB showed remarkably higher scores compared to NCOR1/THRA (Fig. 4D-F). Taken together, these data consistently indicate that the cooperative subtype switch from NCOR1/THRA to SMRT/THRB is related to aggressive clinical and molecular features, which might be related to EMT and EMT-related TME.

Discussion

TH affects nearly every cell in the body.1,4) The well-known function of TH is to increase the basal metabolic rate, affect protein synthesis, and increase sensitivity to catecholamines.4) In addition to these metabolic and cardiovascular functions, TH is closely linked with neural maturation and plays an important role in the development and differentiation of all cells.20-22) Its various functions suggest that TH regulates the expression of cell type-specific target genes through more complex transcriptional regulatory mechanisms.1,2,4) In fact, TR has a unique regulatory mechanism by which it can influence gene expression regardless of ligand binding because TR can bind to T3 response elements (TREs) without TH. To repress gene expression, TR needs to recruit corepressor proteins such as NCOR1 and SMRT.5,8)
Epigenetic regulation of gene expression is involved in complex regulatory mechanisms.23,24) For example, the accessibility of DNA and the state of chromatin compaction have a strong influence on gene expression. Co-regulators such as NCOR1 and SMRT, which are currently the best-characterized co-repressors, play a pivotal role in the connection between chromatin- modifying enzymes and nuclear receptors such as TR.8) As NCOR1 and SMRT have similar functional domains, their repressor function is regarded to be quite similar. However, recent interesting observations using liver-specific mutant NCoR mice (L-NCoRΔID) and SMRT knockout mice have suggested a repressor-specific function of TR, indicating that NCOR1 is the principal mediator of TH signaling.8) Further, Ncor1 and Ncor2 have been reported to have different roles in zebrafish primitive myelopoiesis. Ncor2 acts in parallel with tal1 and lmo2 to direct the maturation of mpx neutrophils and mfap4 macrophages, whereas Ncor1 directs the maturation of mpx neutrophils.25) In this context, we addressed the receptor-specific role of TR and the corepressor-specific functions of NCOR1 and SMRT. Our first interesting finding was related to the expression patterns of THRA and THRB. As cancer cells sustain proliferative signaling and enable replicative immortality, thyroid hormone signaling for cellular development and differentiation might not be required for carcinogenesis.26) Supporting this idea, the overall THRA and THRB expression was decreased and their repressor NCOR1 was also downregulated in PTC. However, focal strong intensity of TRβ was detected in the invasive front, indicating that TRβ target genes are required for EMT and TME changes, at least in PTC. Our postulation is also compatible with the co-repressor changes from NCOR1 to SMRT because SMRT showed weak repressor activity on TR, as reported previously.8) Further, the clinicopathological characteristics and molecular profiles supported our idea, presenting more aggressive features with the change from THRA to THRB and from NCOR1 to SMRT.
Previous studies have suggested that TH can affect tumor behavior by HIF1A induction.15) This observation was reproduced in our in vitro experiments. Furthermore, we observed that the effect of TH on HIF1A and HIF1A-related genes such as L1CAM and LOX is dependent on THRB but not on THRA. In addition to HIF1A-related genes, THRB expression showed a strong positive correlation with the expression of EMT-related genes, as verified by the T3-induced upregulation of FN1, TGFB2, and ERBB3 in BCPAP cells. Taken together, these observations indicate that the subtype switch from THRA to THRB might contribute to EMT-related changes in the invasive front of PTC. Cooperatively, their corepressor also needs to be changed from NCOR1 to SMRT, which harbors weaker repressor activity for TR.8) This cooperative subtype switch from NCOR1/THRA to SMRT/THRB indicated the upregulation of HIF1A-related genes and was related to EMT and TME changes with high immune, stromal, and ESTIMATE scores. In fact, we selected BCPAP cells as a representative PTC cell line because this cell line has BRAFV600E mutation but no mutation related PKB/AKT signaling which is well known signaling pathway to promote EMT. To validate our in vitro data, the additional experiments performed on the other PTC cell lines such as TPC1, K1 and so forth are also needed.
Recent management strategies for PTC have shifted to active surveillance (AS) instead of immediate surgery, especially for papillary thyroid microcarcinoma (PTMC).27) However, the molecular markers for predicting tumor progression have not been fully investigated. Currently, although clinicians use BRAFV600E mutation and TERT promoter mutation, these genetic markers have very limited efficacy for predicting the progression of PTMC in AS.28-30) EMT and EMT-related TME changes might be a critical step in PTMC progression.31) Thus, from a diagnostic perspective, focal TRβ expression and the upregulation of SMRT might be a predictive marker of tumor progression representing EMT and EMT-related TME changes. From a therapeutic perspective, TH might have a harmful effect on PTC, showing focal TRβ expression and upregulation of SMRT.
In this study, because we used THRB expression data from TCGA THCA, we could not evaluate the focal expression of TRβ because of the intrinsic limitation of transcriptomic data. To obtain more detailed information on the role of TRβ in EMT, a study using a large sample cohort is warranted. Further, the repressor targets of SMRT were not investigated in this study. The clinicopathological and molecular features of SMRT upregulation in PTC showed aggressive features, regardless of THRA and THRB. Other important targets of NCOR1 and SMRT, such as liver X receptor (LXR), PPARs, and Rev-Erb alpha (Rev-Erbα), might also be an interesting topic for future research in thyroid cancer.6,32,33)
In summary, our results indicate that the cooperative subtype switch of TR along with its corepressor change is related to poor clinical behavior and more aggressive molecular features in PTC. Through this subtype switch, TH may play a role in PTC progression, especially in EMT and EMT-related TME changes.

Supplemental Materials

Acknowledgments

S.G.L was supported by National Research Foundation of Korea (NRF) grants funded by the Korean government (MEST) (NRF-2020R1F1A1048986). J. L. was supported by a National Research Foundation of Korea (NRF) grant funded by the Korean government (MEST) (NRF-2020R1A2C1006047) and by the Korean Foundation for Cancer Research (2020). Y.S.J. was supported by National Research Foundation of Korea (NRF) grants funded by the Korean government (MEST) (NRF-2018R1A2B6004179, NRF-2021R1H1A2012035).
The authors would like to thank Ji Young Kim (Severance Hospital), Hwanju Lee (Severance Hospital), Hee Chang Yu (Severance Hospital), and Hoyoung Kim (Severance Hospital) for providing technical support. We would also like to thank Editage (www.editage.co.kr) for English language editing.

Notes

Conflicts of Interest

No potential conflict of interest relevant to this article was reported.

Author Contributions

Y.S.J. and J.L. designed the project and supervised the research; S.J., S.G.L., H.J.K., G.L., and S.P. performed the analyses; S.J. and S.G.L. performed the computational analysis; S.P. and I-K.K. contributed to discussions about the research; S.J., S.G.L., Y.S.J., and J.L. wrote the manuscript; all authors reviewed the manuscript.

References

1. Harvey CB, Williams GR. 2002; Mechanism of thyroid hormone action. Thyroid. 12(6):441–6. DOI: 10.1089/105072502760143791. PMID: 12165104.
crossref
2. Brent GA. Tissue-specific actions of thyroid hormone: insights from animal models. Rev Endocr Metab Disord. 2000; 1(1-2):27–33. DOI: 10.1023/a:1010056202122. PMID: 11704989.
3. Ortiga-Carvalho TM, Sidhaye AR, Wondisford FE. 2014; Thyroid hormone receptors and resistance to thyroid hormone disorders. Nat Rev Endocrinol. 10(10):582–91. DOI: 10.1038/nrendo.2014.143. PMID: 25135573. PMCID: PMC4578869.
crossref
4. Yen PM. 2001; Physiological and molecular basis of thyroid hormone action. Physiol Rev. 81(3):1097–142. DOI: 10.1152/physrev.2001.81.3.1097. PMID: 11427693.
crossref
5. Mottis A, Mouchiroud L, Auwerx J. 2013; Emerging roles of the corepressors NCoR1 and SMRT in homeostasis. Genes Dev. 27(8):819–35. DOI: 10.1101/gad.214023.113. PMID: 23630073. PMCID: PMC3650221.
6. Jo YS, Ryu D, Maida A, Wang X, Evans RM, Schoonjans K, et al. 2015; Phosphorylation of the nuclear receptor corepressor 1 by protein kinase B switches its corepressor targets in the liver in mice. Hepatology. 62(5):1606–18. DOI: 10.1002/hep.27907. PMID: 25998209. PMCID: PMC4618256.
crossref
7. Karpen SJ. 2015; Nuancing insulin's actions in liver through rapid NCOR1 phosphorylation. Hepatology. 62(5):1344–5. DOI: 10.1002/hep.28014. PMID: 26223211.
8. Shimizu H, Astapova I, Ye F, Bilban M, Cohen RN, Hollenberg AN. 2015; NCoR1 and SMRT play unique roles in thyroid hormone action in vivo. Mol Cell Biol. 35(3):555–65. DOI: 10.1128/MCB.01208-14. PMID: 25421714. PMCID: PMC4285426.
9. Tran TV, Kitahara CM, de Vathaire F, Boutron-Ruault MC, Journy N. 2020; Thyroid dysfunction and cancer incidence: a systematic review and meta-analysis. Endocr Relat Cancer. 27(4):245–59. DOI: 10.1530/ERC-19-0417. PMID: 32045361.
crossref
10. Zhou W, Brumpton B, Kabil O, Gudmundsson J, Thorleifsson G, Weinstock J, et al. 2020; GWAS of thyroid stimulating hormone highlights pleiotropic effects and inverse association with thyroid cancer. Nat Commun. 11(1):3981. DOI: 10.1038/s41467-020-17718-z. PMID: 32769997. PMCID: PMC7414135.
crossref
11. Yuan S, Kar S, Vithayathil M, Carter P, Mason AM, Burgess S, et al. 2020; Causal associations of thyroid function and dysfunction with overall, breast and thyroid cancer: a two-sample Mendelian randomization study. Int J Cancer. 147(7):1895–903. DOI: 10.1002/ijc.32988. PMID: 32215913. PMCID: PMC7611568.
crossref
12. Cancer Genome Atlas Research Network. 2014; Integrated genomic characterization of papillary thyroid carcinoma. Cell. 159(3):676–90. DOI: 10.1016/j.cell.2014.09.050. PMID: 25417114. PMCID: PMC4243044.
13. Lee J, Seol MY, Jeong S, Kwon HJ, Lee CR, Ku CR, et al. 2015; KSR1 is coordinately regulated with Notch signaling and oxidative phosphorylation in thyroid cancer. J Mol Endocrinol. 54(2):115–24. DOI: 10.1530/JME-14-0270. PMID: 25608512.
crossref
14. Yoshihara K, Shahmoradgoli M, Martinez E, Vegesna R, Kim H, Torres-Garcia W, et al. 2013; Inferring tumour purity and stromal and immune cell admixture from expression data. Nat Commun. 4:2612. DOI: 10.1038/ncomms3612. PMID: 24113773. PMCID: PMC3826632.
crossref
15. Yuan C, Lin JZ, Sieglaff DH, Ayers SD, Denoto-Reynolds F, Baxter JD, et al. 2012; Identical gene regulation patterns of T3 and selective thyroid hormone receptor modulator GC-1. Endocrinology. 153(1):501–11. DOI: 10.1210/en.2011-1325. PMID: 22067320. PMCID: PMC3249679.
crossref
16. Kim KS, Min JK, Liang ZL, Lee K, Lee JU, Bae KH, et al. 2012; Aberrant l1 cell adhesion molecule affects tumor behavior and chemosensitivity in anaplastic thyroid carcinoma. Clin Cancer Res. 18(11):3071–8. DOI: 10.1158/1078-0432.CCR-11-2757. PMID: 22472175.
crossref
17. Semenza GL. 2012; Molecular mechanisms mediating metastasis of hypoxic breast cancer cells. Trends Mol Med. 18(9):534–43. DOI: 10.1016/j.molmed.2012.08.001. PMID: 22921864. PMCID: PMC3449282.
crossref
18. Kalluri R, Weinberg RA. 2009; The basics of epithelial-mesenchymal transition. J Clin Invest. 119(6):1420–8. DOI: 10.1172/JCI39104. PMID: 19487818. PMCID: PMC2689101.
crossref
19. Das V, Bhattacharya S, Chikkaputtaiah C, Hazra S, Pal M. The basics of epithelial-mesenchymal transition (EMT): a study from a structure, dynamics, and functional perspective. J Cell Physiol. 2019; [Online ahead of print]. DOI: 10.1002/jcp.28160. PMID: 30723913.
crossref
20. Bernal J. 2005; Thyroid hormones and brain development. Vitam Horm. 71:95–122. DOI: 10.1016/S0083-6729(05)71004-9. PMID: 16112266.
crossref
21. Pemberton HN, Franklyn JA, Kilby MD. 2005; Thyroid hormones and fetal brain development. Minerva Ginecol. 57(4):367–78. PMID: 16170282.
22. Jeong S, Kim IK, Kim H, Choi MJ, Lee J, Jo YS. 2020; Liver X receptor beta related to tumor progression and ribosome gene expression in papillary thyroid cancer. Endocrinol Metab (Seoul). 35(3):656–68. DOI: 10.3803/EnM.2020.667. PMID: 32814418. PMCID: PMC7520597.
23. Lu Y, Chan YT, Tan HY, Li S, Wang N, Feng Y. 2020; Epigenetic regulation in human cancer: the potential role of epi-drug in cancer therapy. Mol Cancer. 19(1):79. DOI: 10.1186/s12943-020-01197-3. PMID: 32340605. PMCID: PMC7184703.
crossref
24. Zhao W, Qi X, Liu L, Ma S, Liu J, Wu J. 2020; Epigenetic regulation of m(6)A modifications in human cancer. Mol Ther Nucleic Acids. 19:405–12. DOI: 10.1016/j.omtn.2019.11.022. PMID: 31887551. PMCID: PMC6938965.
crossref
25. Li J, Li K, Dong X, Liang D, Zhao Q. 2014; Ncor1 and Ncor2 play essential but distinct roles in zebrafish primitive myelopoiesis. Dev Dyn. 243(12):1544–53. DOI: 10.1002/dvdy.24181. PMID: 25156564.
crossref
26. Hanahan D, Weinberg RA. 2011; Hallmarks of cancer: the next generation. Cell. 144(5):646–74. DOI: 10.1016/j.cell.2011.02.013. PMID: 21376230.
crossref
27. Choi JB, Lee WK, Lee SG, Ryu H, Lee CR, Kang SW, et al. 2018; Long-term oncologic outcomes of papillary thyroid microcarcinoma according to the presence of clinically apparent lymph node metastasis: a large retrospective analysis of 5,348 patients. Cancer Manag Res. 10:2883–91. DOI: 10.2147/CMAR.S173853. PMID: 30214283. PMCID: PMC6118257.
crossref
28. Lee SG, Lee WK, Lee HS, Moon J, Lee CR, Kang SW, et al. 2017; Practical performance of the 2015 American Thyroid Association guidelines for predicting tumor recurrence in patients with papillary thyroid cancer in South Korea. Thyroid. 27(2):174–81. DOI: 10.1089/thy.2016.0252. PMID: 27750028.
crossref
29. McKelvey BA, Zeiger MA, Umbricht CB. 2020; Exploring the epigenetic regulation of telomerase reverse transcriptase (TERT) in human cancer cell lines. Mol Oncol. 14(10):2355–7. DOI: 10.1002/1878-0261.12798. PMID: 32920953. PMCID: PMC7530778.
crossref
30. Yoon J, Lee E, Koo JS, Yoon JH, Nam KH, Lee J, et al. 2020; Artificial intelligence to predict the BRAFV600E mutation in patients with thyroid cancer. PLoS One. 15(11):e0242806. DOI: 10.1371/journal.pone.0242806. PMID: 33237975. PMCID: PMC7688114.
crossref
31. Lee WK, Lee J, Kim H, Lee SG, Choi SH, Jeong S, et al. 2019; Peripheral location and infiltrative margin predict invasive features of papillary thyroid microcarcinoma. Eur J Endocrinol. 181(2):139–49. DOI: 10.1530/EJE-18-1025. PMID: 31146263.
crossref
32. Lu C, Cheng SY. 2010; Thyroid hormone receptors regulate adipogenesis and carcinogenesis via crosstalk signaling with peroxisome proliferator-activated receptors. J Mol Endocrinol. 44(3):143–54. DOI: 10.1677/JME-09-0107. PMID: 19741045. PMCID: PMC3464095.
crossref
33. Aninye IO, Matsumoto S, Sidhaye AR, Wondisford FE. 2014; Circadian regulation of Tshb gene expression by Rev-Erbalpha (NR1D1) and nuclear corepressor 1 (NCOR1). J Biol Chem. 289(24):17070–7. DOI: 10.1074/jbc.M114.569723. PMID: 24794873. PMCID: PMC4059148.
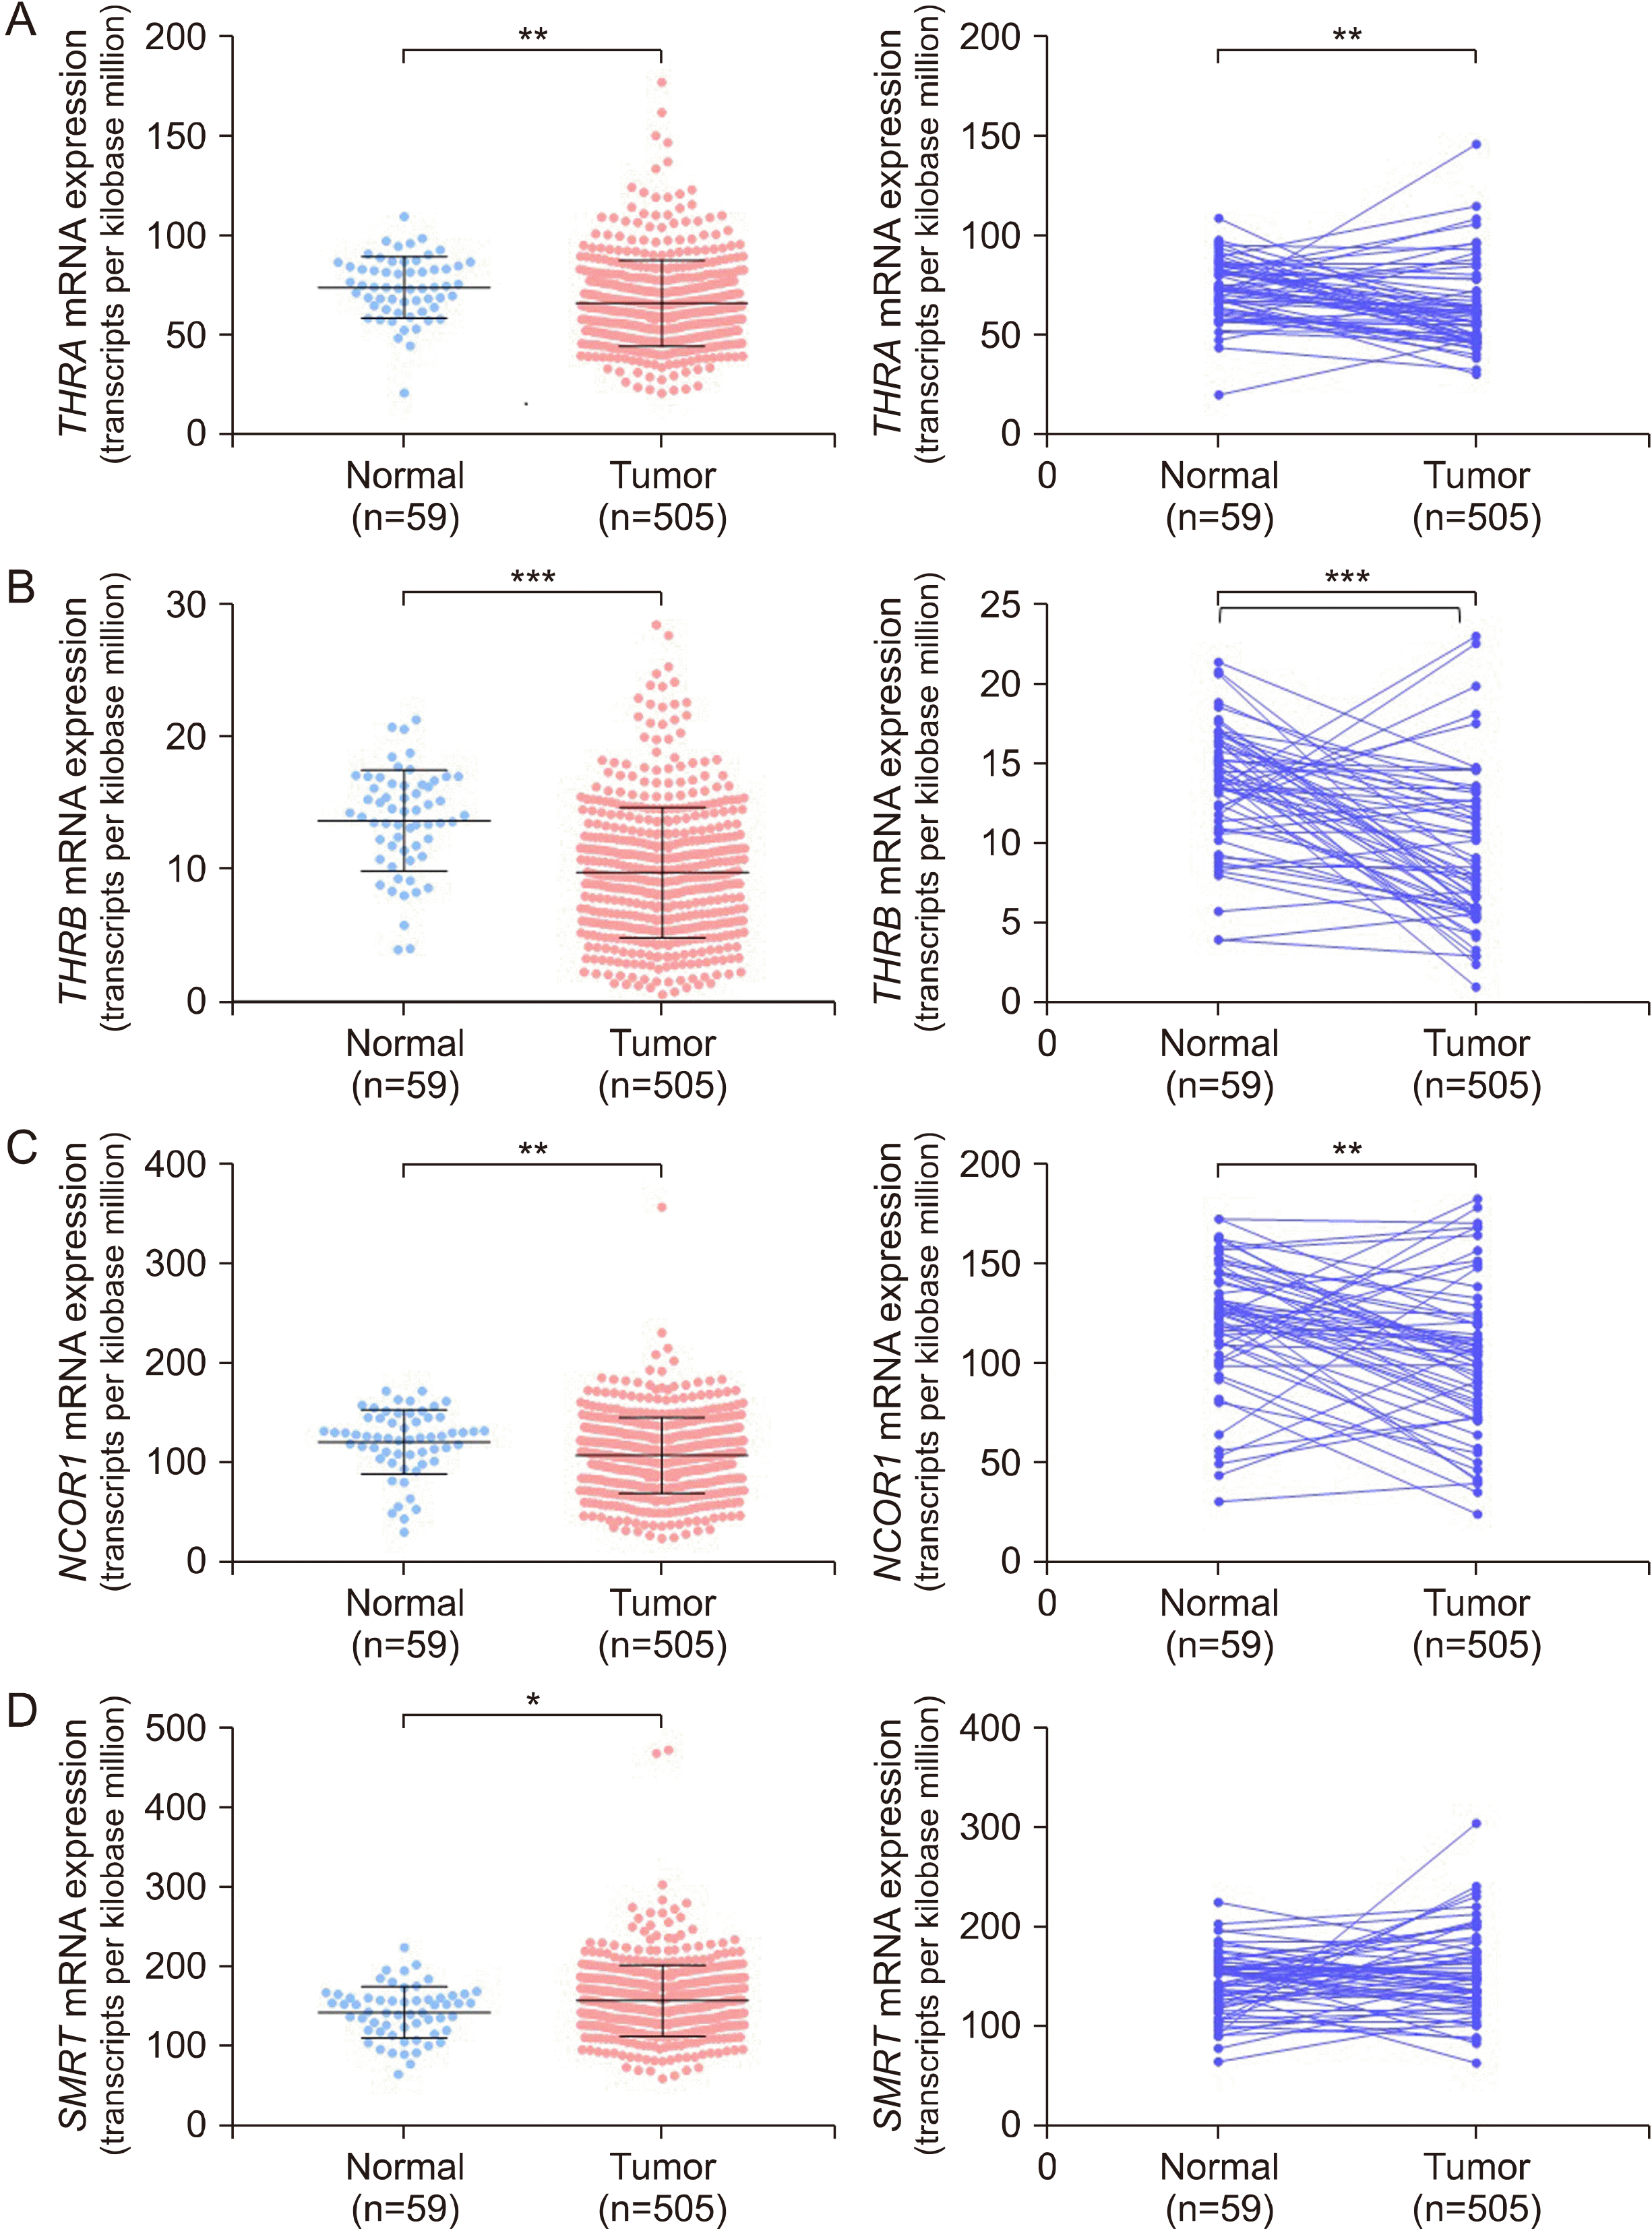
Fig. 1
Comparison of (A) THRA, (B) THRB, (C) NCOR1 and (D) SMRT mRNA expression between normal and thyroid cancer tissues by unpaired (left panel) and paired (right panel) t tests. NCOR1: nuclear receptor corepressor 1, SMRT: silencing mediator for retinoid or thyroid hormone receptor, THRA: thyroid hormone receptor alpha, THRB: thyroid hormone receptor beta. Data are presented as mean± S.D. Mean comparisons were analyzed by an unpaired or paired t test. *p<0.0001.
ijt-14-2-152-f1.tif
Fig. 2
Representative immunohistochemistry-paraffin (IHC-P) staining for TRα (A), TRβ (B) in papillary thyroid cancer. THRA: thyroid hormone receptor alpha, THRB: thyroid hormone receptor beta. Red boxes indicate the areas magnified at the next high power field. Scale bars indicate 25 μm. Red arrows indicate the focal strong staining intensity of TRβ in the invasive front area.
ijt-14-2-152-f2.tif
Fig. 3
TRβ dependent upregulation of HIF1A target genes in PTC. (A) Correlation between expression levels of THRA, THRB and HIF1A in TCGA (The Cancer Genome Atlas) THCA (thyroid carcinoma). (B) Representative results of reverse transcription-polymerase chain reaction (RT-PCR) indicating the effect of T3 on HIF1A target genes. (C) Representative results of RT-PCR showing the silencing efficacy effect of siTHRA and siTHRB. (D) Representative results of RT-PCR showing the effect of THRA, THRB silencing on the expression of HIF1A target genes in BCPAP cells. HIF1A: hypoxia inducible factor1 alpha, T3: triiodothyronine, THRA: thyroid hormone receptor alpha, THRB: thyroid hormone receptor beta. All experiments were repeated three times, and each experiment was performed in triplicate. Correlation coefficients were calculated by Pearson’s method.
ijt-14-2-152-f3.tif
Fig. 4
Positive relationship of THRB expression with EMT-related genes. (A) Correlation between expression levels of THRA, THRB and epithelial to mesenchymal transition genes in TCGA THCA. (B) qPCR analysis presenting T3 induced upregulation of EMT-related genes in BCPAP cells. (C) Comparison of the expression of HIF1A target genes according to subtype switch from high NCOR1/high THRA (NCOR1-THRA) to high SMRT/high THRB (SMRT/THRB). Comparison of (D) immune score, (E) stromal score, and (F) ESTIMATE score according to subtype switch. EMT: epithelial- mesenchymal transition, HIF1A: hypoxia inducible factor1 alpha, NCOR1: nuclear receptor corepressor 1, SMRT: silencing mediator for retinoid or thyroid hormone receptor, TCGA: The Cancer Genome Atlas, THCA: thyroid carcinoma, THRA: thyroid hormone receptor alpha, THRB: thyroid hormone receptor beta. All experiments were repeated three times, and each experiment was performed in triplicate. Data are presented as mean±S.D. Correlation coefficients were calculated by Pearson’s method. Mean comparisons were analyzed by an unpaired or paired t test. *p<0.01; **p<0.001; ***p< 0.0001.
ijt-14-2-152-f4.tif
Table 1
Clinicopathological characteristics of TCGA THCA dataset according to THRA expression status
Characteristics THRA p-value

Low expression n=126 (%) High expression n=126 (%)
NCOR1 expression 112.33±35.59 103.92±43.00 0.092*
SMRT expression 167.14±41.05 153.82±40.66 0.010*
Age (years) 46.64±17.22 49.56±15.84 0.180*
Gender (Male:Female) 34 (27.0):92 (73.0) 34 (27.0):92 (73.0) 0.999
Tumor size (cm) 3.02±1.64 2.99±1.75 0.960*
MACIS score 5.59±1.66 5.30±1.38 0.173*
Histologic subtype <0.0001
Follicular variant 5 (4.0) 37 (30.3)
Conventional 100 (80.6) 80 (65.6)
Tall cell variant 18 (14.5) 2 (1.6)
Othersς 1 (0.8) 3 (2.5)
Extrathyroidal extension <0.0001
No 65 (57.5) 89 (80.2)
Yes 48 (42.5) 22 (19.8)
Multifocality 0.048
No 73 (58.9) 55 (46.2)
Yes 51 (41.1) 64 (53.8)
T stage 0.013
T1 27 (23.3) 38 (32.8)
T2 33 (28.4) 41 (35.3)
T3 48 (41.4) 33 (28.4)
T4 8 (6.9) 4 (3.4)
N stage <0.0001
N0 36 (33.0) 64 (64.6)
N1 73 (67.0) 35 (35.4)
M stage 0.480
M0 69 (98.6) 59 (96.7)
M1 1 (1.4) 2 (3.3)
TNM stage 0.127
I 63 (53.8) 62 (54.4)
II 5 (4.3) 20 (17.5)
III 33 (28.2) 25 (21.9)
IV 16 (13.7) 7 (6.1)

*p-values calculated using Student’s t-test. Data are mean±SD.

p-values calculated using χ2 test or linear-by-linear association.

ςOthers: columnar cell variant, diffuse sclerosing variant, cribriform-morular variant, etc.

NCOR1: nuclear receptor co-repressor 1, MACIS: distant metastasis, patient age, completeness of resection, local invasion, and tumor size, SMRT: silencing mediator for retinoid or thyroid hormone receptor, SD: standard deviation, TCGA: The Cancer Genome Atlas, THCA: thyroid cancer, THRA: thyroid hormone receptor alpha, TNM: tumor-node- metastasis

Table 2
Clinicopathological characteristics of TCGA THCA dataset according to THRB expression status
Characteristics THRB p-value

Low expression n=126 (%) High expression n=126 (%)
NCOR1 expression 94.22±37.54 120.88±34.07 <0.0001*
SMRT expression 141.19±38.16 176.54±49.18 <0.0001*
Age (years) 43.62±13.84 49.29±15.88 0.004*
Gender (Male:Female) 28 (22.2):98 (77.8) 25 (19.8):101 (80.2) 0.643
Tumor size (cm) 3.00±1.64 2.97±1.61 0.893*
MACIS score 5.01±1.42 5.64±1.65 0.003*
Histologic subtype 0.047
Follicular variant 29 (23.0) 20 (16.0)
Conventional 92 (73.0) 90 (72.0)
Tall cell variant 3 (2.4) 15 (12.0)
Othersς 2 (1.6) 0 (0.0)
Extrathyroidal extension 0.005
No 92 (78.6) 69 (61.6)
Yes 25 (21.4) 43 (38.4)
Multifocality 0.276
No 66 (54.1) 75 (61.0)
Yes 56 (45.9) 48 (39.0)
T stage 0.129
T1 35 (29.4) 32 (27.4)
T2 49 (41.2) 37 (31.6)
T3 32 (26.9) 41 (35.0)
T4 3 (2.5) 7 (6.0)
N stage 0.065
N0 63 (57.8) 46 (45.1)
N1 46 (42.2) 56 (54.9)
M stage 0.941
M0 63 (95.5) 67 (95.7)
M1 3 (4.5) 3 (4.3)
TNM stage 0.040
I 74 (62.2) 56 (47.9)
II 11 (9.2) 13 (11.1)
III 23 (19.3) 34 (29.1)
IV 11 (9.2) 14 (12.0)

*p-values calculated using Student’s t-test. Data are mean±SD.

p-values calculated using χ2 test or linear-by-linear association.

ςOthers: columnar cell variant, diffuse sclerosing variant, cribriform-morular variant, etc.

NCOR1: nuclear receptor co-repressor 1, MACIS: distant metastasis, patient age, completeness of resection, local invasion, and tumor size, SMRT: silencing mediator for retinoid or thyroid hormone receptor, SD: standard deviation, TCGA: The Cancer Genome Atlas, THCA: thyroid cancer, THRB: thyroid hormone receptor beta, TNM: tumor-node- metastasis

Table 3
Comparison of the clinico-pathological characteristics between the high NCOR1/THRA group and high SMRT/THRB group from TCGA THCA
Characteristics NCOR1/THRA n=24 (%) SMRT/THRB n=24 (%) p-value
Age (years) 48.36±14.56 52.78±16.98 0.356*
Gender (Male:Female) 3 (12.5):21 (87.5) 10 (41.7):14 (58.3) 0.023
Tumor size (cm) 2.68±1.50 3.02±1.38 0.475*
MACIS score 5.16±1.24 6.05±2.01 0.097*
Histologic subtype 0.172
Follicular variant 4 (18.2) 1 (4.3)
Conventional 17 (77.3) 18 (78.3)
Tall cell variant 0 (0.0) 4 (17.4)
Othersς 1 (4.5) 0 (0.0)
Extrathyroidal extension 0.028
No 19 (82.6) 12 (52.2)
Yes 4 (17.4) 11 (47.8)
Multifocality 0.555
No 11 (47.8) 13 (56.5)
Yes 12 (52.2) 10 (43.5)
T stage 0.038
T1 9 (39.1) 3 (13.0)
T2 7 (30.4) 7 (30.4)
T3 6 (26.1) 11 (47.8)
T4 1 (4.3) 2 (8.7)
N stage 0.001
N0 17 (81.0) 7 (31.8)
N1 4 (19.0) 15 (68.2)
M stage 0.309
M0 14 (100.0) 13 (92.9)
M1 0 (0.0) 1 (7.1)
TNM stage 0.038
I 14 (63.6) 9 (39.1)
II 3 (13.6) 2 (8.7)
III 4 (18.2) 7 (30.4)
IV 1 (4.5) 5 (21.7)

*p-values calculated using Student’s t-test. Data are mean±SD.

p-values calculated using χ2 test or linear-by-linear association.

ςOthers: columnar cell variant, diffuse sclerosing variant, cribriform-morular variant, etc.

NCOR1: nuclear receptor co-repressor 1, MACIS: distant metastasis, patient age, completeness of resection, local invasion, and tumor size, SMRT: silencing mediator for retinoid or thyroid hormone receptor, SD: standard deviation, TCGA: The Cancer Genome Atlas, THCA: thyroid cancer, THRA: thyroid hormone receptor alpha, THRB: thyroid hormone receptor beta, TNM: tumor-node-metastasis

Table 4
Comparisons of the group from TCGA THCA
Characteristics NCOR1/THRA n=24 (%) SMRT/THRB n=24 (%) p-value
Ras driver mutation 0.018
Absent 18 (78.3) 23 (100.0)
Present 5 (21.7) 0 (0.0)
BRAF driver mutation 0.376
Absent 13 (56.5) 10 (43.5)
Present 10 (43.5) 13 (56.5)
TERT promoter mutation 0.086
Absent 16 (94.1) 13 (72.2)
Present 1 (5.9) 5 (27.8)
RAS/RAF score −0.024±0.71 −0.78±0.23 <0.0001*
ERK score −2.08±18.29 24.25±14.04 <0.0001*
Differentiation score 0.37±1.08 −0.87±1.01 <0.0001*
Tumor status 0.130
Free 23 (100.0) 19 (90.5)
With tumor 0 (0.0) 2 (9.5)

*p-values calculated using Student’s t-test. Data are mean±SD.

p-values calculated using χ2 test or linear-by-linear association.

NCOR1: nuclear receptor co-repressor 1, SMRT: silencing mediator for retinoid or thyroid hormone receptor, SD: standard deviation, TCGA: The Cancer Genome Atlas, THCA: thyroid cancer, THRA: thyroid hormone receptor alpha, THRB: thyroid hormone receptor beta

TOOLS
Similar articles