Journal List > J Korean Med Sci > v.36(47) > 1148437

Kang, Lee, Cha, Kim, Han, and Park: Growth in Exclusively Breastfed and Non-exclusively Breastfed Children: Comparisons with WHO Child Growth Standards and Korean National Growth Charts

Abstract

Background

This study examined the relationship of infant feeding with anthropometric indices of children during their first six years of life relative to the Korean National Growth Charts (KNGC) and the World Health Organization Child Growth Standards (WHO-CGS).

Methods

The study population consisted of 547,669 Korean infants and children who were 6 months-old to 6 years-old (born in 2008–2009) and participated in the National Health Screening Program for Infants and Children. Data on height, weight, and type of feeding during the first 6 months (exclusively breastfed [BF] vs. mixed- or formula-fed [FF]) were analyzed.

Results

BF boys and girls were significantly shorter and lighter than FF counterparts from the age of 6 months to 4 years, but these differences were not significant after the age of 4 years. BF boys and girls only had significantly lower body mass index at the age of 2 years. Under the age of 2 years 6 months, and especially under the age of 1 year, BF boys and girls were significantly taller and heavier than the 50th percentile values of the 50th percentile value of the WHO-CGS.

Conclusion

In this study using large-scaled national data, Korean breastfed children are shorter and lighter by 3 years 6 months–4 years 6 months, but afterward, there is no significant difference from those who had mixed- or formula-feeding. Substantial disparities in the anthropometric indices of Korean infants under the age of 1 compared to KNCG and WHO-CGS were found, regardless of their infantile feeding types. Our results emphasize the importance of constructing a nationwide reference chart based on actual measurements of BF Korean infants.

Graphical Abstract

jkms-36-e315-abf001.jpg

INTRODUCTION

The height and weight of growing children are important indicators of their health and nutritional status. Standardized growth references are helpful in determining whether the physiological growth and development of children are achieved during this critical stage.
The World Health Organization (WHO) published growth charts in 2006 that provided universal standards for “optimal growth” of all healthy breastfed infants worldwide, regardless of geographical origin or ethnicity.1 The WHO Child Growth Standards (WHO-CGS) were developed using data from a multi-center growth reference survey (MGRS) of healthy children who were breastfed at least 4 months after birth in Brazil, Ghana, India, Norway, Oman, and the U.S.1 The WHO-CGS is now the gold standard for growth charts, and many countries have adopted it as a reference for infant and child growth.2 However, several countries reported considerable discrepancies between the WHO-CGS and their own national anthropometric data.3456789
Since 2017, the Korean National Growth Charts (KNGC) for infants and children younger than 3 years-old used the WHO-CGS because of the lack of infant feeding data from the National Anthropometric Survey.10 The WHO-CGS was adopted because the growth of infants is generally similar among ethnic groups, although concerns were raised in some East Asian nations due to the omission of East Asian populations, especially China, Korea, and Japan from the MGRS.
The National Health Screening Program for Infants and Children (NHSPIC) of Korea began in 2007. Its goal was to improve infant health by monitoring the growth and development of infants who were covered by the Korean National Health Insurance Service (NHIS). The NHSPIC adequately represents the Korean pediatric population because coverage by the NHIS is mandatory for all Korean citizens. The NHSPIC conducts seven surveys of children from the age of 4 to 72 months, and this includes anthropometric data and health-related questionnaires that have questions about the type of feeding during infancy.
The present study examined the effect of different types of feeding during infancy on the distribution of key anthropometric indices — height, weight, and body mass index (BMI) — in Korean children during their first six years of life using data from the NHSPIC. We also compared data on these anthropomorphic indices to the established KNGC and WHO-CGS.

METHODS

Study population

This study enrolled Korean children born in 2008 (n = 469,248) and 2009 (n = 448,459) who received at least one of the seven NHSPIC checkups and were followed until 2017. Among all NHSPIC participants, the study population consisted of individuals aged 6 months to 6 years at 6-month intervals. Each age group (6 months, 1 year, 1 year 6 months, 2 years, etc.) included subjects of the specified age up to 30 days after the specified age. Thus, a subject whose age was 1 year 17 days was in the 1 year group. The final study population consisted of 547,669 children after excluding 71,444 without birth weight data, 5,859 twins, 46,772 who had premature births, 27,576 who were in intensive care units for more than 5 days within 3 months of birth, and 1,455 with chromosome abnormalities.

Anthropometric measurements

Each screening at a primary health care clinic recorded weight, height, BMI. Height was measured with the child dressed comfortably and standing upright (if more than 2 years-old) or supine (if less than 2 years-old) and was recorded to the nearest 0.1 cm using a height measuring unit for the former group and a height measuring mat for the latter group. Weight was measured using an electronic scale with the child dressed in simple clothing and was recorded to the nearest 100 g. BMI was calculated as weight divided by height squared (kg/m2).

Demographics

The NHSPIC questionnaire was used to collect information about birth weight and type of feeding during infancy, and the NHIS database was used to obtain data on household income and residential area.
At the initial 6-month checkup, data on the type of feeding were collected in the sub-category of nutrition based on answers to the question, “What have you mainly fed your child?” The possible answers were: “only breast milk,” “only formula milk,” “both formula milk and breast milk,” and “a special formula milk.” For statistical analysis, feeding was classified as exclusively breastfed (BF) or as mixed- or formula-fed (FF). This latter group included only formula milk, both formula milk and breast milk, and special formula milk.
The quartile of household income was determined by the amount of insurance co-payment (1: lowest quartile, 4: highest quartile). The residential area was classified as “Seoul”; “Metropolis” for residents of Busan, Daegu, Incheon, Gwangju, Daejeon, or Ulsan; “Urban” for residents of other cities; and “Rural” for residents of other counties or districts. The NHSPIC questionnaire collected information on birth history, including date of birth, birth weight, and prematurity status.

Statistical analysis

Weight, height, and BMI data are presented as means ± standard deviations (SDs). Participants were classified into different percentiles according to age and sex for height (3, 25, 50, 75, 97) and for weight and BMI (5, 15, 50, 85, 95). The t-test was used to determine the significance of differences in height and weight according to infant feeding type. The z-scores for height and weight were calculated as: (measured value − mean)/SD. All statistical analyses were performed using SAS Enterprise Guide 7.1 (SAS Institute Inc., Cary, NC, USA), and a P value below 0.05 was regarded as significant.

Ethics statement

All procedures were in accordance with the current National Health Insurance Act for the use of de-identified individual data for research purposes. The Institutional Review Board of the Inje University Sanggye Paik Hospital approved the present study with waived informed consent (approval number: SGPAIK 2021-04-007).

RESULTS

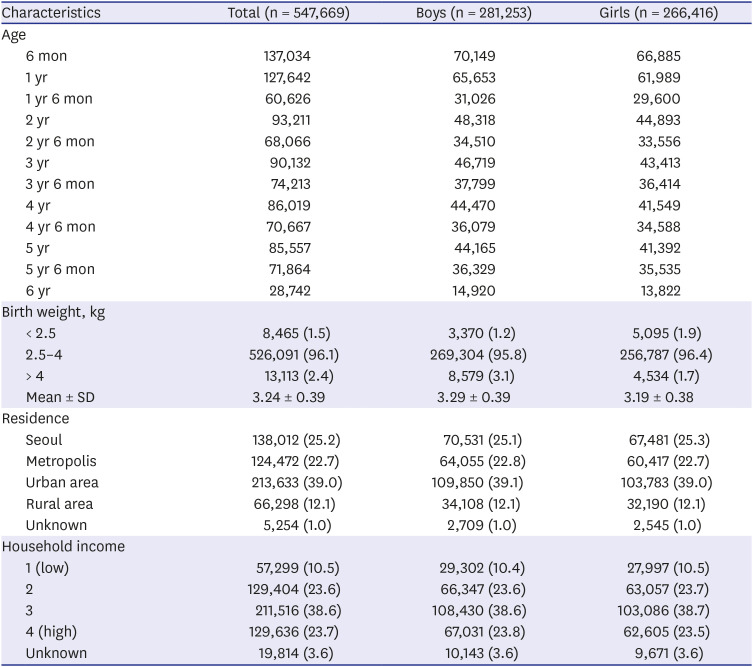
We first analyzed the basic demographic characteristics of the 547,669 study subjects (Table 1). A total of 1.5% of them had birth weights less than 2.5 kg, and 2.4% had birth weights more than 4 kg, most lived in Seoul, another metropolis, or an urban area, and most had household incomes in the second, third, and fourth quartiles. Data on infant feeding were available for 338,210 subjects, 45.2% of whom were BF (Supplementary Table 1).
Table 1

General characteristics of the study population

jkms-36-e315-i001
Characteristics Total (n = 547,669) Boys (n = 281,253) Girls (n = 266,416)
Age
6 mon 137,034 70,149 66,885
1 yr 127,642 65,653 61,989
1 yr 6 mon 60,626 31,026 29,600
2 yr 93,211 48,318 44,893
2 yr 6 mon 68,066 34,510 33,556
3 yr 90,132 46,719 43,413
3 yr 6 mon 74,213 37,799 36,414
4 yr 86,019 44,470 41,549
4 yr 6 mon 70,667 36,079 34,588
5 yr 85,557 44,165 41,392
5 yr 6 mon 71,864 36,329 35,535
6 yr 28,742 14,920 13,822
Birth weight, kg
< 2.5 8,465 (1.5) 3,370 (1.2) 5,095 (1.9)
2.5–4 526,091 (96.1) 269,304 (95.8) 256,787 (96.4)
> 4 13,113 (2.4) 8,579 (3.1) 4,534 (1.7)
Mean ± SD 3.24 ± 0.39 3.29 ± 0.39 3.19 ± 0.38
Residence
Seoul 138,012 (25.2) 70,531 (25.1) 67,481 (25.3)
Metropolis 124,472 (22.7) 64,055 (22.8) 60,417 (22.7)
Urban area 213,633 (39.0) 109,850 (39.1) 103,783 (39.0)
Rural area 66,298 (12.1) 34,108 (12.1) 32,190 (12.1)
Unknown 5,254 (1.0) 2,709 (1.0) 2,545 (1.0)
Household income
1 (low) 57,299 (10.5) 29,302 (10.4) 27,997 (10.5)
2 129,404 (23.6) 66,347 (23.6) 63,057 (23.7)
3 211,516 (38.6) 108,430 (38.6) 103,086 (38.7)
4 (high) 129,636 (23.7) 67,031 (23.8) 62,605 (23.5)
Unknown 19,814 (3.6) 10,143 (3.6) 9,671 (3.6)
Values are presented as number (%).
SD = standard deviation.
Analysis of the height, weight and BMI of boys and girls in different age groups indicated boys were generally 1 cm taller, weighed 0.4 to 0.8 kg more, and had greater BMI (Tables 2, 3, 4). For boys, the 50th percentile BMI decreased slightly between the ages of 2 to 4 years but changed very little between the ages of 4 to 6 years. At the age of 5, girls had the lowest 50th percentile BMI.
Table 2

Mean, SD, and selected percentile values of height (cm) in boys and girls at different ages

jkms-36-e315-i002
Age Boys Girls
Mean ± SD 3p 25p 50p 75p 97p Mean ± SD 3p 25p 50p 75p 97p
6 mon 69.9 ± 2.3 65.8 68.4 70.0 71.5 74.3 68.2 ± 2.3 64.0 66.7 68.1 69.7 72.6
1 yr 77.6 ± 2.6 73.0 76.0 77.5 79.2 82.5 76.1 ± 2.6 71.5 74.3 76.0 77.7 81.0
1 yr 6 mon 83.6 ± 2.9 78.5 81.7 83.5 85.4 89.4 82.2 ± 2.9 77.1 80.3 82.0 84.0 87.8
2 yr 88.5 ± 3.0 83.0 86.5 88.5 90.4 94.0 87.2 ± 3.0 81.6 85.0 87.0 89.3 92.8
2 yr 6 mon 92.3 ± 3.0 86.7 90.3 92.3 94.2 98.1 91.2 ± 3.0 85.5 89.5 91.1 93.0 97.0
3 yr 95.9 ± 3.2 90.1 93.6 95.8 98.0 102.1 94.7 ± 3.1 89.2 92.6 94.6 96.8 100.8
3 yr 6 mon 99.4 ± 3.5 93.0 97.0 99.3 101.6 106.1 98.2 ± 3.4 92.0 95.9 98.1 100.4 104.9
4 yr 102.7 ± 3.7 96.0 100.1 102.7 105.1 110.0 101.6 ± 3.6 95.0 99.2 101.6 104.0 108.6
4 yr 6 mon 106.2 ± 4.0 99.1 103.6 106.1 108.9 113.8 105.1 ± 3.8 98.2 102.5 105.0 107.7 112.5
5 yr 109.6 ± 4.1 102.1 106.8 109.5 112.3 117.5 108.6 ± 4.0 101.2 105.8 108.5 111.2 116.2
5 yr 6 mon 113.1 ± 4.3 105.3 110.1 113.0 116.0 121.4 112.0 ± 4.2 104.3 109.1 112.0 114.9 120.0
6 yr 116.1 ± 4.5 108.0 113.0 116.0 119.1 124.7 115.0 ± 4.4 107.0 112.0 114.8 117.9 123.5
SD = standard deviation.
Table 3

Mean, SD, and selected percentile values of weight (kg) in boys and girls at different ages

jkms-36-e315-i003
Age Boys Girls
Mean ± SD 5p 15p 50p 85p 95p Mean ± SD 5p 15p 50p 85p 95p
6 mon 8.8 ± 1.0 7.1 7.1 8.5 9.5 10.0 8.2 ± 0.9 6.5 7.0 7.8 8.7 9.4
1 yr 10.4 ± 1.1 8.6 8.6 10.2 11.3 12.0 9.8 ± 1.0 8.0 8.5 9.5 10.5 11.3
1 yr 6 mon 11.7 ± 1.2 9.8 9.8 11.5 13.0 13.9 11.1 ± 1.2 9.3 9.8 11.0 12.2 13.0
2 yr 12.8 ± 1.4 10.7 10.7 12.5 14.0 15.0 12.2 ± 1.3 10.0 10.7 12.0 13.2 14.2
2 yr 6 mon 13.9 ± 1.5 11.7 11.7 13.8 15.4 16.5 13.5 ± 1.5 11.1 12.0 13.2 14.8 15.9
3 yr 14.9 ± 1.7 12.2 12.2 14.5 16.0 17.3 14.3 ± 1.6 12.0 12.8 14.2 16.0 17.0
3 yr 6 mon 16.0 ± 1.9 13.3 13.3 15.7 17.7 19.0 15.4 ± 1.8 12.9 13.7 15.2 17.1 18.5
4 yr 17.0 ± 2.1 14.0 14.0 16.5 18.5 20.0 16.5 ± 2.0 13.7 14.6 16.2 18.4 19.9
4 yr 6 mon 18.3 ± 2.5 15.0 15.0 18.0 20.4 22.7 17.8 ± 2.3 14.5 15.5 17.5 19.8 21.7
5 yr 19.4 ± 2.8 15.9 15.9 19.0 22.0 24.5 18.8 ± 2.5 15.3 16.4 18.5 21.0 23.3
5 yr 6 mon 20.8 ± 3.4 16.8 16.8 20.2 23.7 27.0 20.1 ± 3.0 16.2 17.3 19.7 22.9 25.5
6 yr 22.0 ± 3.7 17.5 17.5 21.3 25.3 29.2 21.2 ± 3.3 17.0 18.1 20.6 24.2 27.4
SD = standard deviation.
Table 4

Mean, SD, and selected percentile values of body mass index (kg/m2) in boys and girls at different ages

jkms-36-e315-i004
Age Boys Girls
Mean ± SD 5p 15p 50p 85p 95p Mean ± SD 5p 15p 50p 85p 95p
2 yr 16.36 ± 1.4 14.32 15.02 16.28 17.70 18.68 15.98 ± 1.4 13.95 14.67 15.91 17.32 18.30
2 yr 6 mon 16.29 ± 1.4 14.27 14.96 16.20 17.61 18.54 15.97 ± 1.4 13.95 14.65 15.91 17.29 18.27
3 yr 16.18 ± 1.3 14.28 14.92 16.08 17.43 18.40 15.92 ± 1.3 14.00 14.65 15.84 17.22 18.15
3 yr 6 mon 16.16 ± 1.4 14.21 14.86 16.04 17.42 18.44 15.98 ± 1.3 14.00 14.67 15.88 17.28 18.24
4 yr 16.10 ± 1.4 14.18 14.79 15.96 17.34 18.41 15.91 ± 1.3 13.96 14.60 15.79 17.20 18.18
4 yr 6 mon 16.12 ± 1.5 14.09 14.73 15.93 17.46 18.73 15.92 ± 1.5 13.88 14.54 15.77 17.26 18.43
5 yr 16.12 ± 1.6 14.04 14.66 15.87 17.49 19.03 15.87 ± 1.5 13.81 14.43 15.69 17.27 18.57
5 yr 6 mon 16.23 ± 1.9 13.97 14.61 15.90 17.79 19.74 15.96 ± 1.7 13.75 14.38 15.70 17.50 19.05
6 yr 16.29 ± 2.0 13.95 14.57 15.89 17.98 20.16 15.98 ± 1.8 13.65 14.31 15.68 17.61 19.34
SD = standard deviation.
Comparison of the BF and FF groups indicated the BF group had a higher proportion of girls (50.9% vs. 46.5%), was significantly heavier, was more likely to live in Seoul, and had a higher household income (Supplementary Table 1).
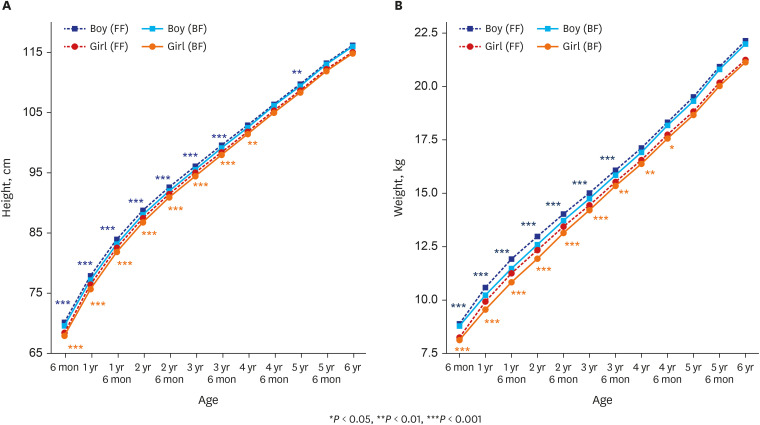
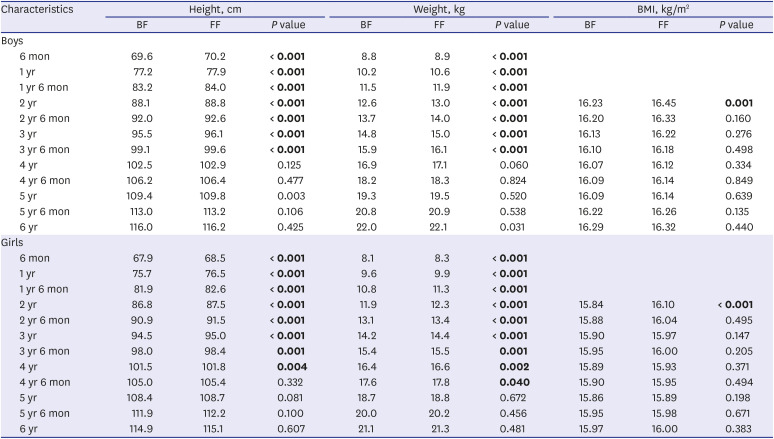
We then compared the anthropometric indices of boys and girls who were BF and FF (Table 5 and Fig. 1). The results indicated that BF boys and girls were significantly shorter from the age 6 months to 3 years 6 months. In both sexes, this height disparity at the age of 6 months was 0.6 cm, and increased to 0.8 cm at the age of 1 year 6 months. After the age of 2 years, this difference in height decreased, and there were no significant differences after the age of 4 years in boys and after the age of 4 years 6 months in girls. Analysis of body weight indicated that BF children weighed significantly less from the age of 6 months to 3 years 6 months (boys) and 4 years 6 months (girls). The weight disparity was only 0.1 to 0.2 kg at the age of 6 months, increased to 0.4 to 0.5 kg at the age of 1 to 2 years, then decreased with age and was no longer significantly different in boys older than 4 years and girls older than 5 years. For all ages, the mean BMI of FF children was greater than that of BF children, but this difference was only statistically significant for boys and girls who were 2 years-old (both P < 0.05). The lowest BMI in both feeding types was at the age of 4 years in boys and 5 years in girls.
Table 5

Effect of infant feeding type on mean height, weight, and body mass index in boys and girls at different ages

jkms-36-e315-i005
Characteristics Height, cm Weight, kg BMI, kg/m2
BF FF P value BF FF P value BF FF P value
Boys
6 mon 69.6 70.2 < 0.001 8.8 8.9 < 0.001
1 yr 77.2 77.9 < 0.001 10.2 10.6 < 0.001
1 yr 6 mon 83.2 84.0 < 0.001 11.5 11.9 < 0.001
2 yr 88.1 88.8 < 0.001 12.6 13.0 < 0.001 16.23 16.45 0.001
2 yr 6 mon 92.0 92.6 < 0.001 13.7 14.0 < 0.001 16.20 16.33 0.160
3 yr 95.5 96.1 < 0.001 14.8 15.0 < 0.001 16.13 16.22 0.276
3 yr 6 mon 99.1 99.6 < 0.001 15.9 16.1 < 0.001 16.10 16.18 0.498
4 yr 102.5 102.9 0.125 16.9 17.1 0.060 16.07 16.12 0.334
4 yr 6 mon 106.2 106.4 0.477 18.2 18.3 0.824 16.09 16.14 0.849
5 yr 109.4 109.8 0.003 19.3 19.5 0.520 16.09 16.14 0.639
5 yr 6 mon 113.0 113.2 0.106 20.8 20.9 0.538 16.22 16.26 0.135
6 yr 116.0 116.2 0.425 22.0 22.1 0.031 16.29 16.32 0.440
Girls
6 mon 67.9 68.5 < 0.001 8.1 8.3 < 0.001
1 yr 75.7 76.5 < 0.001 9.6 9.9 < 0.001
1 yr 6 mon 81.9 82.6 < 0.001 10.8 11.3 < 0.001
2 yr 86.8 87.5 < 0.001 11.9 12.3 < 0.001 15.84 16.10 < 0.001
2 yr 6 mon 90.9 91.5 < 0.001 13.1 13.4 < 0.001 15.88 16.04 0.495
3 yr 94.5 95.0 < 0.001 14.2 14.4 < 0.001 15.90 15.97 0.147
3 yr 6 mon 98.0 98.4 0.001 15.4 15.5 0.001 15.95 16.00 0.205
4 yr 101.5 101.8 0.004 16.4 16.6 0.002 15.89 15.93 0.371
4 yr 6 mon 105.0 105.4 0.332 17.6 17.8 0.040 15.90 15.95 0.494
5 yr 108.4 108.7 0.081 18.7 18.8 0.672 15.86 15.89 0.198
5 yr 6 mon 111.9 112.2 0.100 20.0 20.2 0.456 15.95 15.98 0.671
6 yr 114.9 115.1 0.607 21.1 21.3 0.481 15.97 16.00 0.383
BF = breastfed, FF = mixed- or formula-fed, BMI = body mass index.
P values marked with bold indicate statistically significant P values.
Fig. 1

Mean height (A) and weight (B) of BF and FF boys and girls at different ages.

BF = breastfed, FF = mixed- or formula-fed.
jkms-36-e315-g001
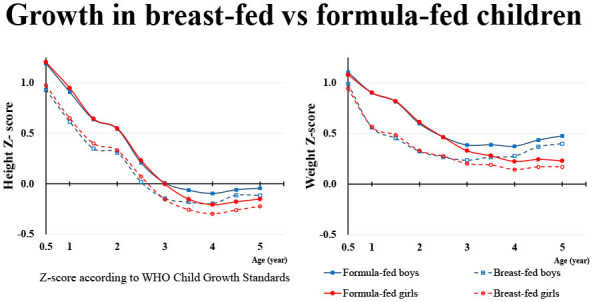
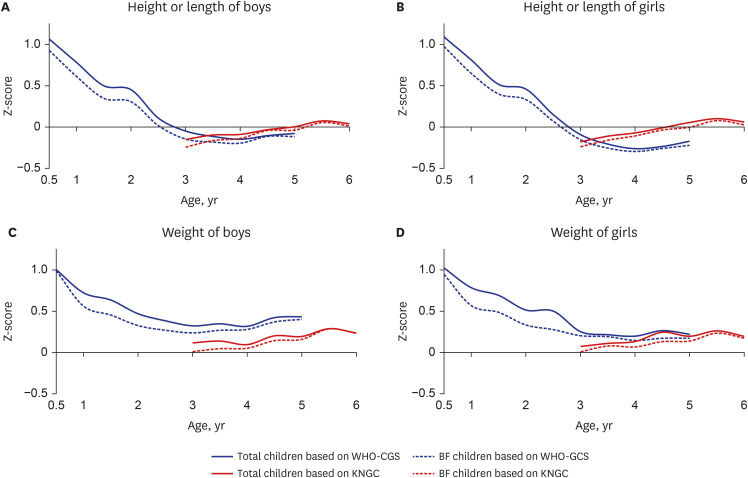
We then determined the mean z-scores for length or height (length for age z-score [LAZ] or height for age z-score [HAZ]) and weight (weight for age z-score [WAZ]) of boys and girls according to the feeding types (total vs. breastfeeding) and age using the WHO-GCS and KNGC standards (Fig. 2). Based on the WHO-GCS, at the age of 6 months the mean LAZ was close to +1 regardless of feeding types, with slightly lower scores for BF infants. The LAZ gradually decreased until the age of about 3 years and then remained relatively steady at about −0.1 for boys and about −0.2 for girls, again with slightly lower scores for BF infants. Also, based on the WHO-GCS, the mean WAZ for boys and girls had similar changes over time as the LAZ, but the WAZ stabilized at about +0.3 for boys and at about +0.2 for girls. Notably, when the LAZ/HAZ and the WAZ were calculated for children over 3 years old using the KNGC, they were nearly all closer to zero.
Fig. 2

(A, B) Mean Z-scores of length/height and (C, D) weight of all children (solid lines) and BF children (dashed lines) based on the WHO-CGS (blue lines) and the KNGC (red lines).

WHO-CGS = World Health Organization Child Growth Standards, KNGC = Korean National Growth Charts, BF = breastfed.
jkms-36-e315-g002

DISCUSSION

In this study, we analyzed the anthropometric indices of height, weight, and BMI of Korean children aged 6 months to 6 years using a nationally representative dataset. Our comparisons of BF and FF children indicated that BF boys were significantly shorter and lighter from the age 6 months to 3 years 6 months, and girls were significantly shorter from the age of 6 months to 4 years and lighter from the age of 6 months to 4 years 6 months. FF children had a higher mean BMI than BF children at all ages, but this difference was only significant for 2-year-old boys and girls. We also used the WHO-CGS and the KNGC to determine mean z-scores for height and weight of different ages of boys and girls and to compare the growth of BF and FF children.
BF children were shorter than FF children from the age 6 months to 3 years 6 months–4 years, but there were no differences after the age of 4 years-4 years 6 months. Very few other studies examined the effect of infant feeding type on the height of children, and most of these studies only studied subjects up to the age of 12 months. This could be because children over the age of 12–24 months stop breastfeeding and switch to a regular diet, so breastfeeding has less of an impact on subsequent growth. Even though direct comparisons are difficult due to differences in study design and the age range of subjects, our findings are comparable with a cross-sectional study from China11 and longitudinal studies from China12 and Germany.13 These studies and our results all found that FF children were significantly taller than BF children (0.2–1.0 cm) at the age of 6 to 12 months. However, other studies of this topic have reported contradictory results. In particular, a longitudinal study from the Netherlands14 reported no significant difference in length at 7 months and another study15 reported no significant difference in length at 13 months. In our study, the height difference between BF and FF children was not significant after the age of 4 years. Only one previous study compared the height of BF and FF children after the age of 4 years.14 This previous study of Dutch children aged 5 to 6 years reported that those who were BF during infancy were shorter than FF children, but they were taller after adjusting for height and weight during infancy.14 Our findings and those of this Dutch study suggest there might be physiological compensations for growth deficits associated with breastfeeding after children reach the age of 4 years.
We observed that BF children were lighter than FF children from the age of 6 months to 3 years 6 months in boys and to 4 years 6 months in girls. Several other studies reported that FF children tended to be heavier or gain weight more rapidly than BF children during the first 12 to 24 months of life,11141617181920212223 although some other studies found no significant differences.111215 Previous longitudinal studies reported that the faster weight gain in FF infants was significant from the age of two months.131721 Notably, no previous research examined the effect of the type of infant feeding after the age of 24 months. We found statistically significant but small weight differences (0.1–0.3 kg) between FF and BF children after the age of 2 years. Furthermore, the difference in BMI between FF and BF children was only evident at the age of 2 years, and was not significant at later ages.
Many previous investigations have examined why FF infants are heavier and gain weight faster than BF infants. Several studies attributed this to greater protein intake by FF infants. The DARLING study found that an FF group consumed 66 to 70% more protein than a BF group during the first 6 months of age.24 Another study reported that the use of a low-protein formula lowered the risk of obesity in school-age children.25 A second possibility is that BF children may have better self-control of feeding. In other words, BF infants may be better able to control the timing and content of their own feeding than FF infants, whose feeding may be more controlled by their parents. There is evidence that better self-regulation of eating by children who were BF may reduce problematic feeding behaviors and the risk of obesity.26 In agreement, another study reported that FF infants were likely to consume more milk and food than BF infants.27 Other research suggested that differences in gut microbiota composition28 and hormone levels29 between BF and FF infants may be responsible for growth disparities.
The KNGC adopted the WHO-CG in 2017 for Korean infants and children aged less than 3 years-old. Our analysis of z-scores demonstrated that at the age of 6 months to 1 year, the mean LAZ/WAZ based on all children in the WHO-GCS exceeded +0.5, an unacceptable discrepancy.10 This difference was smaller but also present in BF infants. Therefore, the use of the WHO-CG in the KNGC for Korean infants less than 1 year-old may lead to overestimating growth and an inaccurate assessment of health and nutritional status, regardless of feeding type. Studies in other countries also concluded that it was inappropriate to use the WHO-CGS as a growth standard for children in their countries. For example, a Japanese study used the WHO-GCS and found the study population was generally shorter and lighter,2 in that the LAZ values ranged from approximately from −0.9 to −0.5, and the WAZ values ranged from −0.6 to −0.1.5 A Chinese study that used the WHO-GCS reported the WAZ ranged from +0.1 to +0.7, and that the LAZ/HAZ also ranged from +0.1 to +0.7.3 In addition, children from Norway (range of LAZ/HAZ: 0–1, range of WAZ: 0.1–0.9) and Greenland (range of LAZ/HAZ: 0–1.3, range of WAZ: 0.7–0.9) were generally taller and heavier than the WHO-GCS standard.48 Our findings thus emphasize the need to establish national reference charts based on actual measurements of Korean BF infants.
This study had some limitations. Our database enrolled all participants who responded to at least one of the surveys, so it had both a longitudinal component (participants in all seven NHSPIC surveys) and a cross-sectional component (participants in at least one survey). We had no data on whether breastfeeding continued after the age of 6 months or on complementary food intake. Nevertheless, our study presented the most recent large-scaled data comparing growth of BF vs. non-BF children.
In conclusion, until the age of 4 years, BF Korean children were shorter and lighter than FF Korean children, but these two groups had no significant differences at older ages. The WHO-GCS considerably overestimates the height and weight of Korean infants, regardless of feeding type during infancy. These results highlight the importance of developing a national reference chart based on measurements of Korean BF infants.

Notes

Funding: This work was supported by a National Research Foundation grant from the Korean Ministry of Science and ICT (NRF2020R1F1A1076452). The funders had no role in study design, data collection, data analysis, data interpretation, or writing of the report.

Disclosure: The authors have no potential conflicts of interest to disclose.

Author Contributions:

  • Conceptualization: Kim SH, Park MJ.

  • Formal analysis: Cha HR.

  • Funding acquisition: Lee SW, Han MY.

  • Investigation: Kang S, Park MJ.

  • Software: Lee SW.

  • Visualization: Kang S, Kim SH, Park MJ.

  • Writing - original draft: Kang S.

  • Writing - review & editing: Kim SH, Han MY, Park MJ.

References

1. WHO Multicentre Growth Reference Study Group. Breastfeeding in the WHO Multicentre Growth Reference Study. Acta Paediatr Suppl. 2006; 450:16–26. PMID: 16817675.
2. de Onis M, Onyango A, Borghi E, Siyam A, Blössner M, Lutter C, et al. Worldwide implementation of the WHO Child Growth Standards. Public Health Nutr. 2012; 15(9):1603–1610. PMID: 22717390.
crossref
3. Tian Q, Gao X, Sha T, He Q, Cheng G, Wu X, et al. Differences between WHO Growth Standards and China Growth Standards in assessing the nutritional status of children aged 0–36 months old. Int J Environ Res Public Health. 2019; 17(1):251.
crossref
4. Kløvgaard M, Nielsen NO, Sørensen TL, Bjerregaard P, Olsen B, Júlíusson PB, et al. Growth of children in Greenland exceeds the World Health Organization growth charts. Acta Paediatr. 2018; 107(11):1953–1965. PMID: 29693738.
crossref
5. Inokuchi M, Matsuo N, Takayama JI, Hasegawa T. WHO 2006 Child Growth Standards overestimate short stature and underestimate overweight in Japanese children. J Pediatr Endocrinol Metab. 2018; 31(1):33–38. PMID: 29267170.
crossref
6. Kułaga Z, Grajda A, Gurzkowska B, Góźdź M, Wojtyło M, Swiąder A, et al. Polish 2012 growth references for preschool children. Eur J Pediatr. 2013; 172(6):753–761. PMID: 23371392.
crossref
7. Bonthuis M, van Stralen KJ, Verrina E, Edefonti A, Molchanova EA, Hokken-Koelega AC, et al. Use of national and international growth charts for studying height in European children: development of up-to-date European height-for-age charts. PLoS One. 2012; 7(8):e42506. PMID: 22916131.
crossref
8. Júlíusson PB, Roelants M, Hoppenbrouwers K, Hauspie R, Bjerknes R. Growth of Belgian and Norwegian children compared to the WHO growth standards: prevalence below −2 and above +2 SD and the effect of breastfeeding. Arch Dis Child. 2011; 96(10):916–921. PMID: 19948662.
9. Hui LL, Schooling CM, Cowling BJ, Leung SS, Lam TH, Leung GM. Are universal standards for optimal infant growth appropriate? Evidence from a Hong Kong Chinese birth cohort. Arch Dis Child. 2008; 93(7):561–565. PMID: 17556396.
crossref
10. Kim JH, Yun S, Hwang SS, Shim JO, Chae HW, Lee YJ, et al. The 2017 Korean National Growth Charts for children and adolescents: development, improvement, and prospects. Korean J Pediatr. 2018; 61(5):135–149. PMID: 29853938.
crossref
11. Zong XN, Li H, Zhang YQ, Wu HH. Growth performance comparison of exclusively breastfed infants with partially breastfed and formula fed infants. PLoS One. 2020; 15(8):e0237067. PMID: 32817664.
crossref
12. Jia N, Gu G, Zhao L, He S, Xiong F, Chai Y, et al. Longitudinal study of breastfeeding and growth in 0–6 month infants. Asia Pac J Clin Nutr. 2018; 27(6):1294–1301. PMID: 30485929.
13. Rebhan B, Kohlhuber M, Schwegler U, Fromme H, Abou-Dakn M, Koletzko BV. Breastfeeding duration and exclusivity associated with infants' health and growth: data from a prospective cohort study in Bavaria, Germany. Acta Paediatr. 2009; 98(6):974–980. PMID: 19484835.
crossref
14. de Beer M, Vrijkotte TG, Fall CH, van Eijsden M, Osmond C, Gemke RJ. Associations of infant feeding and timing of linear growth and relative weight gain during early life with childhood body composition. Int J Obes. 2015; 39(4):586–592.
crossref
15. Aarts C, Kylberg E, Hofvander Y, Gebre-Medhin M. Growth under privileged conditions of healthy Swedish infants exclusively breastfed from birth to 4–6 months: a longitudinal prospective study based on daily records of feeding. Acta Paediatr. 2003; 92(2):145–151. PMID: 12710638.
crossref
16. Anderson CE, Whaley SE, Crespi CM, Wang MC, Chaparro MP. Every month matters: longitudinal associations between exclusive breastfeeding duration, child growth and obesity among WIC-participating children. J Epidemiol Community Health. 2020; 74(10):785–791. PMID: 32611693.
crossref
17. Cheng TS, Kwok MK, Leung GM, Schooling CM. The associations of breast feeding with infant growth and body mass index to 16 years: ‘Children of 1997’. Paediatr Perinat Epidemiol. 2018; 32(2):200–209. PMID: 29281121.
18. Bell KA, Wagner CL, Feldman HA, Shypailo RJ, Belfort MB. Associations of infant feeding with trajectories of body composition and growth. Am J Clin Nutr. 2017; 106(2):491–498. PMID: 28659299.
crossref
19. Küpers LK, L'Abée C, Bocca G, Stolk RP, Sauer PJ, Corpeleijn E. Determinants of weight gain during the first two years of life--the GECKO Drenthe birth cohort. PLoS One. 2015; 10(7):e0133326. PMID: 26192417.
crossref
20. Tanaka H, Ishii H, Yamada T, Akazawa K, Nagata S, Yamashiro Y. Growth of Japanese breastfed infants compared to national references and World Health Organization Growth Standards. Acta Paediatr. 2013; 102(7):739–743. PMID: 23577778.
crossref
21. Gunnarsdottir I, Schack-Nielsen L, Michaelsen KF, Sørensen TI, Thorsdottir I; NordNet Study Group. Infant weight gain, duration of exclusive breast-feeding and childhood BMI - two similar follow-up cohorts. Public Health Nutr. 2010; 13(2):201–207. PMID: 19607745.
crossref
22. de Onis M, Onyango AW. The Centers for Disease Control and Prevention 2000 growth charts and the growth of breastfed infants. Acta Paediatr. 2003; 92(4):413–419. PMID: 12801105.
23. Cole TJ, Paul AA, Whitehead RG. Weight reference charts for British long-term breastfed infants. Acta Paediatr. 2002; 91(12):1296–1300. PMID: 12578284.
crossref
24. Heinig MJ, Nommsen LA, Peerson JM, Lonnerdal B, Dewey KG. Energy and protein intakes of breast-fed and formula-fed infants during the first year of life and their association with growth velocity: the DARLING Study. Am J Clin Nutr. 1993; 58(2):152–161. PMID: 8338041.
crossref
25. Weber M, Grote V, Closa-Monasterolo R, Escribano J, Langhendries JP, Dain E, et al. Lower protein content in infant formula reduces BMI and obesity risk at school age: follow-up of a randomized trial. Am J Clin Nutr. 2014; 99(5):1041–1051. PMID: 24622805.
crossref
26. Bartok CJ, Ventura AK. Mechanisms underlying the association between breastfeeding and obesity. Int J Pediatr Obes. 2009; 4(4):196–204. PMID: 19922033.
crossref
27. Li R, Fein SB, Grummer-Strawn LM. Do infants fed from bottles lack self-regulation of milk intake compared with directly breastfed infants? Pediatrics. 2010; 125(6):e1386–e1393. PMID: 20457676.
crossref
28. Castanys-Muñoz E, Martin MJ, Vazquez E. Building a beneficial microbiome from birth. Adv Nutr. 2016; 7(2):323–330. PMID: 26980815.
crossref
29. Thompson AL. Developmental origins of obesity: early feeding environments, infant growth, and the intestinal microbiome. Am J Hum Biol. 2012; 24(3):350–360. PMID: 22378322.
crossref

SUPPLEMENTARY MATERIAL

Supplementary Table 1

Demographic characteristics of BF children and FF children
jkms-36-e315-s001.doc
TOOLS
Similar articles