

 PDF
PDF Citation
 Print
Print


INTRODUCTION
“Indonesia is the largest and, arguably, the most important country in the Western Pacific region when it comes to marine resources” [1]. In Indonesia, fish is mainly recommended as source of protein, the source of fatty acids. In 2019, the Indonesian Ministry of Marine Affairs and Fisheries has targeted that Indonesian fish consumption is 54.49 kg per capita per year [2] or approximately 150 g per day, which increased about 7% from 2017 of 47.12 kg per capita per year [2]. It has been reported that in 2015, seafood consumption of Indonesians is roughly 32 kg per capita per year, which is nearly double the global average of 19 kg per capita per year [3]. In some isolated areas, seafood can contribute up to 90% of the protein requirements for the local population [1], while in inland areas, it can be very low. For example in Surakarta City, according to the 2014 data obtained from the Agriculture Agency of Surakarta City, fish consumption of people in Surakarta has been reported of 3.8 kg per capita per year, which is only about 12% of the 2015 national seafood consumption of Indonesian.
Fish, besides being a good source of protein, is also considered as the main source of omega-3 long chain polyunsaturated fatty acids (n-3 LCPUFA) including eicosapentaenoic acid, docosapentaenoic acid and docosahexaenoic acid (DHA). The n-3 LCPUFA are required in several neuronal processes affecting on cellular signalling pathway, enzyme activities, receptor systems, membrane structures and dynamics that results in optimal neurological development, maintenance of the nervous system and slows cognitive decline through aging and thereby having optimal cognition throughout the lifespan [4]. The accretion of DHA in the brain continues up to 2 yrs of age and progressively rises in the cerebral cortex until 18 yrs of age [56], even in life span [7]. Hence, sufficient intake of n-3 LCPUFA is fundamental, not only during the growth spurt period, but also across the age to maintain optimal health [8].
The n-3 LCPUFA contents in fish are initially produced by small aquatic plans, marine micro-algae that are consumed at the bottom of the marine food chain, accumulated in the fish/seafood chain [9]. This may explain why oily fish such as mackerel, herring, anchovies, sardines, tuna, salmon and oyster are the richest food sources of n-3 LCPUFA [9]. Fish and/or seafood consumption can be influenced by many factors which may have important roles in improvement of n-3 LCPUFA intake. A number of barriers have been reported in relation to the fish and seafood consumption from in-lands countries, such as difficulty in buying, preparing and cooking of fish, price, and unpleasant physical properties of some varieties of fish (e.g., bones and smell) [10]. Negative attitudes towards fish including smell and the accompaniments, and fear to finding bones also has been also reported as barriers to consume fish [11]. In contrast, increasing positive attitude towards fish consumption has been found to strongly influence the motivation to consume marine products [11]. Age group, gender, education background and marital status have also been reported to influence fish consumption [12]. This evidence showed that organoleptic properties of fish and the health benefits may also influence mother/parents in serving fish as family menu. Unfortunately, limited data of these variable has been reported from marine countries such as Indonesia.
The aims of the research were to analyse the adequacy fish consumption of children in Surakarta, Indonesia, based on their mother's perspective of fish including the health benefits and processing technique of fish-related knowledge, and organoleptic properties of fish-related attitude This information will be useful in order to design strategies to optimize the beneficial effects of consuming fish.
Go to : 
SUBJECTS AND METHODS
Ethical approval
The study protocol was approved by the Ethical Commission of Medical Research, Faculty of Medicine Universitas Muhammadiyah Surakarta (preference number: 713/B.1/KEPK-FKUMS/VI/2017). All participants completed written informed consent prior data collection.
Study design
An observational study with cross-sectional design was conducted from July until September 2017 in Surakarta City, Central Java, Indonesia. Multi-stage random sampling was applied to select a district from 5 districts in the city, followed by the selection of 8 schools from 21 public primary schools and children (grade 3–6) in each selected school. Each randomly selected child with her/his parent were invited to participate in this study through an invitation letter was given to each child in her/his class. A validated self-administrative questionnaire and a validated food frequency questionnaire (FFQ) [13] together with a fish picture book were given to the mothers and their children, respectively after obtaining their informed consents. The children were asked to complete the FFQ at home under mother supervision. The food picture book was used to assist children in estimating food portion size they eaten. A total of 231 elementary school children grades 3–6 with their mothers were participated in this study and completed the survey. No monetary incentive award was provided to the respondents.
The mothers' perspective of fish data
The mothers' perspectives of fish data including the health benefits and processing technique of fish-related knowledge, and organoleptic properties of fish-related attitude. A validated self-administrative questionnaire was used to collect the data. The questionnaire divided into 4 sections: socioeconomic characteristics (educational background and occupation of mother); health benefits of fish-related knowledge [8914151617] (consisted of 22 closed-questions with dichotomous answers, yes/no); fish processing technique-related knowledge [1418192021] (consisted of 20 questions with dichotomous answers, yes/no); and organoleptic properties of fish-related attitude (consisted of 30 questions based preliminary study [14222324] and interview to 50 participants [unpublished data] with 5-Likert scale: strongly disagree, disagree, neutral, agree, strongly agree) (Table 1).

Table 1
List of domains in the questionnaire
| A. Health benefits of fish-related knowledge [8914151617] | ||
| 1. | Fish contains a lot of DHA. | |
| 2. | Adequate intake of DHA supports concentration of children in learning and improve their school performance. | |
| 3. | Electronic media, mass media and other people's experiences can be a source of knowledge to know the health benefits of fish. | |
| 4. | Fish contains proteins that are easily absorbed in the human body. | |
| 5. | Fish protein is easily absorbed due to their high fibre content. | |
| 6. | The aging process could be delayed by consuming fish, because fish contains vitamin E. | |
| 7. | Phosphorus content in fish is good for maintaining the children's dental health. | |
| 8. | Sufficient intake of DHA can help the formation of fetal brain. | |
| 9. | Long chain omega-3 unsaturated fatty acids are majority found from sea food, such as tuna, salmon, oysters and sardines. | |
| 10. | Livestock meat, poultry meat and eggs are also the sources of omega-3 unsaturated fatty acids. | |
| 11. | Child's brain development is influenced by the consumption of foods containing DHA. | |
| 12. | Eggs contains a lot of DHA which can be an alternative source of omega-3 long chain polyunsaturated fatty acids when fish unavailable. | |
| 13. | The more consumption of oily-fish, the higher level of EPA and DHA in the human blood. | |
| 14. | Omega-3 are semi-essential fatty acids consisted of EPA, DPA and DHA. These fatty acids can be produced by the human body but in a very small amount. | |
| 15. | EPA and DHA play a role in the nerve development and vital organs including brain, eyes and heart muscle. | |
| 16. | Folic acid plays a pivotal role for organ development of fetus than DHA. | |
| 17. | The recommendation of fish/seafoods consumption for pregnant woman is the same with non-pregnant woman of 500 mg per day (EPA plus DHA). | |
| 18. | Cognitive performance of children who were born by mother consumed EPA and DHA supplementation during her pregnancy period is better than they were born by mother without EPA and DHA supplementation. | |
| 19. | Eating fish at least once a week can reduce the risk of heart disease. | |
| 20. | The risk of heart disease can be delayed by consuming seafoods containing EPA and DHA. | |
| 21. | Children who are accustomed to get their fat intake from fish oil, fish/seafood tend to have the risk of overweight or obesity. | |
| 22. | Incidence of allergic in infants can be reduced by supplementing EPA and DHA. | |
| B. Fish processing technique-related knowledge [1418192021] | ||
| 1. | The boiling process of food included fish can affect the quality and nutritional value of the food. | |
| 2. | The use of high temperatures in the boiling process can cause a decrease in the nutrients content including fat content of fish. | |
| 3. | The length of boiling also affects the decrease in nutrients content including fat contents of fish. | |
| 4. | Fried processing technique affect the nutrients content of fish including contents of fat, EPA and DHA. | |
| 5. | The quality of cooking oil used more than twice is still good. | |
| 6. | Repeatedly excessive heating above 90°C can damage the fish aroma. | |
| 7. | The bad odor of processed fish products can be caused by less hygienic processing techniques. | |
| 8. | The waste produced in processing fish can have a negative impact on the environment if it is not managed properly. | |
| 9. | Parts of the fish head can be processed as chips that contain of calcium. | |
| 10. | Fish skin can be processed into crispy fish skin. | |
| 11. | Filleting of fish can be done when the fish condition is still fresh. | |
| 12. | Filleting of fish should be done with special techniques. | |
| 13. | The taste of fish may not be delicious. | |
| 14. | Fish have a taste that resembles the smell of soil; hence it is necessary to add special spices during processing of the fish. | |
| 15. | Fish have bones and spines that risk to injure the throat. | |
| 16. | Fish bones and spines can be removed in an easy way. | |
| 17. | Processed boneless fish products are more practical and attract children's interest. | |
| 18. | Weeding of fish aimed to remove the fish stomach content. | |
| 19. | Averrhoa bilimbi or Belimbing wuluh (in Indonesian language) can be used to reduce fishy odor before processing the fish. | |
| 20. | The fishy odor of fish can be reduced by adding spices during processing. | |
| C. Organoleptic properties of fish-related attitude (preliminary study: interview to 50 participants-unpublished data [14222324]) | ||
| 1. | Fish is not suitable for a family menu because it can cause nausea. | |
| 2. | Cooked fish usually has a bit bitter taste that children do not like. | |
| 3. | Taste of fish is suitable for being combined with all kinds of dishes. | |
| 4. | Even though I often provide fish in family menus, my family never feel bored with the taste. | |
| 5. | Fish is always the main menu in every event of my family. | |
| 6. | Fish processed by chopping will reduce the specific taste of fish. | |
| 7. | My family members do not like the taste of fish. | |
| 8. | The strong taste of fish can improve children's appetite. | |
| 9. | The taste of fish is not delicious. | |
| 10. | All fresh and processed fish have a fishy odor. | |
| 11. | When I smell fish, I immediately avoid it. | |
| 12. | If the smell of fish is fishy, I immediately throw it away. | |
| 13. | The smell of fresh fish makes me sick. | |
| 14. | The smell of canned fish is better than raw fish. | |
| 15. | The aroma of fish will remain fishy even though it has been processed. | |
| 16. | The aroma of fish will disappear when cooked in combination with other food ingredients. | |
| 17. | Fish has a smell like soil that will remain in their meat even though it has been processed. | |
| 18. | The color of the fish looks dirty because it's mixed with a lot of dirt. | |
| 19. | Fish usually contains non-food coloring. | |
| 20. | Fish is identical with unpleasant food. | |
| 21. | The color of the fish does not attract the child's attention when served. | |
| 22. | The color combination between fish and other foods is really difficult. | |
| 23. | The color of cooked fish will turn brown, therefore less attractive to the children's appetite. | |
| 24. | Fish bones can hurt the throat. | |
| 25. | It is very difficult to separate the bones and meat of fish for children's menu. | |
| 26. | Fish bones can be removed easily. | |
| 27. | I do not consume fish because the content of the fish bones. | |
| 28. | A fish stomach is smelly, it makes me reluctant to separate them from its meat. | |
| 29. | The texture of fish is soft and slimy which causes slipperiness so it is difficult to hold. | |
| 30. | I feel bothered when consuming fish due to making my hands dirty. | |
![]()
There were 3 steps in the development of items in the questionnaire, namely item development, scale development, and scale evaluation [25]. Item development included identification of domains and item generation and consideration of content validity. A total 72 constructs of the questionnaire were developed based on thorough literature review related to the topics. Expert opinion by 3 lecturers in the field of nutrition science were applied to maintain the content validity of the questionnaire and showed in agreement (content validity index = 1). The next step was scale development included pre-testing of questions, sampling and survey administration, item reduction and extraction of factors. Finally, the questionnaire was assessed for the internal validity on 30 mothers who have similar characteristic to the real study, and showed a good reliability with the Cronbach's alpha value was 0.906.
Children's fish consumption data
A validated FFQ consisted of 38 species of fish including 27 species of fresh fish and 11 species of processed fish were used to collect fish consumption data of children during the last 3 mon [13]. A fish picture book was used to help children and their mothers to complete the FFQ. Both the FFQ and the fish picture book were designed and developed specifically for this study.
Data analysis
The statistical analysis was carried out using Statistical Package for the Social Sciences software (version 21.0; IBM Corp., Chicago, IL, USA). Educational background of mother is the last formal education and presented as basic (≤ 12 yrs) and advanced (≥ 12 yrs), while occupation is presented as working and housewife. The score of the mother's knowledge about fish including the health benefits and cooking technique of fish served at home were presented as a percent of corrected answers from total score and categorized into 3 levels, namely good (76–100%), medium (56–75%) and low (≤ 55%) [26]. The mother's attitudes to the organoleptic properties of fish were converted into interval data and grouped based on type of data distribution; positive (score > median value) and negative (score ≤ median value). Children's fish consumption data were presented as g/day. The recommendation of fish consumption issued by the Environmental Protection Agency-Food and Drug Administration 2017 for children aged 9–12 yrs were used to analyze the sufficiency of children's fish consumption [27]. The recommended-fish consumption for children is similar to adults, which is 2 servings fish in a week with a serving size is 3 ounces for children aged 9 yrs and 4 ounces for children aged > 11 yrs [27] or equivalent to 24.3 g/d and 32.4 g/d for each group of children, respectively. The χ2 tests were used to analyse the correlations between mother's perspective of fish and her child fish consumption. A probability of P < 0.05 was taken as statistically significant.
Go to :
RESULTS
The mothers' perspective on fish
The response rate or the number of respondents who completed the survey divided by the number of total samples of the study was 93.1%. The characteristics of children and mothers is shown in Table 2. The majority of the mothers' education and occupation were the 9-yrs basic or compulsory education required by the Indonesian Government and a housewife of 52.9% and 60.6%, respectively. Distribution of mother's perspective related to fish is shown in Table 3. The results found that most of the mothers have a good knowledge about the health benefits of fish (66.7%), as well as fish cooking technique (76.2%). The response of the mothers on the organoleptic properties of fish including taste, aroma, and color are approximately similar, both in positive and negative response.

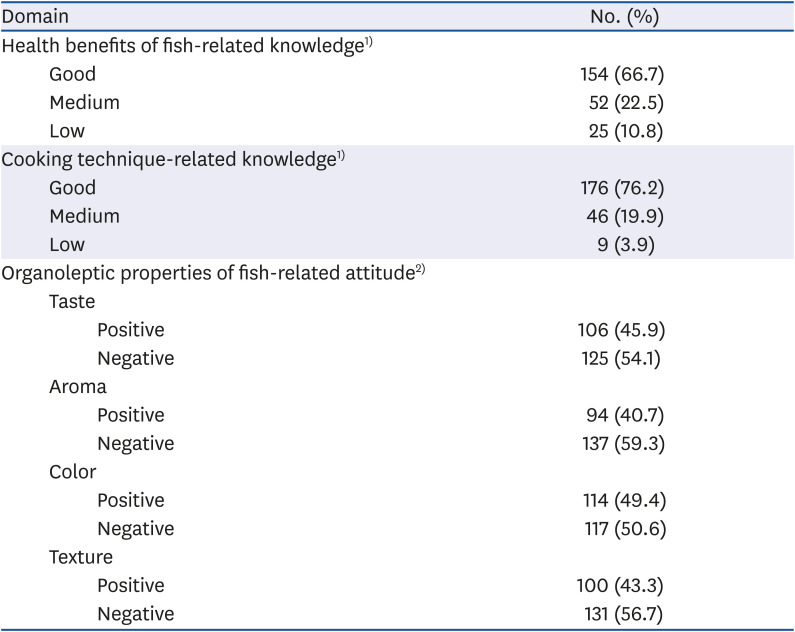
Table 2
Characteristics of respondents (n = 231)
![]()
Table 3
Mothers' perspective of fish (n = 231)
1)Good (76–100%), medium (56–75%) and low (≤ 55%) of total corrected answers; 2)Positive (> median value); negative (≤ median value).
![]()
The children's fish consumption
The median fish consumption of total children was 65 g/d, while fish consumption of children who met the recommendation was 3 times higher (157 g/d) than children who did not meet the recommendation (50 g/d) (Table 4). There was a trend that the amount of fish consumed by the children increased by age, and boys higher than girls as well as by educated mothers and housewives, but there were no significant differences in each category. Less than a third (31%) of the total children met the fish consumption goals suggested by the Environmental Protection Agency-Food and Drug Administration advice 2017 (Table 4). In terms of fish types consumed by children, local non-oily fish including milkfish (locally called Bandeng) and catfish (locally called Lele) were consumed more frequently than oily fish as well as processed fish products. Snapper (locally called Kakap) was oily fish that consumed more frequently than other oily fish. Frying is the only method in cooking fish for the children's meals, irrespective of the fish consumed (Table 5).
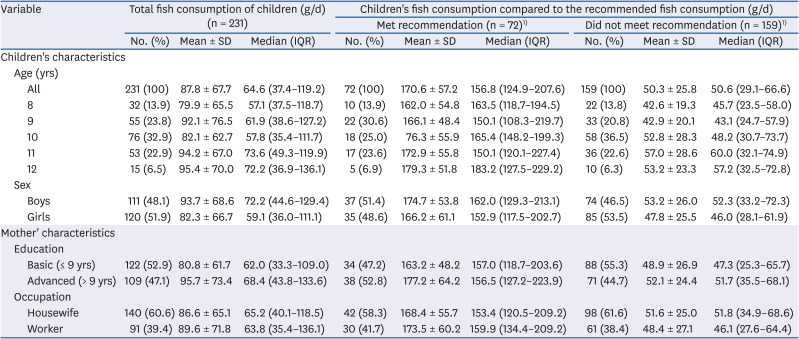
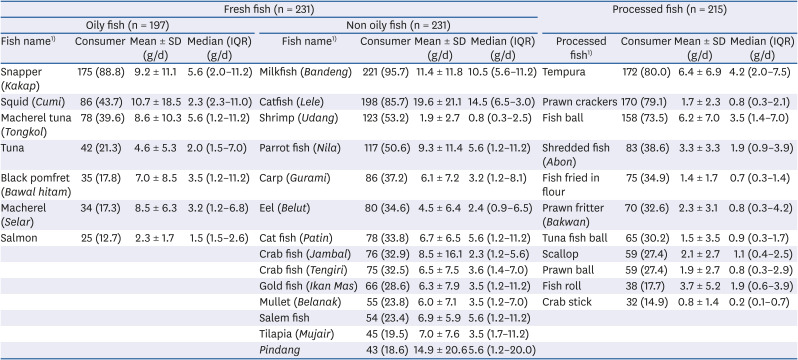
Table 4
Fish consumption of elementary school children grades 3–6 in Surakarta, Indonesia based on age group, sex and mothers' characteristics
There are no significant differences median fish consumption of total children based on age group (P = 0.777 by Kruskal-Wallis test), sex, mother's education and occupation of P = 0.127, 0.127 and 0.901, respectively by Mann-Whitney test.
IQR, inter quartile range.
1)The recommended fish consumption based on Environmental Protection Agency-Food and Drug Administration advised 2017.
![]()
Table 5
Type of fish consumed by elementary school children grades 3–6 in Surakarta City, Indonesia
Values are presented as number (%). All mothers reported that frying fish is the most preferred cooking method for their children meal.
1)Only the highest fish consumed were present in this table, bracket in the fish name column is local (Indonesian) name of the fish.
IQR, inter quartile range.
![]()
Correlation between the mothers' perspective on fish and her child fish consumption
Table 6 showed a correlation between the mother's perspective on fish and her child meeting or not meeting the recommended fish intakes. There is no correlation between the mothers' perspective on fish including the health benefits and organoleptic properties-related knowledge of fish as well as cooking technique-related attitude of fish and her child's fish consumption (P > 0.05).
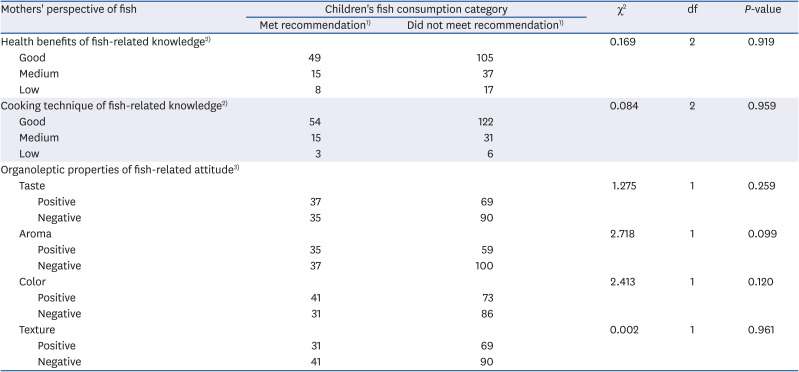
Table 6
Crosstabulation between mothers' perspective of fish and their children's fish consumption category (n = 231)
All statistical analysis by χ2 test.
1)The recommended fish consumption based on Environmental Protection Agency-Food and Drug Administration advised 2017; 2)Good (76–100%), medium (56–75%) and low (≤ 55%) of total corrected answers; 3)Positive (> median value); negative (≤ median value).
![]()
Go to :
DISCUSSION
The present study has identified fish consumption of primary school-aged children in relation to her/his mother's perspective on fish. Understanding factors related to fish consumption of children through the mother's perspectives of fish are important to modify food choice and healthy eating behaviour of children which may improve not only the quality of children's nutrients intake but also their health status. A high level of awareness of mothers related to the health benefits of fish and a high amount of fish consumed by children identified in the current study, although there was no correlation between the 2 variables. This attention and good intake probably due to the existence of a national program in Indonesia called Gemarikan (action to popularize eating fish) for healthy and smart generation have been launched in 2004 by the Marine and Fishery Minister of Indonesia, followed by the formation a forum to improve fish consumption nationally called Forikan Indonesia in 2016. This forum has a considerable influence in increasing consumption of fish in community [2].
In terms of fish types consumed by the children, our data showed that local freshwater fish are more popular than oily fish. Indonesia is a maritime country, where marine resources especially local fish such as Bandeng, Lele and other types of fresh water fish are available or easily found in markets and are cheap. For example, the price of Lele is approximately IDR 23.000 (USD 1.58) per kg [28]. In addition, increasing import fee of animal livestock such as chickens and cows currently in Indonesia, has resulted in higher prices for chicken and cow meat, and this may shift the consumer to eat other source of animal protein such as fish. In 2015, seafood consumption in Indonesia is roughly 32 kg per capita per year, which is nearly double the global average suggested by Food and Agriculture Organization of the United Nations (FAO). In some remote islands in Indonesia, seafood can contribute up to 90 percent of the protein requirements for local populations [1]. In Surakarta, the average cost for fish consumption in 2016 is IDR 15.034 per capita, which might use to buy approximately 560 g of Lele. Besides the geographical position of Indonesian, the government policy may also influencing the high consumption of fish in Indonesia. In 2019, the Indonesian Ministry of Marine Affairs and Fisheries has targeted that Indonesian fish consumption at 54.49 kg per capita per year [2], which is nearly triple the global average of fish consumption suggested by FAO of 19 kg per capita per year [3].
The amount of fish consumption data in our study is approximately 6 times higher than fish consumption that had been reported in a previous survey reported by the Agriculture Agency of Surakarta City in 2014. These differences could be due to differences in the methods and instruments used in collection of fish consumption data. The fish consumption data in our study used an FFQ specifically designed to collect fish intake in Surakarta City for the duration of 3mon. The previous survey used a food recall for a day. The use of the 24-h recall to estimate habitual intake of food that occasionally eaten such as fish may lead to potential reporting bias. The fish will be reported zero if the dietary recall happens on a day that fish is not consumed. Therefore, the use of FFQ that covers the frequency of fish consumption for a longer duration of time, might ameliorate n-3 LCPUFA intakes. Food frequency information could be a useful covariate or predictor in estimating the probability of consumption and amount of episodically consumed foods such as foods that are not consumed nearly every day [2930] including fish. By reporting the frequency in the FFQ, can improve reporting food consumption obtained from 24-h food recall.
Of the many fish processing techniques, frying is the only processing method of fish consumed by all children, both fish served at home as well as commercially processed fish in our study. The cooking technique probably is the easiest method for serving fish, as well as preferred by children. A study in Australia families with school aged children, also reported that nearly half of the respondent reported consuming take-away fish (primarily fried fish) at least once a month [30]. It is noteworthy that the method of cooking does not necessarily affect the n-3 LCPUFA in the fish, however, if the fish is fried using an omega-6 (n-6) oil (e.g., sunflower or safflower), the fish absorbs the n-6 oil, such that the ratio of n-3 to n-6 decreases [313233]. Thus, the promotion of oily fish to improve n-3 LCPUFA intakes may require attention to cooking method thereof.
The type of foods consumed by children is influenced by their mother [34]. Children may copy the parent's food choice [353637]. Evidences have been showed positive impacts in children's dietary habit by involving their parents to encourage healthy eating habit [353638]. Our findings regarding factors influencing fish consumption of children showed that the mothers' knowledge related to the health benefits and the cooking technique of the fish as well as their attitude to the organoleptic properties of fish are not correlated to the adequacy of their children's fish consumption. In addition, there was no significantly different between median fish consumption of children based on education background and occupation of mother. This might be explained due to favorable attitude, personal norm and attitude influence someone's decisions to consume fish [39].
Our finding is the opposite of the previous studies that fish properties include unpleasant organoleptic properties of fish (e.g., bones and smell), difficulties associated with preparation of fish, and the high cost are associated to the preference of consuming fish in Australia [14]. This difference might be attributed to cultural differences between Indonesia and Australia. In Australia a lot of people eat meat, and not much fish/seafood. Australians consume approximately 7 times more meat than fish/seafood [40]. Whereas fish consumption in Indonesia is higher due to lower cost of fish/seafood but also fish/seafood is traditionally consumed in Indonesia. The limitation of the study includes the inclusion of one city in Indonesia, which is not representative of Indonesia. Self-reported intake, e.g., from the FFQ is not as accurate as actual intake.
Given that the majority of children in this study did not meet the recommended fish consumption and fish cooking technique is frying, a recommendation would be to develop nutrition education strategies to improve fish consumption and provide information regarding the optimal benefits of consuming non-fried fish containing high levels of n-3 LCPUFA.
Go to :
 XML Download