

 PDF
PDF Citation
 Print
Print


INTRODUCTION
Young athletes are at the stage of developing physical, metabolic, and hormone systems. Compared to adult athletes, young athletes have difficulty in controlling body fluid or body temperature and have decreased metabolic capacity (aerobic or anaerobic) and an increased risk of injury [1]. Proper nutrition is essential for young athletes to reach their peak athletic performance as well as for their growth, development, and health. Therefore, careful nutritional management is needed for young athletes. Adequate amounts of macronutrients (energy, carbohydrate, protein, and fat), micronutrients, and fluids are crucial to providing energy for growth and exercise, and nutritional management needs to be planned considering the sports type (e.g., endurance and strength) [2345].
Previous nutrition studies in student athletes have reported that their diets were inadequate to meet their nutritional needs for growth and exercise performance [6789]. In a study with adolescent taekwondo players, the intakes of energy and nutrients, such as calcium, vitamin C, thiamin, riboflavin, and folate, were below the recommended levels during the training period, and before- and after competition [6]. A study with adolescent rhythmic gymnasts reported that their energy intakes were mainly from bread, snacks, and instant foods, suggesting the simple food consumption patterns of adolescent athletes [7]. Cheong et al. [8] reported that female adolescent athletes were likely to skip meals and eat processed foods frequently.
The Transtheoretical Model (TTM) and Social Cognitive Theory (SCT) have been used to examine the psychosocial factors explaining nutrition behaviors or behavior change [10111213]. The stages of behavior change are the major construct in the TTM, which categorizes individuals according to the stage of change (SOC), including precontemplation, contemplation, preparation, action, and maintenance. Therefore, TTM suggests that different stages need to be considered in understanding health or nutrition behaviors, and strategies appropriate to each SOC should be employed in the process of behavioral changes [14]. The basic premise of SCT is reciprocal determinism, where individual's cognition, behaviors, and environment interact and influence each other. Self-efficacy is the perceived ability to perform a behavior and has been an important predictor of nutrition behaviors [1516]. Beliefs (outcome expectations) are the perceived advantages and disadvantages of doing a behavior. In addition to cognition, environment (physical or social environment) is suggested as a significant factor influencing one's cognition or behaviors in the SCT [15].
Previous studies of athletes have been performed mainly with adult athletes [171819], and studies with student athletes have focused on the nutrient intakes or dietary habits [672021]. Few studies have investigated the stages of behavior change and psychosocial factors in student athletes, such as self-efficacy, beliefs, and eating environment. The purpose of this study was to examine whether self-efficacy, beliefs regarding nutrition, eating behaviors, and eating environment differ according to the SOC in nutrition management in student (elementary and middle school) athletes and suggest strategies according to the SOC in nutrition management among student athletes. This study also examined the relationship of these factors with the SOC in nutrition management according to the sports type. This study will provide information on developing nutrition education programs tailoring the needs of student athletes according to the SOC in nutrition management and the sports type.
SUBJECTS AND METHODS
Subjects
The subjects were elementary and middle school student athletes from 10 organizations (9 schools and a city hall) that operated the athletic club. The subjects were recruited from the schools located in several areas of the nation (Gyeonggi, Gangwon, Gyeongsangbuk, Jeolla, and Chungcheongnam-do). Some organizations participated in the ‘Sports Food Truck’, which was the program provided by the Sport for All, Korean Sport & Olympic Committee. The Sports Food Truck was designed to motivate elementary and middle school athletes by providing health and snack kits, as well as counseling and mentoring the student athletes by national athletes or coaches. The Sports Food Truck visited the schools that applied for the program, cooked foods from menus (e.g., pork steak, bulgogi, teriyaki roast chicken, green salad, etc.) selected by schools, and provided the opportunity to give the student-athletes a Korean National Training Center's meal [22]. The investigator contacted the coaches of the school athletic club and explained the study purpose and survey contents. After obtaining permission from coaches, the investigator sent an informed consent form and the survey questionnaires to the coaches of the organizations. Written informed consent was obtained from the student athletes and their parents for study participation of the student athletes. The subjects were informed that they could withdraw from the study if they did not want to respond to the survey questionnaire. Two hundred and twenty-two athletes participated in the survey by a self-report, and the investigator helped the student athletes to respond to the survey questionnaire. Excluding the data of athletes who responded incompletely to the major study variables (e.g., stages of behavior change, self-efficacy, beliefs, and eating behaviors), data from 167 student athletes were used for statistical analysis, with a response rate of 75.2%. The Institutional Review Board of Seoul Women's University approved this study (SWU IRB-2017A-20), and the survey was performed during 2017.
Measurements
The survey questionnaire was developed based on literature reviews regarding the stages of behavior change, psychosocial factors, and eating behaviors of school-aged athletes, as well as children and adolescents [452324252627]. A draft of the questionnaire was revised based on comments from a sports nutrition professional and a pilot-test of 10 student athletes. The survey questionnaire included items examining the general characteristics, SOC in nutrition management, self-efficacy, beliefs regarding nutrition, eating behaviors, and eating environment.
The general characteristics included items, such as age, gender, school, height, weight, and sports type [28]. The SOC in nutrition management was measured according to the stages of behavior, ‘ordinary nutrition management for training and competition’, which was defined as the behaviors of ‘eating grains and water enough’, ‘eating protein foods adequately’, and ‘eating greasy foods less’ [24529]. The subjects were asked to respond to 1 of 5 stages of change in nutrition management, as in the TTM [14]. Based on the response for SOC in nutrition management, the subjects were grouped into a pre-action stage (including those in the precontemplation, contemplation, and preparation stages) and an action stage (those in the action and maintenance stages).
Self-efficacy was measured by 10 items asking the perceived confidence in performing specific dietary behaviors, based on the literature [4523]. These were composed of items, such as the perceived confidence in ‘making a balance between grains and protein foods’, ‘selecting and eating less greasy foods’, ‘eating vegetables/dishes’, ‘drinking water frequently during training/exercise’, and ‘having a carbohydrate meal 2 to 3 hours before competition’. These items were measured on a 4-point scale ranging from ‘very difficult’ (1) to ‘very easy’ (4). The subscales for self-efficacy, which were self-efficacy regarding general eating behaviors (5 items) and self-efficacy regarding eating behaviors of exercise (5 items), were obtained using factor analysis. The total score for self-efficacy and the subscale scores were calculated by summing the score. A higher score indicated having more confidence in performing eating behaviors. The Cronbach's alpha for self-efficacy was 0.845 (total self-efficacy), 0.772 (self-efficacy regarding general eating behaviors), and 0.731 (self-efficacy regarding eating behaviors of exercise).
Beliefs regarding nutrition were measured by 10 items regarding the advantages or disadvantages of nutrition or nutritional management [2429]. These included items, such as ‘balanced meal for my health and nutrition’, ‘grains for strength during training or exercise’, ‘pre-competition meal for exercise performance’, ‘distaste of vegetables/side dishes’, and ‘discomfort of pre-competition meals’. Each item was rated on a 4-point scale ranging from ‘strongly disagree’ (1) to ‘strongly agree’ (4). The subscales for beliefs were obtained using factor analysis, which included the advantages of nutrition (6 items) and misconceptions or disadvantages of nutrition (4 items). The subscale score was calculated by summing the score on each subscale. The total score for beliefs regarding nutrition was the summated score of 10 beliefs, while the score on the items of misconceptions or disadvantages of nutrition was coded reversely. A higher total score and subscale score of beliefs regarding advantages of nutrition indicated having more favorable beliefs. In comparison, a higher subscale score on beliefs regarding misconceptions or disadvantages indicated having more unfavorable or negative beliefs regarding nutrition. The Cronbach's alpha was 0.437 (total beliefs regarding nutrition), 0.506 (beliefs regarding advantages of nutrition), and 0.321 (beliefs regarding misconceptions or disadvantages of nutrition).
Eating behaviors were measured by 13 items, composed of 6 items on food consumption in food groups (e.g., eating grains, protein foods, and vegetables) and 7 items on undesirable eating behaviors (e.g., eating greasy foods, sweets, and salty/spicy foods) [232530]. Each item was measured by checking the categories (0–2 days, 3–5 days, or 6–7 days a week) that applied to them. For the total score of eating behaviors, each item was coded from 1 (0–2 days a week) to 3 (6–7 days a week). The total score was calculated as the summated score of 13 items, while the score on undesirable eating behaviors was coded reversely. Factor analysis confirmed the subscales of general eating behaviors (6 items) and undesirable eating behaviors (7 items). The higher total score and subscale score of general eating behaviors indicated having more desirable eating behaviors. In contrast, the higher subscale score of undesirable eating behaviors indicated having less desirable eating behaviors. The Cronbach's alpha was 0.721 (total eating behaviors), 0.720 (general eating behaviors), and 0.809 (undesirable eating behaviors), respectively.
Statistical analysis
SPSS (PASW Statistics 21.0; SPSS Inc., Chicago, IL, USA) was used to analyze the data (n = 167). The subjects were categorized into two groups by their SOC in nutrition management, ‘pre-action stage’ and ‘action stage’, as described above. The χ2 test, t-test, or analysis of covariance (ANCOVA) were used to examine the differences in the variables (e.g., general characteristics, self-efficacy, beliefs regarding nutrition, eating behaviors, and eating environment) according to the groups of SOC in nutrition management. Among the general characteristics, school, height, and weight were used as covariates in ANCOVA to examine the association of the variables (i.e., self-efficacy, beliefs, and eating behaviors) according to the SOC groups, based on an analysis of the general characteristics according to the SOC groups. Factor analysis was conducted to find the subscales of variables. To examine the association of variables, such as self-efficacy, beliefs, and eating behaviors to the SOC in nutrition management according to the sports type (e.g., football, baseball, handball, and others), correlation analysis for each sport type was conducted. Correlation analysis was performed at the levels of the total score and subscale score of variables (i.e., self-efficacy, beliefs, and eating behaviors). Statistical significance was examined at P < 0.05.
RESULTS
General characteristics of the subjects according to the SOC group
According to the SOC in nutrition management, 37.7% (63 student athletes) were grouped into the pre-action stage, whereas 62.3% (104 student athletes) were in the action stage. Subjects were 12.7 years old, on average, and 76.6% of subjects were male athletes (Table 1). Approximately 59.3% of subjects attended middle school, while 40.7% attended elementary school. The distribution of school differed significantly according to the SOC group, showing a higher percentage of middle school athletes compared to elementary school athletes in the action stage (P < 0.05). The mean height, weight, and body mass index (BMI) of the male subjects were 160.0 cm, 54.3 kg, and 20.7 kg/m2, respectively. The mean height (P < 0.05) and weight (P < 0.05) of the male subjects were significantly higher in the action stage than the pre-action stage. The mean height, weight, and BMI of the female subjects were 153.7 cm, 47.9 kg, and 20.1 kg/m2, respectively. These were not significantly different according to the SOC group.
Table 1
General characteristics of subjects according to the stages of change in nutrition management
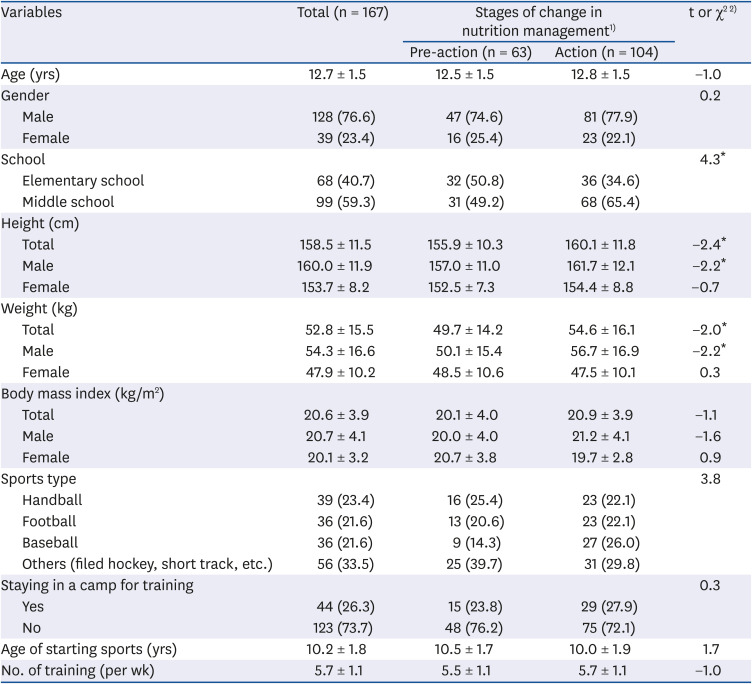
Concerning the sports type, 23.4% were handball players, followed by football players and baseball players (21.6% each). Approximately 26.3% of subjects stayed in the camp for training. No significant differences in the distribution of the sports type or staying in a training camp were observed between the pre-action stage and action stage. The subjects started sports at 10.2 years of age and participated in training 5.7 times a week, on average, but the age of starting sports or number of training sessions was not significantly different by SOC group (Table 1).
Self-efficacy regarding eating behaviors according to the SOC group
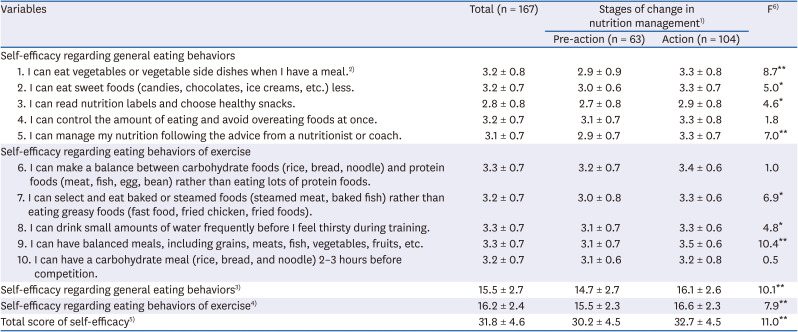
The total score for self-efficacy (possible score: 10–40) was 31.8 (79.5 out of 100), and it was significantly higher in the action stage than the pre-action stage (P < 0.01). The subscale scores for self-efficacy regarding general eating behaviors and self-efficacy regarding eating behaviors of exercise were 15.5 (77.5 out of 100) and 16.2 (81.0 out of 100), respectively. The two subscale scores for self-efficacy (P < 0.01) were also significantly higher in the action stage than the pre-action stage (Table 2).
Table 2
Self-efficacy of subjects according to the stages of change in nutrition management
Values are presented as mean ± SD.
1)Pre-action: those in pre-contemplation, contemplation, and preparation stages, Action: those in action and maintenance stages of change; 2)Each item was measured by 4-point scales from 1 (very difficult) to 4 (very easy). The higher score indicates that subjects were more confident in nutrition management; 3)Subscale score of 5 items (items 1–5), possible score: 5–20; 4)Subscale score of 5 items (items 6–10), possible score: 5–20; 5)Total score of 10 items, possible score: 10–40; 6)F value by analysis of covariance with covariates of school, height, and weight.
*P < 0.05, **P < 0.01.
The ANCOVA results also showed that seven out of ten self-efficacy items differed significantly between the pre-action and action stages. In particular, subjects in the action stage compared to the pre-action stage, felt more self-efficacy in ‘having balanced meals’ (P < 0.01), ‘eating vegetable/side dishes at meals’ (P < 0.01), ‘managing my nutrition following the advice from a nutritionist or coach’ (P < 0.01), ‘selecting and eating baked or steamed foods than greasy foods’ (P < 0.05), ‘eating sweet foods less’ (P < 0.05), ‘drinking small amounts of water frequently during training before feeling thirsty’ (P < 0.05), and ‘reading nutrition labels and choosing healthy snacks’ (P < 0.05, Table 2).
Beliefs regarding nutrition according to the SOC group
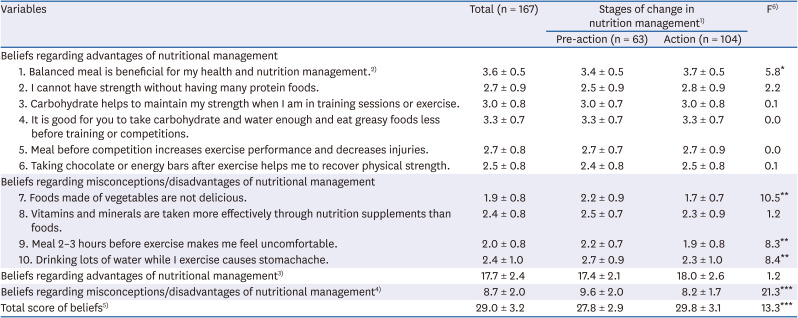
The total score for beliefs regarding nutrition (possible score: 10–40) was 29.0 (72.5 out of 100), which was significantly higher in the action stage than the pre-action stage (P < 0.001). At the subscale level, the beliefs regarding the misconceptions or disadvantages of nutrition were significantly different between the two groups, showing that those in the pre-action stage agreed more strongly on the misconceptions or disadvantages of nutrition than those in the action stage (P < 0.001), whereas the beliefs regarding advantages of nutrition were not different according to the SOC group (Table 3).
Table 3
Beliefs regarding nutrition of subjects according to the stages of change in nutrition management
Values are presented as mean ± SD.
1)Pre-action: those in pre-contemplation, contemplation, and preparation stages, Action: those in action and maintenance stages of change; 2)Each item was measured by 4-point scales from 1 (strongly disagree) to 4 (strongly agree). The higher score indicates that subjects agreed more strongly with each belief statement; 3)Subscale score of 6 items (items 1–6), possible score: 6–24; 4)Subscale score of 4 items (items 7–10), possible score: 4–16; 5)Total score of 10 items, possible score: 10–40. To calculate the total score, the items from 7 to 10 were scored reversely; 6)F value by analysis of covariance with covariates of school, height, and weight.
*P < 0.05, **P < 0.01, ***P < 0.001.
At each belief item level using ANCOVA, four out of ten belief items showed significant differences according to the SOC group. The subjects in the action stage, compared to the pre-action stage, agreed more strongly on the advantages of a balanced meal (P < 0.05). In contrast, the subjects in the pre-action stage agreed more strongly on the misconceptions or disadvantages, such as ‘foods made of vegetables are not delicious’ (P < 0.01), ‘drinking water while I exercise causes stomachache’ (P < 0.01), and ‘a meal 2 to 3 hours before exercise makes me feel uncomfortable’ (P < 0.01, Table 3), than those in the action stage.
Eating behaviors according to the SOC group
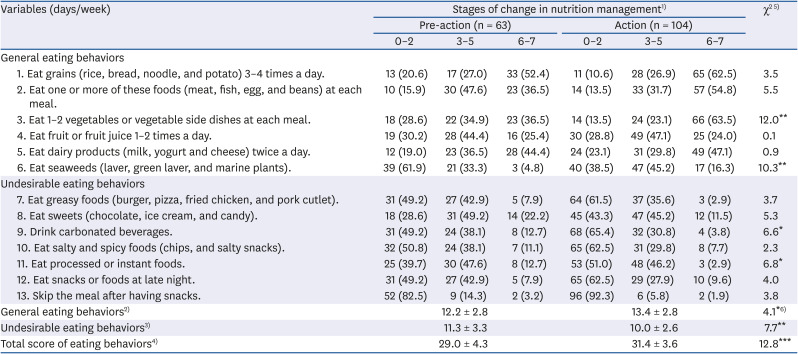
The total score for eating behaviors (possible score: 13–39) was 30.5, which was 78.2 out of 100 (not shown in Table 4). The total score for eating behaviors was significantly higher in the action stage than in the pre-action stage (31.4 vs. 29.0, P < 0.001, Table 4). Compared to the pre-action stage, those in the action stage also scored higher at the subscale of general eating behaviors (P < 0.05) and scored lower at the subscale of undesirable eating behaviors (P < 0.01). These results showed that those in the action stage had more desirable eating behaviors at the subscale levels than those in the pre-action stage.
Table 4
Eating behaviors of subjects according to the stages of change in nutrition management
Values are presented as mean ± SD or number (%).
1)Pre-action: those in pre-contemplation, contemplation, and preparation stages, Action: those in action and maintenance stages of change; 2)Subscale score of 6 items (items 1–6), possible score: 6–18; 3)Subscale score of 7 items (items 7–13), possible score: 7–21; 4)Possible total score: 13–39. To calculate the total score, each question was coded from 1 (0–2 days/week) to 3 (6–7 days/week), and the items from 7 to 13 were scored reversely. The higher total score indicates that subjects have more desirable eating behaviors; 5)χ2 value by χ2-test; 6)F value by analysis of covariance with covariates of school, height, and weight.
*P < 0.05, **P < 0.01, ***P < 0.001.
Four out of thirteen items differed significantly by SOC group when each eating behavior item was examined. The percentages of those who had desirable eating behaviors, such as ‘eating 1–2 vegetables/side dishes at each meal’ (P < 0.01) and ‘eating seaweeds’ (P < 0.01), were significantly higher in the action stage than the pre-action stage. In addition, the percentages of those having undesirable eating behaviors, ‘eating processed or instant foods’ (P < 0.05), and ‘drinking carbonated beverages’ (P < 0.05) less frequently, were significantly higher in the action stage than in the pre-action stage (Table 4).
Eating environment according to the SOC group
With respect to the major place of having meals, 66.3% of subjects responded that they had breakfast at home, followed by at schools (20.5%), and school store/convenience store/other places (13.3%, Table 5). Most of the subjects (96.4%) had lunch at schools, and they had dinner at home (55.8%) and at schools (38.2%). The place of having lunch (P < 0.05) and dinner (P < 0.05) differed significantly according to the SOC group. The percentage of those who had dinner at schools was significantly higher in the action stage (46.1%) than in the pre-action stage (25.4%).
Table 5
Eating environment of subjects according to the stages of change in nutrition management
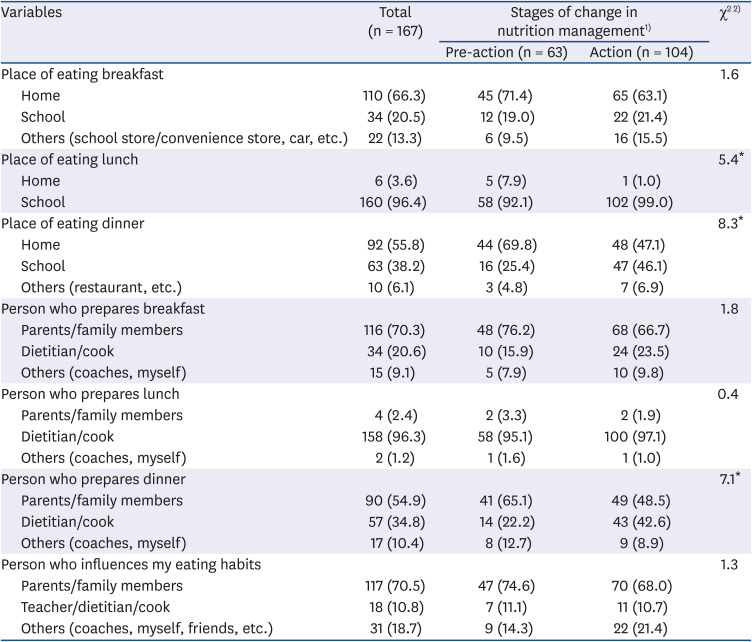
Regarding the person who mainly prepares breakfast, parents/family members (70.3%) were cited most frequently, followed in order by dietitian/cook (20.6%) and coaches/myself (9.1%). In most cases, dietitian/cook (96.3%) prepared lunch, and parents/family members (54.9%) or dietitian/cook (34.8%) prepared dinner. The major person who prepared dinner differed significantly according to the SOC group, showing higher percentages of dietitian/cook in the action stage than the pre-action stage (42.6% vs. 22.2%, P < 0.05). Parents/family members (70.5%) were chosen most frequently as the person with the most influence on the subject's eating habits, followed in order by coaches/myself/friends (18.7%) and teachers/dietitian/cook (10.8%). The person who influenced the subject's eating habits was not significantly different between the pre-action stage and action stage (Table 5).
Association of self-efficacy, beliefs and eating behaviors to the SOC in nutrition management by each sports type
Table 6 shows the correlation analysis results between the total score of variables (self-efficacy, beliefs regarding nutrition, and eating behaviors) and the SOC in nutrition management by each sports type. In football athletes, there was a significant positive correlation between the beliefs regarding nutrition and SOC in nutrition management (r = 0.368, P < 0.05). The self-efficacy (r = 0.420, P < 0.05) and beliefs regarding nutrition (r = 0.345, P < 0.05) had a significant positive correlation with the SOC in baseball athletes (Table 6). In contrast, eating behaviors (r = 0.485, P < 0.01), self-efficacy (r = 0.337, P < 0.05), and beliefs regarding nutrition (r = 0.328, P < 0.05) were positively correlated to the SOC in handball athletes. Similarly, eating behaviors (r = 0.461, P < 0.001), self-efficacy (r = 0.409, P < 0.01), and beliefs regarding nutrition (r = 0.397, P < 0.01) showed a significant correlation with the SOC in other athletes (e.g., field hockey, short track, etc.).
Table 6
Correlation of the total score of self-efficacy, beliefs, eating behaviors with the stages of change in nutrition management by sports type
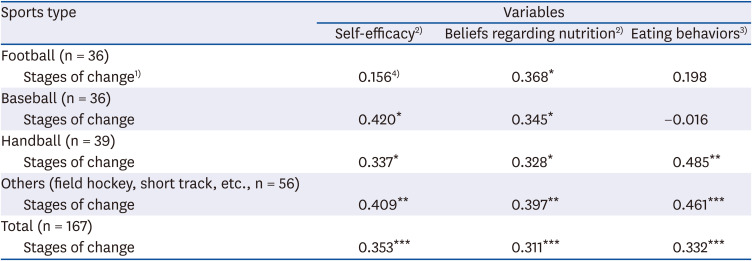
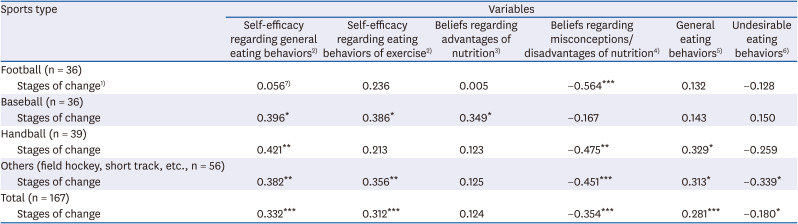
Table 7 presents the correlation analysis results between the subscale level of variables and the SOC in nutrition management by each sports type. In football athletes, only the beliefs regarding misconceptions/disadvantages of nutrition were negatively correlated to the SOC in nutrition management (r = −0.564, P < 0.001). In baseball athletes, self-efficacy regarding general eating behaviors (r = 0.396, P < 0.05), self-efficacy regarding eating behaviors of exercise (r = 0.386, P < 0.05), and beliefs regarding the advantages of nutrition (r = 0.349, P < 0.05) were related significantly to the SOC (Table 7). In handball athletes, self-efficacy for eating behaviors (r = 0.421, P < 0.01), and general eating behaviors (r = 0.329, P < 0.05) had a positive correlation, whereas the beliefs regarding misconceptions/disadvantages of nutrition (r = −0.475, P < 0.01) had a negative correlation with the SOC. In other athletes, self-efficacy regarding general eating behaviors (r = 0.382, P < 0.01), self-efficacy regarding eating behaviors of exercise (r = 0.356, P < 0.01), and general eating behaviors (r = 0.313, P < 0.05) showed a positive correlation, whereas the beliefs regarding misconceptions/disadvantages of nutrition (r = −0.451, P < 0.001), and undesirable eating behaviors (r = −0.339, P < 0.05) showed a negative correlation with the SOC (Table 7).
Table 7
Correlation of subscale of self-efficacy, beliefs, eating behaviors with the stages of change in nutrition management by sports type
DISCUSSION
This study examined whether self-efficacy, beliefs regarding nutrition, eating behaviors, and eating environment differ by the SOC in nutrition management among elementary and middle school athletes. Approximately 62.3% of student athletes in this study were grouped into the action stage, whereas 37.7% were in the pre-action stage. In a study with elementary and middle school students, high percentages of subjects (70.6%) were in the action stage or maintenance stage of eating breakfast regularly [31]. In contrast, low percentages of subjects were in the action or maintenance stages in the behavior of ‘eating less salt’ (25.8%) or ‘eating fruits and vegetables’ (33.2%) in previous studies on children or adolescents [3233]. The distribution of SOC differed by eating behaviors examined, and that student athletes were more concerned about nutrition than nonathletic children and adolescents.
In the present study, the student athletes in the action stage were more confident in their eating behaviors than those in the pre-action stage, based on ANCOVA results of the total self-efficacy and subscales of self-efficacy. In particular, the student athletes in the action stage were more confident in performing specific eating behaviors (e.g., having balanced meals, eating vegetable/side dishes at meals, managing my nutrition, eating greasy foods or sweet foods less, drinking water frequently during training, and reading nutrition labels and choosing healthy snacks). Consistent with the present study, dietary self-efficacy was higher among those in the further stages of behavior change, which examined eating breakfast regularly or performing exercise as behaviors in a study with elementary and middle school students [31]. Gacek [34] also reported that American football players with higher levels than lower levels of self-efficacy showed more desirable eating behaviors in terms of food consumption and eating regularly. In addition, a study on college female athletes reported that dietary self-efficacy and nutrient intakes were significantly increased after they had received nutrition education emphasizing self-efficacy [35]. These results suggested that nutrition education focuses on increasing the self-efficacy of specific eating behaviors, particularly in student athletes in the pre-action stage. The self-efficacy might be increased by suggesting the methods of performing specific eating behaviors and encouraging them to practice desirable eating behaviors in daily life. It is also possible in nutrition education to use role models (e.g., peers) that help student athletes learn through observation and practice desirable eating behaviors.
This study showed that beliefs regarding nutrition, particularly beliefs regarding misconceptions or disadvantages of nutrition, were important in differentiating the pre-action and action stages. In constructing belief items, it was necessary to examine the diverse aspects of beliefs regarding nutrition in student athletes. As a result, items in the belief statement covered several aspects of the advantages or misconceptions/disadvantages of nutrition and sports nutrition, rather than covering the advantages or disadvantages of specific eating behaviors. This might be related to the relatively low reliability coefficient for the scale of beliefs regarding nutrition.
When each belief was examined according to the SOC group, student athletes in the pre-action stage than the counterparts, agreed more strongly on the misconceptions or disadvantages of eating vegetables (not tasty), drinking water during exercise (causing stomachache), and having a meal before exercise (uncomfortable). Son and Lee [6] also found that high school taekwondo players did not perceive health or nutrition as important. Previous studies pointed that athletes had nutrition misconceptions regarding fluids and hydration (e.g., not drinking fluids during training), pre-competition meals, and protein or energy needs [436]. A study with collegiate athletes reported that they had misconceptions regarding the roles of nutrients in sports performance. Misconceptions might affect the food choices and their athletic performance negatively [37]. In the present study, both SOC groups agreed to a certain extent regarding the effectiveness of taking nutrition supplements than foods for vitamins and minerals. Young athletes commonly used nutrition supplements, mainly multivitamins or vitamins/minerals, for health and athletic performance, but their efficacy needs to be proven [38]. The results suggested that nutrition education for those in the pre-action stage needs to focus on modifying the misconceptions or disadvantages of following the recommended nutrition management. This might be achieved by suggesting tasty and nutritious recipes using vegetables, persuading them to perform the recommended behaviors step by step (e.g., drinking water during exercise, having pre-competition meals), and helping them recognize the misconceptions or disadvantages as not as bad as they perceived.
Eating behaviors of student athletes were moderate in this study (78.2 out of 100). The total score and subscale scores of eating behaviors differed according to the SOC group, indicating better eating behaviors in the action stage athletes than the pre-action stage athletes. Therefore, it is important to improve undesirable eating behaviors and encourage them to consume adequate amounts of foods in the various food groups, especially in the pre-action stage athletes. Kim et al. [39] also reported the undesirable eating behaviors of elite athletes (scoring 71.6 out of 100 in males, 66.4 out of 100 in females).
The eating behavior results showed that student athletes in the pre-action stage consumed vegetables/side dishes less frequently than those in the action stage. Providing foods using vegetables at meals, and increasing the perception that vegetables are also acceptable and tasty is important. Those in the pre-action stage than the action stage consumed carbonated beverages and processed or instant food more frequently. In the present study, student athletes did not consume dairy products as recommended; only 44.4% of the pre-action stage and 47.1% of the action stage consumed 2 servings of dairy products per day for 6–7 days a week. Petrie et al. [3] suggested that child and adolescent athletes consume 1,300 mg of calcium per day. Adequate calcium intake is important for student athletes because they are in the periods of developing bone mass; fractures or bone-related diseases might be caused by inadequate calcium intake. Previous studies reported that child and adolescent athletes consumed only 38–61% (by sports type) [8], 54–56% [20], 87% [9] of calcium per day, compared to the recommended calcium intake. In nutrition education, methods to increase the calcium intake need to be stressed by suggesting the consumption of dairy products gradually, having dairy products for snacks, and eating green vegetables high in calcium. Fruits or fruit juice provide dietary fiber, vitamins, and minerals and help the accumulation of glycogen in the muscle [3]. On the other hand, only a quarter of student athletes consumed 1–2 fruits/fruit juice adequately (6–7 times a week) in the current study. This might be because student athletes stayed and spent most of the time for training at schools. Therefore, it is necessary to consider providing fruits or fruit juices to student athletes more frequently at meals and as snacks in meal planning.
The results on eating environment showed that a higher percentage of student athletes in the action stage had dinner at school than those in the pre-action stage. With respect to the major meal preparer, only dinner revealed a significant difference according to the SOC group, showing a higher percentage of a dietitian/cook as a dinner preparer in the action stage than the pre-action stage. Meals at schools were planned and prepared by a dietitian/cook. Therefore, meals at schools might be adequate in terms of nutrition and health. The home was the major place of having meals (breakfast and dinner), and 70.5% of subjects reported that parents or family members influenced their dietary habits. Therefore, it is essential to educate parents or caregivers about nutrition and meal planning.
Correlation analysis results indicated that the relationship of self-efficacy, beliefs, and eating behaviors to the SOC in nutrition management differs according to the sports type. Similarly, a study with the national team reported that eating behaviors differed according to the sports type and that inadequate eating behaviors were observed in ping-pong and gymnastics athletes [40]. The current study suggested that nutrition education or counseling should be planned to tailor the needs of student athletes according to the sports type. In particular, nutrition education for football athletes might modify the misconceptions or perceived disadvantages of nutrition management. Education for baseball athletes needs to stress increasing the self-efficacy and perceived advantages of nutrition management. For handball or other athletes (e.g., field hockey and short track), strategies to change self-efficacy and eating behaviors, and changing misconceptions or perceived disadvantages of nutrition need to be employed.
The subjects for this study were recruited from several regions of the nation, but the subjects were a convenient sample of child and adolescent athletes. Therefore, there were limitations in generalizing the study results to other groups of student athletes. In summary, this study showed that psychosocial factors, such as beliefs regarding nutrition, self-efficacy, and eating behaviors, were associated with the SOC in nutrition management of student athletes. The relationship of these factors with the SOC in nutrition management also differed according to the sports type (e.g., football, baseball, and handball). Nutrition education for student athletes should be planned and tailored to meet the needs of young athletes based on the SOC in nutrition management. For those in the pre-action stage, it is appropriate to employ strategies to modify negative beliefs, for example, to change the perception regarding vegetables (e.g., not bad, tasty), pre-meal before exercise (e.g., comfort), and drinking water during exercise (e.g., not causing stomachache). In addition, it is recommended to focus on increasing the self-efficacy for eating behaviors, such as having balanced meals, eating vegetables/side dishes, having less greasy foods, and drinking water adequately during training. The methods to change eating behaviors might be used step by step in collaboration with modifying beliefs and increasing self-efficacy. For those in the action stage, it is essential to use the strategies to change eating behaviors as recommended if necessary (e.g., adequate consumption of fruits/fruit juice, and dairy products), and encourage them to continue desirable eating behaviors. Nutrition education might include sessions for parents or caregivers as well as for professionals (e.g., dietitians, coaches) to achieve the optimal nutritional status of student athletes. Nutrition education might also be planned specifically targeting the psychosocial factors considering the student athlete's sports type.
 XML Download