

 PDF
PDF Citation
 Print
Print


INTRODUCTION
In recent years, airborne particulate matter (PM), which is a major component of air pollution, is receiving a lot of attention as a harmful factor to the human body [12]. As a result of the great efforts to research the adverse effects of PM on health, many evidences have accumulated that PM causes respiratory disease, cardiovascular disease, skin aging, exacerbation of allergic conditions, various cancers including lung cancer, and other diseases [345]. Although PM is defined by its diameter, its chemical composition is considered the most important in determining its biohazard effect. Particularly, PM2.5, which is less than 2.5 μm in diameter, is composed of various heavy metal ions, nitrates, sulfates, carbon substances, as well as harmful viruses and bacteria [67]. Recent studies demonstrate that there is a direct association between the inflammatory response and oxidative stress in various cellular dysfunctions caused by PM2.5. For example, in macrophages exposed to PM2.5, the production of pro-inflammatory mediators and cytokines was increased through the activation of nuclear factor-kappa B (NF-κB) [8910], which was associated with increased neutrophil recruitment and vascular permeability [1112]. Moreover, previous studies have demonstrated the ability of PM2.5 to produce reactive oxygen species (ROS) and related species, and the resulting oxidative environment of the cells has been reported to lead to cell death following loss of function of organelles within the cell [131415]. These oxidative stresses may be related to the regulation of intracellular signaling pathways leading to transcription of pro-inflammatory genes [161718]. Therefore, agents with potent anti-inflammatory and antioxidant properties that are not toxic may be potential candidates for preventing or improving PM-mediated damage.
Recently, many natural products have shown protective effects against a variety of diseases through anti-inflammatory and antioxidant properties. Schisandra chinensis (Turcz.) Baill., belonging to the genus Schisandra, is one of the most widely used traditional medicinal plants due to its various therapeutic properties [1920]. A number of previous studies have shown that S. chinensis fruit (Schisandrae Fructus) extract and its ingredients have a variety of beneficial pharmacological effects, including anti-inflammatory, antioxidant, neuroprotective, hepatoprotective, immune regulatory and anti-tumor effects [202122]. For example, Song et al. [23] recently demonstrated that Schisandrae Fructus extract acted as an anti-inflammatory agent in lipopolysaccharide (LPS)-stimulated glia cells through blocking of NF-κB and mitogen-activated protein kinase signaling pathways. We also reported that Schisandrae Fructus extract exhibited anti-inflammatory effects by modulating these signaling pathways in an interleukin (IL)-1β-induced osteoarthritis model [24]. Additionally, Schisandrae Fructus has been reported to inhibit the LPS-induced inflammatory response in macrophages by inhibiting the phosphatidylinositol 3-kinase/Akt signaling pathway as well as NF-κB [25]. Moreover, previous studies have reported that the exogenous addition of Schisandrae Fructus extract or its constituents showed strong cytoprotective and antioxidant effects against various types of oxidative stress-induced cell damage [2627]. However, the precise mechanisms for the inhibitory effect by Schisandrae Fructus on PM-induced inflammatory and oxidative responses have not been well studied. Therefore, in this study, we sought to investigate the effect of Schisandrae Fructus ethanol extract (SF) on PM2.5-stimulated RAW 264.7 macrophages and to elucidate the mechanisms involved. We also demonstrated the anti-inflammatory and antioxidant potential of SF in zebrafish.
Go to : 
MATERIALS AND METHODS
Preparation of SF
SF was extracted according to a modified previous method [28]. In brief, the frozen Schisandrae Fructus samples provided by Mungyeong Omija Valley Farming Association Co. (Mungyeong, Korea) were sectioned and homogenized using a grinder prior to extraction with 70% ethanol. After soaking the sample at room temperature (RT) for 48 h, the extract was filtered using filter paper (Whatman No. 3; Sigma-Aldrich Chemical Co., St. Louis, MO, USA) and concentrated using a rotary vacuum evaporator (BÜCHI Labortechnik, Flawil, Switzerland). The extract (SF) was freeze-dried and dissolved in dimethyl sulfoxide (DMSO; Invitrogen-Gibco, Carlsbad, CA, USA) to prepare a stock solution (50 mg/mL), and the SF was diluted to the required concentrations with cell culture medium just before use.
Cell culture and treatment
RAW 264.7 cells were obtained from the Korea Cell Line Bank (Seoul, Korea) and maintained in humidified air at 37°C, and 5% CO2 in Dulbecco's modified Eagle's medium containing 100 U/mL penicillin and streptomycin, and 10% fetal bovine serum. All materials required for the cell culture were purchased from WelGENE Inc. (Daegu, Korea). The PM2.5 used in this study was a standard diesel particulate matter (SRM 1650b) issued by the National Institute of Standards and Technology (Gaithersburg, MD, USA), and was purchased from Sigma-Aldrich Chemical Co.). A 50 mg/mL stock solution of PM2.5 was prepared in DMSO, and diluted to the appropriate concentration (50 µg/mL) in the culture medium before adding to the cells as previously described [14].
Cell viability assay
The cytotoxicity of SF against RAW 264.7 cells in the presence or absence of PM2.5 was determined using the 3-(4,5-dimethylthiazol-2-yl)-2,5-diphenyltetrazolium bromide (MTT) reduction assay as previously described [29]. In brief, the cells were treated with various concentrations of SF alone or pre-treated with the indicated concentrations of SF for 1 h before 50 µg/mL PM2.5 treatment for 24 h. Then, the medium was removed, and MTT solution (0.5 mg/mL; Sigma-Aldrich Chemical Co.) was dispensed into each well and reacted at 37°C. After 3 h incubation, the supernatant was removed and DMSO was added to dissolve the blue formazan crystals for 10 min. The absorbance per well was quantified at a wavelength of 540 nm using an enzyme-linked immunosorbent assay (ELISA) plate reader (Dynatech Laboratories, Chantilly, VA, USA).
Measurement of nitric oxide (NO), prostaglandin E2 (PGE2), and cytokines
RAW 264.7 cells were treated with 200 µg/mL and 400 µg/mL SF for 1 h and then stimulated with 50 µg/mL PM2.5 for 24 h. The NO level in the medium was evaluated by the amount of nitrite measured using the Griess reagent (Sigma-Aldrich Chemical Co.) as previously described [30]. Briefly, 100 μL of the cell-conditioned medium was mixed with the same amount of Griess reagent for 10 min. The absorbance was measured at 540 nm using an ELISA reader and calculated by comparison to a sodium nitrite (NaNO2) standard curve. To investigate the PGE2 and cytokine levels, the culture supernatants were collected and assayed using commercially available ELISA kits (R&D Systems Inc., Minneapolis, MN, USA) according to the instructions from the manufacturer. The absorbance was measured at a wavelength of 450 nm using an ELISA reader as previously described [30].
Protein isolation and Western blot analysis
RAW 264.7 cells were treated with 200 and 400 µg/mL SF, or pre-treated with 200 and 400 µg/mL of SF for 1 h before 50 µg/mL PM2.5 treatment for 24 h. To extract whole proteins, the cells were washed with cold phosphate-buffered saline (PBS) and lysed with lysis buffer as previously described [31]. In parallel, nuclear extraction reagents purchased from Pierce (Rockford, IL, USA) were used to isolate proteins from the nucleus and cytoplasm according to the manufacturer's protocol. The concentration of the isolated protein was measured using the Bio-Rad protein assay kit (Bio-Rad Laboratories, Hercules, CA, USA). Equal amounts of protein were separated by sodium dodecyl sulfate-polyacrylamide gel electrophoresis. Proteins in the gel were subsequently transferred to polyvinylidene difluoride membranes (Schleicher and Schuell GmbH, Keene, NH, USA). The protein-transferred membranes were blocked with non-fat dry milk solution (5%) at RT for 1 h, and then reacted with primary antibodies (Table 1) overnight at 4°C. The membranes were washed 3 times for 5 min with Tris-buffered saline (0.1% Tween-20) and then incubated with secondary antibodies for 2 h at RT. The membrane was reacted with an enhanced chemiluminescent solution purchased from Amersham Corp. (Arlington Heights, IL, USA) and then exposed to X-ray film to visualize the corresponding proteins. Secondary antibodies for rabbit immunoglobulin G (IgG, rabbit, 1:1,000, #7074) and mouse IgG (mouse, 1:1,000, sc-516102) were obtained from Cell Signaling Technology (Beverly, MA, USA) and Santa Cruz Biotechnology Inc. (Dallas, TX, USA), respectively.
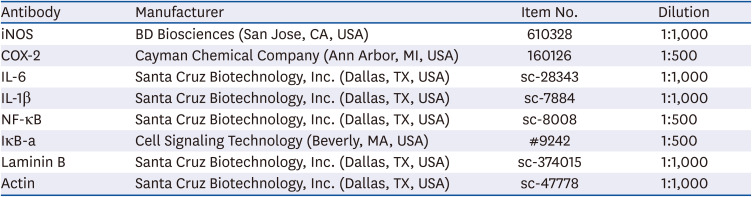
Table 1
List of antibodies used for western blot analysis in the present study
iNOS, inducible nitric oxide synthase; COX-2, cyclooxygenase-2; IL, interleukin; NF-κB, nuclear factor-kappa B.
![]()
Reverse transcription-polymerase chain reaction (RT-PCR) assay
For RT-PCR assay, RAW 264.7 cells were treated with 200 µg/mL and 400 µg/mL SF for 1 h and then cultured with PM2.5 for 24 h. Total RNA was isolated from the cells using TRIzol reagent (Invitrogen Life Technologies, Carlsbad, CA, USA), following the manufacturer's instructions, and quantified. The isolated total RNA (1 μg) was used to synthesize cDNA using AccuPower® RT PreMix (Bioneer, Daejeon, Korea) according to the manufacturer's instructions. The cDNA generated at RT was amplified using the One-Step RT-PCR PreMix Kit with selected primers (iNtRON Biotechnology Inc., Seongnam, Korea). The PCR primers were as follows: inducible NO synthase (iNOS) forward, 5′-ATG TCC GAA GCA AAC ATC AC-3′ and reverse, 5′-TAA TGT CCA GGA AGT AGG TG-3′; cyclooxygenase-2 (COX2) forward, 5′-CAG CAA ATC CTT GCT GTT CC-3′ and reverse, 5′-TGG GCA AAG AAT GCA AAC ATC-3′; IL-6 forward, 5′-GGA GGC TTA ATT ACA CAT GTT-3′ and reverse, 5′-TGA TTT CAA GAT GAA TTG GAT-3′; IL-1β forward, 5′-ATG GCA ACT GTT CCT GAA CTC AAC T-3′ and reverse, 5′-TTT CCT TTC TTA GAT ATG GAC AGG AC-3′; and glyceraldehyde-3-phosphate dehydrogenase (GAPDH) forward, 5′-AGG CCG GTG CTG AGT ATG TC-3′ and reverse, 5′-TGC CTG CTT CAC CAC CTT CT-3′. The following PCR conditions were applied: GAPDH: 18 cycles of denaturation at 94°C for 30 s, annealing at 57°C for 30 s, and extension at 72°C for 30 s; iNOS, COX-2, IL-6 and IL-1b: 25 cycles of denaturation at 94°C for 30 s, annealing at 52°C for 30 s, and extension at 72°C for 30 s. GAPDH was used as an internal control to evaluate relative expression of COX-2, iNOS, IL-6 and IL-1b. The amplified DNA products were electrophoresed on 1.5% agarose gels and visualized after ethidium bromide (EtBr; Sigma-Aldrich Chemical Co.) staining as previously described [32].
Immunofluorescence for NF-κB
RAW 264.7 cells were seeded into 4-well cell culture slides and stabilized for 24 h. The cells were pre-treated with 400 µg/mL SF for 1 h and then treated with or without 50 µg/mL PM2.5 for 1 h. After treatment, the cells were fixed with ice-cold methanol for 10 min and washed with PBS. Subsequently, the cells were blocked using 5% bovine serum albumin (BSA; Sigma-Aldrich Chemical Co.) with PBS-T (PBS containing 0.1% Triton X) for 1 h and then incubated with anti-NF-κB (1:100 in 2.5% BSA in PBS-T) at 4°C overnight. The cells were washed with PBS-T and incubated with the secondary antibody (goat anti-rabbit IgG cross-absorbed secondary antibody conjugated to Alexa Fluor 594; Thermo Fisher Scientific, Waltham, MA, USA) for 1 h. After washing with PBS, the cells were counterstained with 4′,6-diamidino-2-phenylindole (Sigma-Aldrich Chemical Co.) for 20 min to stain the nuclei. Cell fluorescence was observed using a fluorescence microscope (Carl Zeiss, Oberkochen, Germany) at Core-Facility Center for Tissue Regeneration (Dong-Eui University, Busan, Korea).
Measurement of ROS levels
The levels of ROS production were measured using 5,6-carboxy-2′,7′-dichlorofluorescein diacetate (DCF-DA; Sigma-Aldrich Chemical Co.). Briefly, RAW 264.7 cells were pre-treated with 400 µg/mL SF, 10 mM N-acetyl cysteine (NAC; Sigma-Aldrich Chemical Co.), and/or 20 µM 4-methyl-N1-(3-phenyl-propyl)-benzene-1,2-diamine (JSH-23; Sigma-Aldrich Chemical Co.) for 1 h and then incubated for 1 h in the absence or presence of 50 µg/mL PM2.5. The cells were stained with 10 μM DCF-DA for 15 min in the dark at 37°C. The cells were then washed with PBS and immediately analyzed by flow cytometry (BD Biosciences, San Jose, CA, USA) as previously described [33]. To compare the degree of ROS generation through fluorescence microscopic observation, the cells were stained with DCF-DA for 15 min at 37°C and then fixed with paraformaldehyde solution (4%, pH 7.4) for 20 min. The cells were washed with PBS and analyzed for ROS fluorescence intensity using a fluorescence microscope.
Zebrafish maintenance and PM2.5 treatment
AB strain zebrafish, which were provided by Dr. Kang CH (Nakdong National Institute of Biological Resources, Sangju, Korea) were maintained at 28.5°C with a 14/10 h light/dark cycle according to the standard guidelines of the Animal Care and Use Committee of Jeju National University (Jeju, Korea; Approval No. 2019-0053). Fertilized embryos were collected after natural spawning as previously described [34] and cultured in 2 mg/L methylene blue containing E3 embryo media at 28.5°C. Three days post-fertilized (dpf) zebrafish larvae were treated with 200 µg/mL and 400 µg/mL SF for 1 h and then placed in E3 media containing 50 µg/mL PM2.5 for 24 h.
NO and ROS staining in zebrafish larvae
The production of NO and ROS in zebrafish larvae was visualized using 4-amino-5-methylamino-2′7′-difluorofluorescein diacetate (DAF-FM-DA; Sigma-Aldrich Chemical Co.) and DCF-DA, respectively, 24 h after treatment as previously described [34]. In brief, zebrafish embryos (4 dpf) were transferred to 24-well plates and incubated with 5 µM DAF-FM-DA and 20 µM DCF-DA for 30 min and visualized using the CELENA® S Digital Imaging System (Logos Biosystems, Anyang, Korea). Fluorescence intensities were calculated using ImageJ software (Wayne Rasband; National Institute of Health, Bethesda, MD, USA) and expressed as a percentage compared to the untreated control.
Statistical analysis
The data were analyzed with GraphPad Prism software (GraphPad Software, Inc., La Jolla, CA, USA) using one-way analysis of variance for multiple comparisons, followed by Tukey's post hoc test. All numerical data are presented as the mean ± standard deviation of at least triplicate experiments. P-values of less than 0.05 were considered statistically significant.
Go to :
RESULTS
Effect of SF on the proliferation of RAW 264.7 macrophages
The cytotoxic effect of SF on RAW 264.7 cells was determined by the MTT assay. According to the results of this study, at concentrations below 400 µg/mL SF was not cytotoxic to RAW 264.7 cells. Subsequent experiments showed that the survival rate of RAW 264.7 cells treated with 50 µg/mL PM2.5 alone was slightly lower than that of control cells, but there was no statistical difference between the 2 groups. Additionally, administration of less than 400 µg/mL SF to 50 µg/mL PM2.5-treated RAW 264.7 cells did not show any significant adverse effects on cell viability (data not shown).
SF inhibits PM2.5-induced NO and PGE2 production in RAW 264.7 macrophages
To evaluate the anti-inflammatory effects of SF, changes in the levels of released pro-inflammatory mediators such as NO and PGE2 were detected in RAW 264.7 cells pre-treated with SF for 1 h and then stimulated with PM2.5 for 24 h. As shown in Fig. 1A and B, PM2.5 treatment greatly increased the release of NO and PGE2 compared to the untreated control, but this increase was significantly reduced in SF-pre-treated cells in a concentration-dependent manner. Next, we investigated whether SF could inhibit the expression of iNOS and COX-2 by PM2.5. According to the RT-PCR and Western blot results, the mRNA and protein expression of iNOS and COX-2 increased by PM2.5 was significantly suppressed in the presence of SF (Fig. 2).
 | Fig. 1Effect of SF on the production pro-inflammatory mediators and cytokines in PM2.5-stimulated RAW 264.7 macrophages. Cells were treated with the indicated concentrations of SF for 1 h and then stimulated with 50 µg/mL PM2.5 for 24 h. (A) The NO concentration in the culture medium was determined by the Griess reaction. (B-D) The PGE2 (B), IL-6 (C), and IL-1β (D) concentration was determined using commercial ELISA kits. The absorbance was measured using a microplate reader. The error bars represent the mean ± SD of 3 independent experiments.SF, Schisandrae Fructus ethanol extract; PM, particulate matter; NO, nitric oxide; PGE2, prostaglandin E2; IL, interleukin; ELISA, enzyme-linked immunosorbent assay.
***P < 0.001 vs. PM2.5-unstimulated cells; #P < 0.05, ##P < 0.01 and ###P < 0.001 vs. PM2.5-stimulated cells.
|
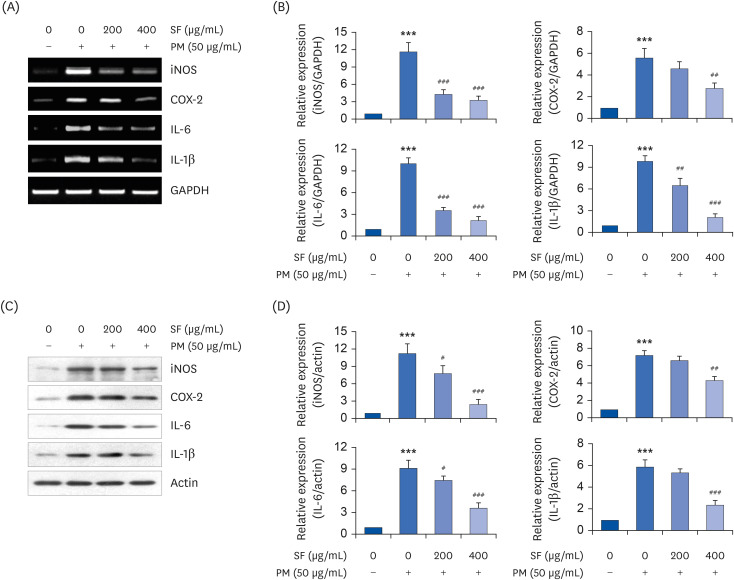 | Fig. 2Effect of SF on the expression of pro-inflammatory enzymes and cytokines in PM2.5-stimulated RAW 264.7 macrophages. Cells were treated with the indicated concentrations of SF for 1 h and then stimulated with 50 µg/mL PM2.5 for 24 h. After treatment, total RNA and protein were extracted from the cells. The expression levels of iNOS, COX-2, IL-6, and IL-1β mRNA (A) and proteins (C) were measured by RT-PCR and Western blot analysis, respectively. GAPDH and actin and were used as internal controls for the RT-PCR and Western blot analyses, respectively. (B, D) Bands were quantified using ImageJ and normalized to GAPDH and actin, and the ratio was determined. Data are expressed as the mean ± SD of 3 independent experiments.SF, Schisandrae Fructus ethanol extract; PM, particulate matter; iNOS, inducible nitric oxide synthase; COX-2, cyclooxygenase-2; IL, interleukin; RT-PCR, reverse transcription-polymerase chain reaction; GAPDH, glyceraldehyde-3-phosphate dehydrogenase.
***P < 0.001 vs. PM-unstimulated cells; #P < 0.05, ##P < 0.01 and ###P < 0.001 vs. PM-stimulated cells.
|
SF reduces the production and expression of PM2.5-induced pro-inflammatory cytokines in RAW 264.7 macrophages
Next, we investigated the effect of SF on the production and expression of pro-inflammatory cytokines increased by PM2.5 treatment. Our results showed that the amount of pro-inflammatory cytokines, including IL-6 and IL-1β released into the culture supernatant after stimulation with PM2.5 increased significantly. However, the enhanced production of these cytokines by PM2.5 was significantly suppressed by SF pretreatment, and this effect was dependent upon the SF treatment concentration (Fig. 1C and D). Subsequently, whether the inhibition of cytokine production by SF in PM2.5-treated RAW 264.7 cells was associated with the decreased expression of these genes was also investigated. As shown in Fig. 2, PM2.5 treatment significantly increased the expression of these cytokine proteins, but their expression was reduced in cells pre-treated with SF.
SF suppresses the nuclear translocation of NF-κB in PM2.5-stimulated RAW 264.7 macrophages
We further investigated whether SF inhibits the PM2.5-mediated activation of NF-κB because it is a key factor controlling the transcription of pro-inflammatory enzymes and cytokines. As shown in Fig. 3A and B, when RAW 264.7 cells were stimulated with PM2.5, the expression of NF-κB in the nucleus was significantly increased compared with the control group. By contrast, the level of IκB-α in the cytoplasm was decreased by the treatment of PM2.5, indicating that NF-κB was activated. However, SF reduced the nuclear accumulation of NF-κB p65, and the degradation of IκB-a induced by PM2.5. Consistent with the immunoblotting results, the increase in fluorescence intensity of NF-κB p65 observed in the nuclei of PM2.5-treated cells was markedly decreased by pretreatment with SF, as shown in Fig. 3C.
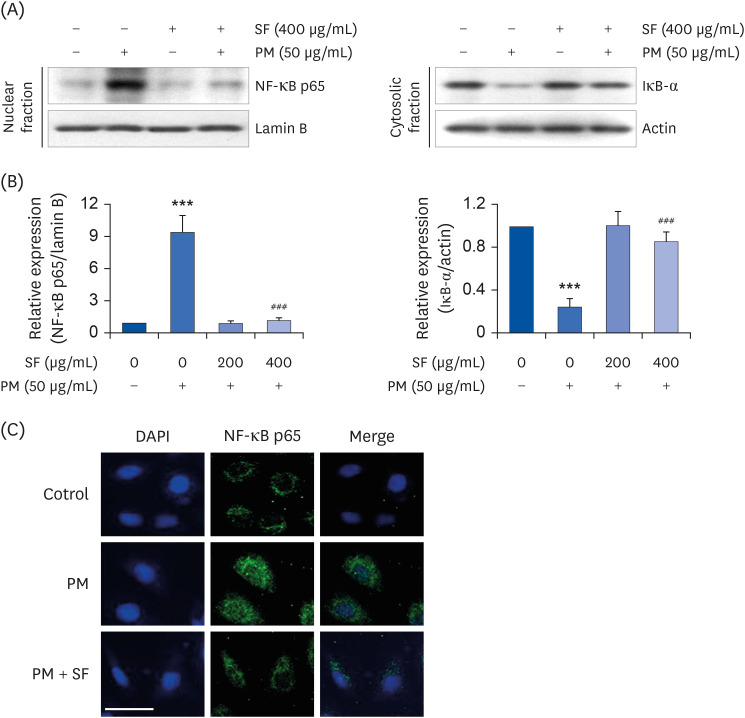 | Fig. 3Inactivation of NF-κB signaling pathway by SF in PM2.5-stimulated RAW 264.7 macrophages. Cells were treated with 400 µg/mL SF alone for 24 h or pre-treated with or without 400 µg/mL SF for 1 h before 50 µg/mL PM2.5 stimulation for 1 h. (A) For Western blot analysis, nuclear and cytosolic proteins were isolated, and the expression of NF-κB and IκB-a was investigated. Protein loading was confirmed by the analysis of lamin B or actin expression in each protein extract.(B) Bands were quantified using ImageJ and normalized to lamin B and actin, and the ratio was determined. Data are expressed as the mean ± SD of 3 independent experiments. (C) The cells were subjected to immunofluorescence staining with NF-κB p65 antibody and representative fluorescence images were acquired using a fluorescence microscope. Green fluorescence indicates the localization of NF-κB p65 and blue fluorescence by DAPI staining allows visualization of the nuclei (scale bar = 200 µM).SF, Schisandrae Fructus ethanol extract; PM, particulate matter; NF-κB, nuclear factor-kappa B; DAPI, 4′,6-diamidino-2-phenylindole.
***P < 0.001 vs. PM-unstimulated cells; ###P < 0.001 vs. PM-stimulated cells.
|
SF alleviates the PM2.5-mediated generation of ROS in RAW 264.7 macrophages
Because oxidative stress also plays an important role in the activation of macrophages and inducing inflammatory responses, we investigated whether SF suppresses PM2.5-induced oxidative stress using the DCF-DA probe. The flow cytometry results showed that the levels of intracellular ROS contents increased with the stimulation of PM2.5 (Fig. 4A and B). However, the increase in ROS content in RAW 264.7 cells treated with PM2.5 was dramatically reduced by the addition of SF. In addition, PM2.5-induced ROS production was significantly decreased through NAC pretreatment, a ROS scavenger, but the NF-κB specific inhibitor JSH-23 failed to alleviate the redox disorders caused by PM2.5. Consistent with the results from the flow cytometry, the increase in the fluorescence intensity of DCF-DA observed in the cells treated with PM2.5 was weakened by pretreatment of SF (Fig. 4C).
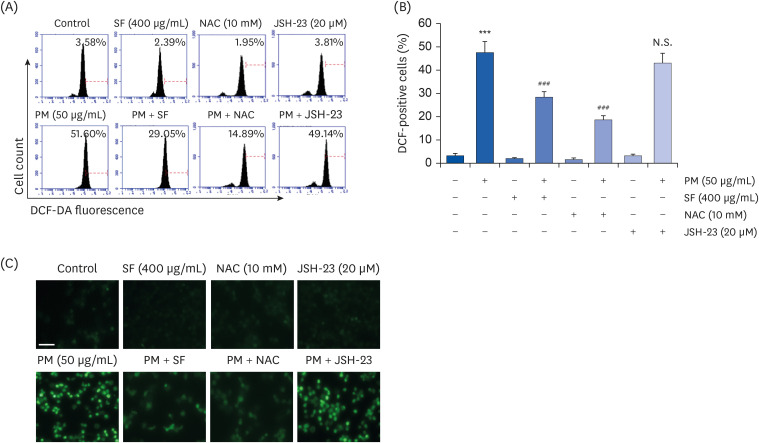 | Fig. 4Inhibition of ROS generation by SF in PM2.5-stimulated RAW 264.7 macrophages. Cells were pre-treated with 400 µg/mL SF, 10 mM NAC or 20 µM JSH-23 for 1 h and then treated with 50 µg/mL PM2.5 for 1 h. (A) The DCF-DA-stained cells were collected, and then DCF fluorescence was analyzed by flow cytometry. (B) Data are given as the mean ± SD of 3 independent experiments. (C) ROS generation was also detected by a fluorescence microscope and representative fluorescence micrographs depicting ROS generation are presented. Green fluorescence indicates the intensity of ROS generation (scale bar = 200 µM).ROS, reactive oxygen species; SF, Schisandrae Fructus ethanol extract; NAC, N-acetyl cysteine; JSH-23, 4-methyl-N
1-(3-phenyl-propyl)-benzene-1,2-diamine; DCF-DA, 5,6-carboxy-2′,7′-dichlorofluorescein diacetate; N.S., not significant; PM, particulate matter.
***P < 0.001 vs. PM2.5-unstimulated cells; ###P < 0.001 vs. PM2.5-stimulated cells.
|
The inhibitory effect of SF on PM2.5-induced NF-κB activation and inflammatory response is ROS-dependent in RAW 264.7 macrophages
We next investigated whether the inhibitory effect of SF on NF-κB activation and inflammatory response in PM2.5-treated cells was ROS-dependent. As shown in Fig. 5A and B, PM2.5-induced nuclear accumulation of NF-κB p65 and degradation of IκB-a were markedly inhibited in the presence of NAC. Furthermore, the increased production of inflammatory mediator and cytokine such as NO and IL-6 by PM2.5 was significantly canceled under the condition of NAC pretreatment, similar to that in SF pre-treated cells (Fig. 5C and D).
 | Fig. 5Role of ROS on the inhibitory effect of SF on PM2.5-induced NF-κB activation and inflammatory response. Cells were pre-treated with 400 µg/mL SF or 10 mM NAC for 1 h and then treated with 50 µg/mL PM2.5 for 1 h (A, B) or 24 h (C, D). (A, B) Nuclear and cytosolic proteins were isolated, and the expression of NF-κB and IκB-a was investigated. Protein loading was confirmed by the analysis of lamin B or actin expression in each protein extract. (B) Bands were quantified using ImageJ and normalized to lamin B and actin, and the ratio was determined. The NO (C) and IL-6 (D) concentration in the culture medium was determined by the Griess reaction and IL-6 ELISA kit, respectively. The absorbance was measured using a microplate reader. (B-D) Data are expressed as the mean ± SD of 3 independent experiments.ROS, reactive oxygen species; SF, Schisandrae Fructus ethanol extract; PM, particulate matter; NF-κB, nuclear factor-kappa B; NO, nitric oxide; IL, interleukin; ELISA, enzyme-linked immunosorbent assay.
***P < 0.001 vs. PM-unstimulated cells; ##P < 0.01 and ###P < 0.001 vs. PM-stimulated cells.
|
SF weakens the production of NO and ROS in PM2.5-treated zebrafish larvae
As SF downregulates inflammatory and oxidative responses in RAW 264.7 macrophages, we wondered if SF had a similar effect in the in vivo model and demonstrated it using the zebrafish model. According to the results of DAF-FM-DA staining, PM2.5 treatment significantly increased NO generation. However, in the presence of SF within a non-toxic range, the PM2.5-induced NO generation gradually decreased in a concentration-dependent manner (Fig. 6A and B). In addition, we confirmed by DCF-DA staining that the increased ROS accumulation in PM2.5-stimulated zebrafish larvae was dose-dependently abrogated in the presence of SF (Fig. 6C and D).
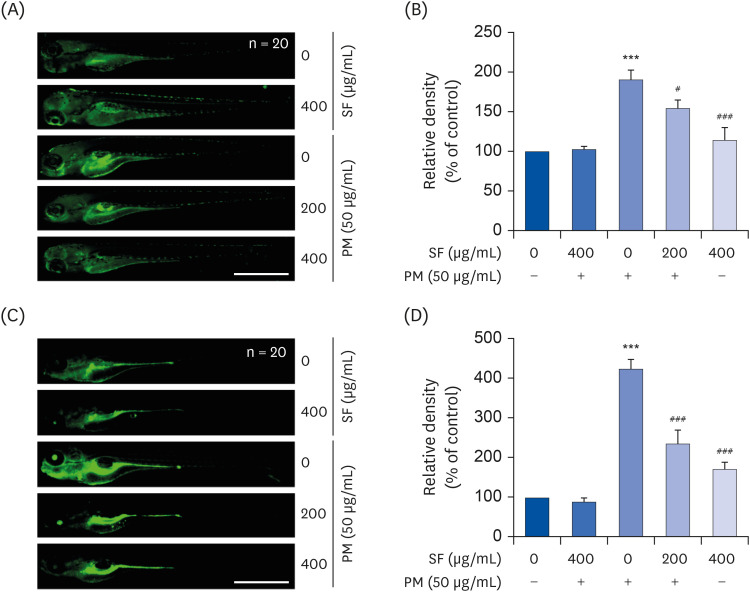 | Fig. 6Inhibition of PM2.5-induced NO and ROS generation by SF in zebrafish larvae. Zebrafish at 3 dpf were treated with 50 µg/mL PM2.5 and placed in E3 media containing the indicated concentrations of SF for 24 h. The larvae were incubated with 5 µM DAF-FM-DA (A, B) or 20 µM DCF-DA (C, D) for NO and ROS detection and visualized using the CELENA® S Digital Imaging System (scale bar = 1,000 µm). (B, D) Relative fluorescence intensities were calculated and expressed compared to the untreated control. Each value indicates the mean ± SD of 3 independent experiments. Significant differences among the groups were determined.PM, particulate matter; NO, nitric oxide; ROS, reactive oxygen species; SF, Schisandrae Fructus ethanol extract; dpf, days post-fertilized; DAF-FM-DA, 4-amino-5-methylamino-2′7′-difluorofluorescein diacetate; DCF-DA, 5,6-carboxy-2′,7′-dichlorofluorescein diacetate.
***P < 0.001 vs. PM2.5-unstimulated larvae; #P < 0.05 and ###P < 0.001 vs. PM2.5-stimulated larvae.
|
Go to :
DISCUSSION
In this study, to evaluate the anti-inflammatory efficacy of SF against PM2.5, we first investigated its effect on the production of NO and PGE2, which are classified as pro-inflammatory mediators [35363738]. Among them, NO, which is synthesized from L-arginine by NO synthase, plays a critical role in normal physiological conditions such as vasodilation, neurotransmission, and immune defense. However, excessive NO formation due to increased iNOS expression promotes the inflammatory response and increases oxidative stress [3738]. COX enzymes catalyze the conversion of arachidonic acid to prostaglandins, including PGE2, a group of hormone-like substances that participate in various body functions [3536]. However, excessive PGE2 production, promoted by the increased activity of COX-2 following various inflammatory stimuli, plays an important role as an inflammatory mediator [3738]. Our data indicated that the up-graduated secretion of NO and PGE2 by PM2.5 in RAW 264.7 macrophages was progressively inhibited at increasing concentrations of SF, which was associated with inhibition of the expression of iNOS and COX-2 mRNA and protein. These data demonstrated that the anti-inflammatory effect of SF was due to the reduced expression of iNOS and COX-2, which are involved in NO and PGE2 production.
During the inflammatory response, macrophages secrete multiple pro-inflammatory cytokines that are involved in various signaling pathways producing autocrine and/or paracrine effects [394041]. All of these are essential components for the initiation and improvement of the inflammatory response, and their expression is also increased by the PM2.5 stimulation of macrophages [424344]. Moreover, they can accelerate the inflammatory response by PM2.5 through activating or increasing the expression of pro-inflammatory mediators as well as other pro-inflammatory cytokines [4546]. Therefore, the level of pro-inflammatory cytokines has been applied as an indicator to evaluate anti-inflammatory efficacy in macrophages. In the current study, we found that SF reduced the production of IL-6 and IL-1β in PM2.5-stimulated RAW 264.7 macrophages by suppressing their expression.
As noted in many studies, NF-κB plays a critical role in the control of inducible ant-inflammatory enzymes and cytokines in PM2.5-activated macrophages [8444748]. Typically, NF-κB forms a complex with the inhibitory subunit IκB-α and remains inactive in the cytoplasm. When IκB-α is phosphorylated and degraded through the upstream signaling systems by inflammatory stimuli, NF-κB migrates to the nucleus, triggering transcriptional activation of inflammation-inducing genes and catabolic enzymes [4950]. Therefore, the efficacy of SF on PM2.5-induced NF-κB activation was further evaluated because blocking the activity of NF-κB could be effective in treating inflammation. The current results showed that the translocation of NF-κB from the cytoplasm into the nucleus, and the degradation of IκB-α were increased in PM2.5-treated RAW 264.7 cells, but SF effectively blocked the nuclear translocation of NF-κB and the degradation of IκB-α. Therefore, the inhibitory effect of SF on the increased expression of pro-inflammatory enzymes and cytokines in PM2.5-treated RAW 264.7 macrophages is due to blocking of the nuclear translocation of NF-κB, and these results are in good agreement with the anti-inflammatory mechanisms of several natural compounds found in PM2.5-stimulated macrophages [4851].
On the other hand, endogenous free radicals like ROS play an important role in host defense. However, excess ROS can cause oxidative damage to cellular macromolecules, and has been shown to play a key role in initiating and promoting inflammation-related diseases by upregulating the production of inflammatory mediators and cytokines. ROS also contribute to the activation of macrophages, and ROS generation is enhanced in overactive macrophages [5253]. According to our results, SF strongly inhibited PM2.5-induced ROS formation in RAW 264.7 macrophages, similar to the action of a scavenger of oxidative stress NAC. We subsequently examined the role of NF-κB in the inflammatory response caused by PM2.5 using JSH-23, which inhibits NF-κB transcriptional activity. In our results, JSH-23 showed a slight ROS inhibitory effect in PM2.5-treated cells compared to the conditions in the presence of SF or NAC, but was not significant. However, when the production of ROS was artificially blocked by the pretreatment of NAC, the nuclear accumulation of NF-κB p65 and the degradation of IκB by PM2.5 were remarkably suppressed, which was associated with inhibition of the anti-inflammatory reaction. Collectively, these findings suggest that SF exerts an anti-inflammatory effect in PM2.5-stimulated RAW 264.7 macrophages by down-regulating the activation of the ROS-dependent NF-κB signaling pathway. Although the antioxidant potential of Schisandrae Fructus has been reported in several previous studies [242652], the results of this study support the use of SF as an antioxidant for the management of oxidative stress associated with inflammatory responses by PM. Recently, zebrafish (Danio rerio), which have great advantages as an in vivo animal model, is widely used as a powerful vertebrate animal model for the study of human diseases [5354]. In particular, since PM-stimulated zebrafish exhibit inflammatory and oxidative reactions similar to those of mammals, and is recognized as an optimal in vivo model for evaluating anti-inflammatory and antioxidant efficacy of various drugs [5556575859]. Since in vivo experiments can provide a better understanding of efficacy assessment at the organism level, the anti-inflammatory and antioxidant potential of SF identified in macrophages was further confirmed in the zebrafish model. The results of this study showed the ability of SF to inhibit inflammatory and oxidative reactions in the PM2.5-treated zebrafish larvae model by reducing NO and ROS generation. Although these results support our in vitro results, additional mechanistic studies are needed to interpret the mechanisms related to the anti-inflammatory and antioxidant efficacy of SF in in vivo model. Furthermore, it is necessary to identify the active ingredients contained in SF that modulates the anti-inflammatory and/or antioxidant responses in RAW 264.7 macrophages stimulated with PM2.5.
In summary, in the present study, we demonstrated that SF markedly reversed the production of pro-inflammatory mediators and cytokines in PM2.5-treated RAW 264.7 macrophages. In addition, SF significantly attenuated PM2.5-induced ROS production, and enhanced the inactivation of the NF-κB signaling pathway. Furthermore, the anti-inflammatory and antioxidant activities of SF were also confirmed in an in vivo zebrafish model. Therefore, our results suggest that SF or its constituents may minimize the severity of oxidative stress and inflammation caused by PM2.5. However, further studies are needed to determine the role of other cellular signaling pathways that may be involved in the anti-inflammatory activity of SF other than the NF-κB signaling pathway, and to determine the direct relationship with NF-κB signaling.
Go to :
 XML Download