Abstract
References
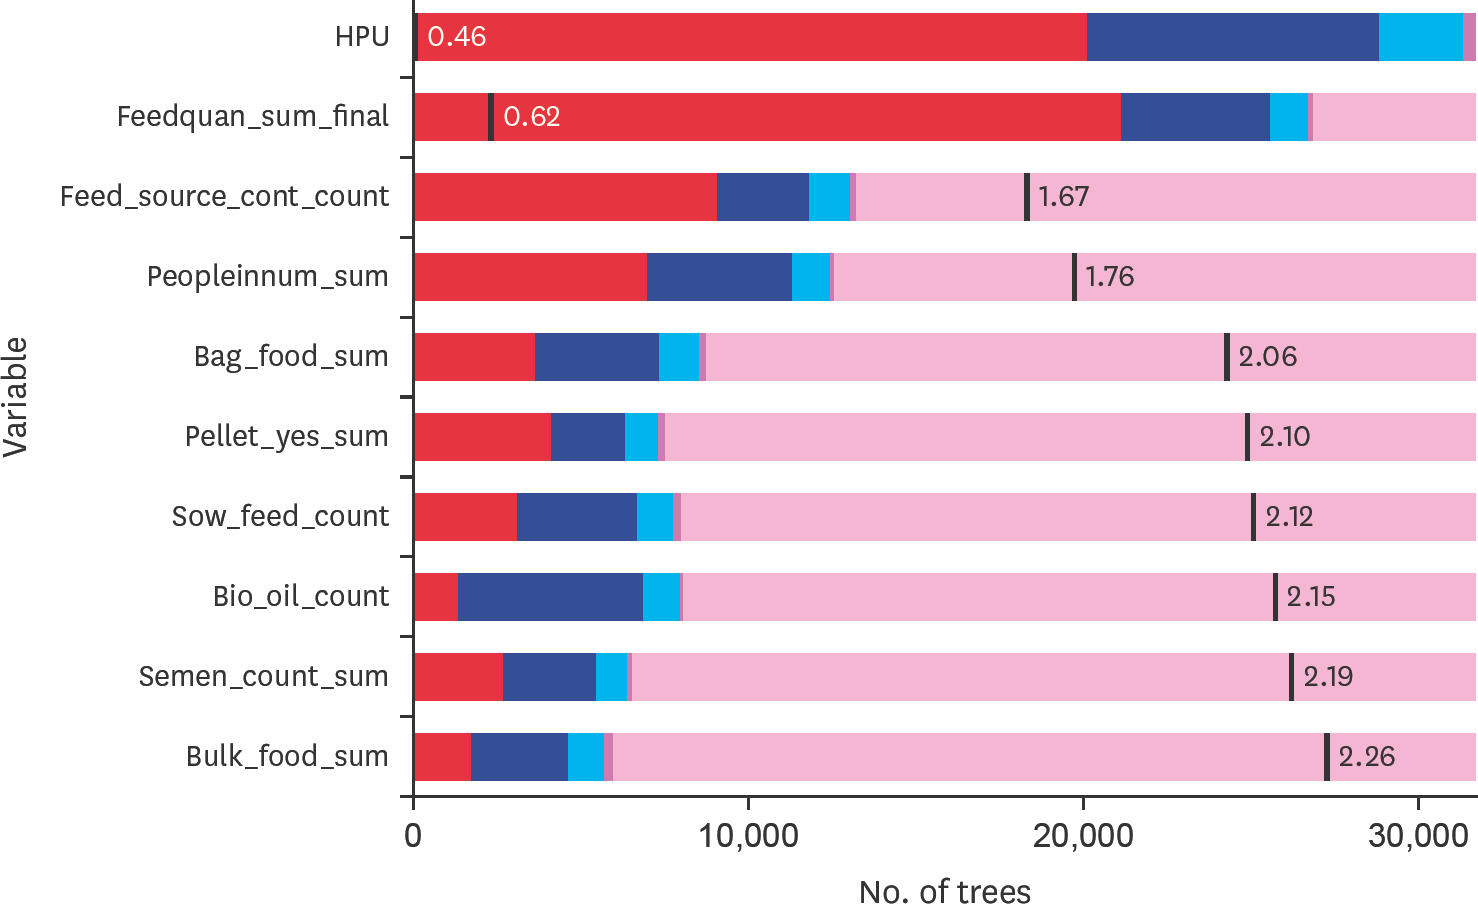
 | Fig. 1.The distribution and mean minimal depth for the top variables for predicting porcine epidemic diarrhea virus during the incursion of the virus in Canadian swine herds, 2014. The vertical black line represents the mean minimal depth. The x-axis ranges from zero to 30 000 trees in which is the maximum any variable was used for splitting on X j. Variable HPU is the only variable that reaches the maximum number of trees. HPU, heat producing unit. |
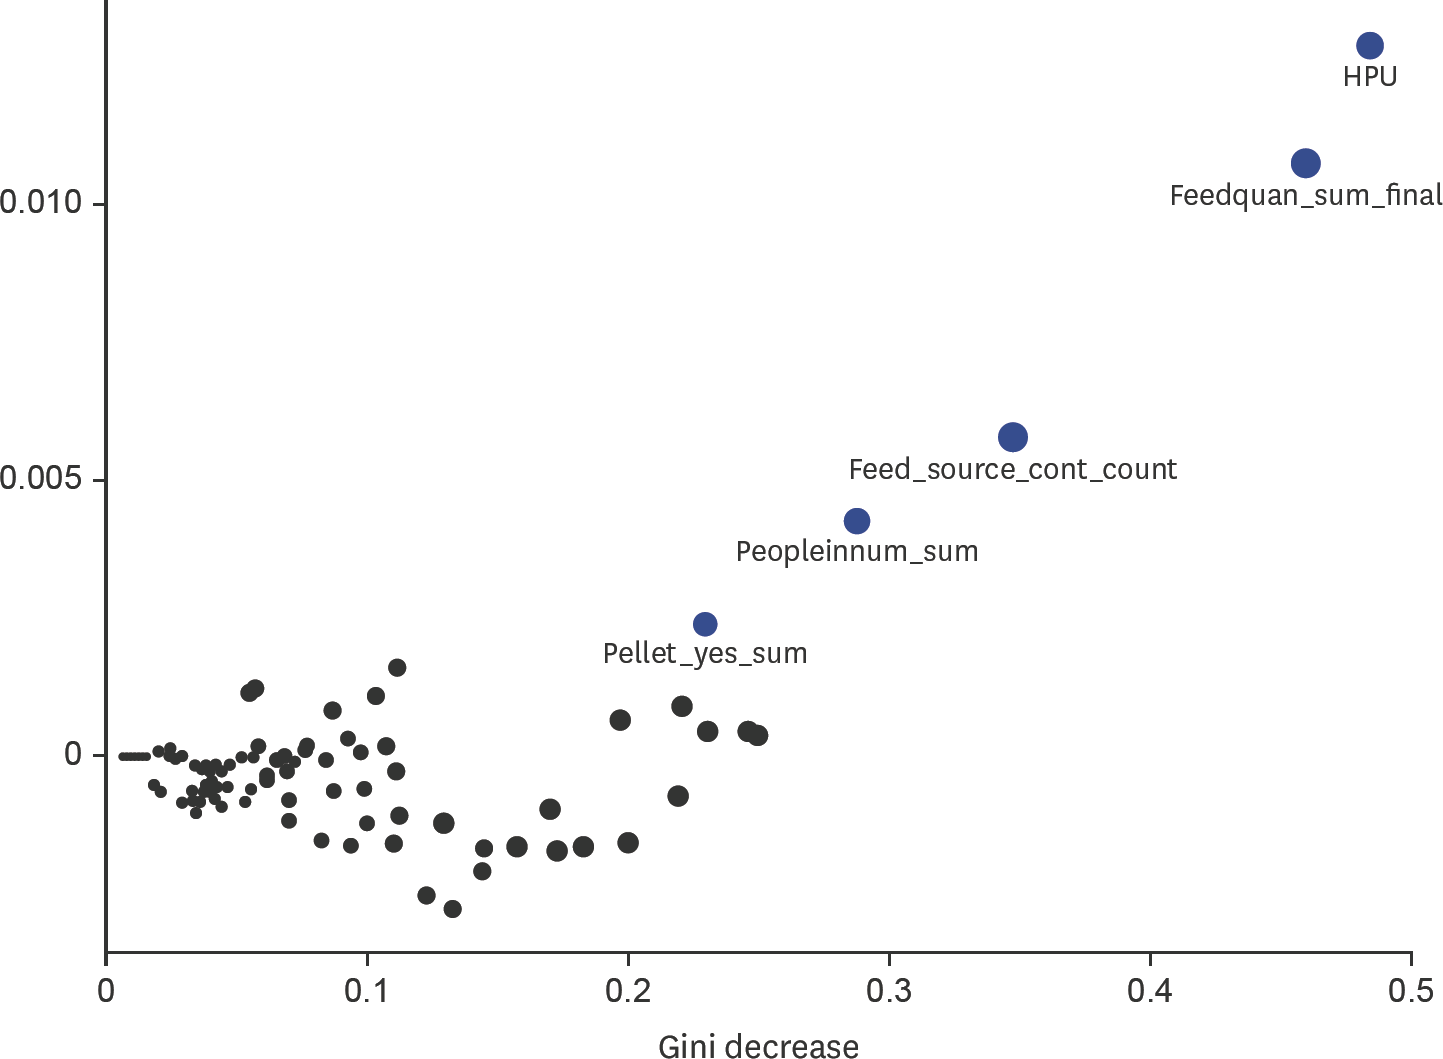
 | Fig. 2.Multi-importance plot using the accuracy decrease, Gini decrease and number of times as a root node to visually identify variables for predicting porcine epidemic diarrhea virus during the incursion of the virus in Canadian swine herds using random forests. The blue circles represent the top variables (most important) for predicting herd status (case versus control herd) and the black variables are the remaining variables using in the random forest model. HPU, heat producing unit. |
Table 1.
† PED-affected and non-affected herds were selected from the case-control study conducted by Perri et al. [20]. PED-affected herds were confirmed positive using real-time reverse, transcriptase polymerase chain reaction. The study period for recruiting PED-affected and non-affected herds was from January 22, 2014 to March 1, 2014.
Table 2.
* PED-affected and non-affected herds were selected from the case-control study conducted by Perri et al. [20]. PED-affected herds were confirmed positive using real-time reverse, transcriptase polymerase chain reaction. The study period for recruiting PED-affected and non-affected herds was from January 22, 2014 to March 1, 2014.
Table 3.
* PED-affected and non-affected herds were selected from the case-control study conducted by Perri et al. [20]. PED-affected herds were confirmed positive using real-time reverse, transcriptase polymerase chain reaction. The study period for recruiting PED-affected and non-affected herds was from January 22, 2014 to March 1, 2014.
Table 4.
* PED-affected and non-affected herds were selected from the case-control study conducted by Perri et al. [20]. PED-affected herds were confirmed positive using real-time reverse, transcriptase polymerase chain reaction. The study period for recruiting PED-affected and non-affected herds was from January 22, 2014 to March 1, 2014.
Table 5.
* PED-affected and non-affected herds were selected from the case-control study conducted by Perri et al. [20]. PED-affected herds were confirmed positive using real-time reverse, transcriptase polymerase chain reaction. The study period for recruiting PED-affected and non-affected herds was from January 22, 2014 to March 1, 2014.
Table 6.
* PED-affected and non-affected herds were selected from the case-control study conducted by Perri et al. [20]. PED-affected herds were confirmed positive using real-time reverse, transcriptase polymerase chain reaction. The study period for recruiting PED-affected and non-affected herds was from January 22, 2014 to March 1, 2014.
Table 7.
* PED-affected and non-affected herds were selected from the case-control study conducted by Perri et al. [20]. PED-affected herds were confirmed positive using real-time reverse, transcriptase polymerase chain reaction. The study period for recruiting PED-affected and non-affected herds was from January 22, 2014 to March 1, 2014.
Table 8.
* PED-affected and non-affected herds were selected from the case-control study conducted by Perri et al. [20]. PED-affected herds were confirmed positive using real-time reverse, transcriptase polymerase chain reaction. The study period for recruiting PED-affected and non-affected herds was from January 22, 2014 to March 1, 2014.


 PDF
PDF ePub
ePub Citation
 Print
Print


 XML Download