Abstract
Objective
To evaluate the effect of elevated plasma fibrinogen levels on the prognosis of epithelial ovarian cancer (EOC).
Methods
We reviewed the data of 217 patients with advanced-stage EOC between 2000 and 2012, and investigated the prognostic role of elevated plasma fibrinogen levels compared with serum CA-125 levels, neutrophil to lymphocyte ratio (NLR) and platelet to lymphocyte ratio (PLR). For further evaluation, we performed a meta-analysis using 5 cohort studies published to July 2015, including our cohort study after a literature review.
Results
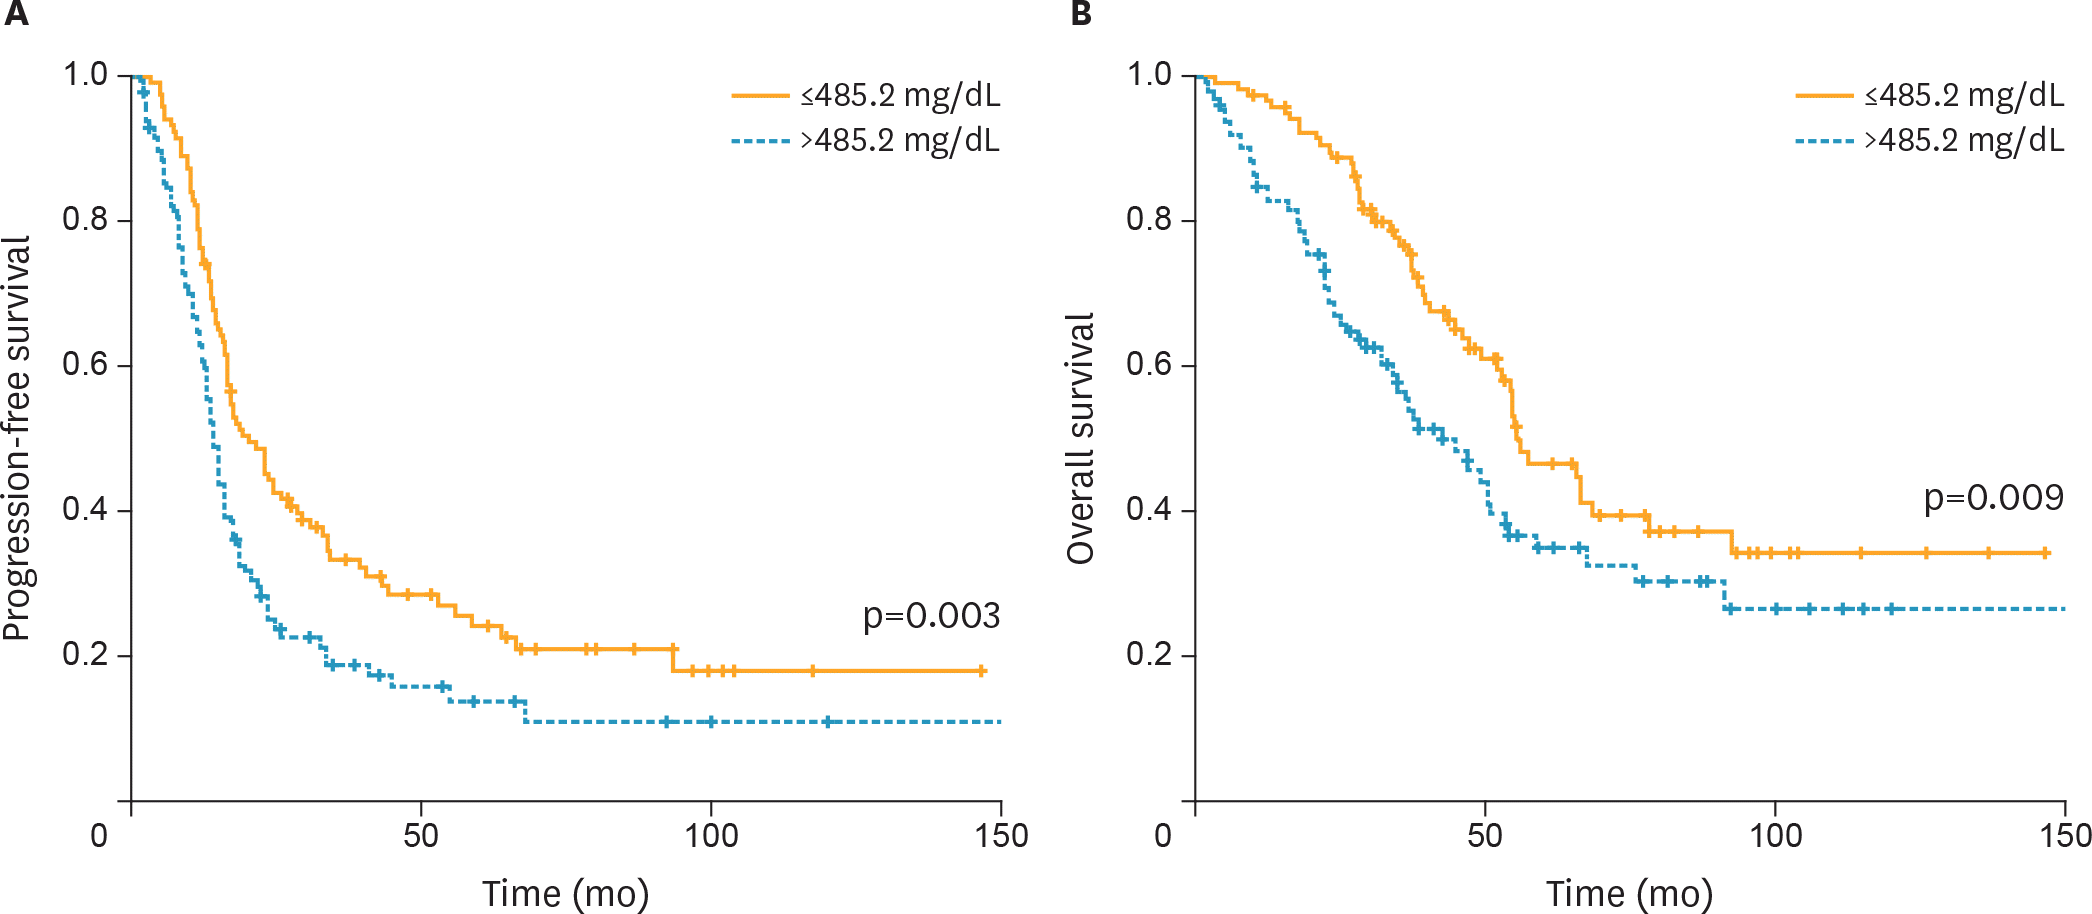
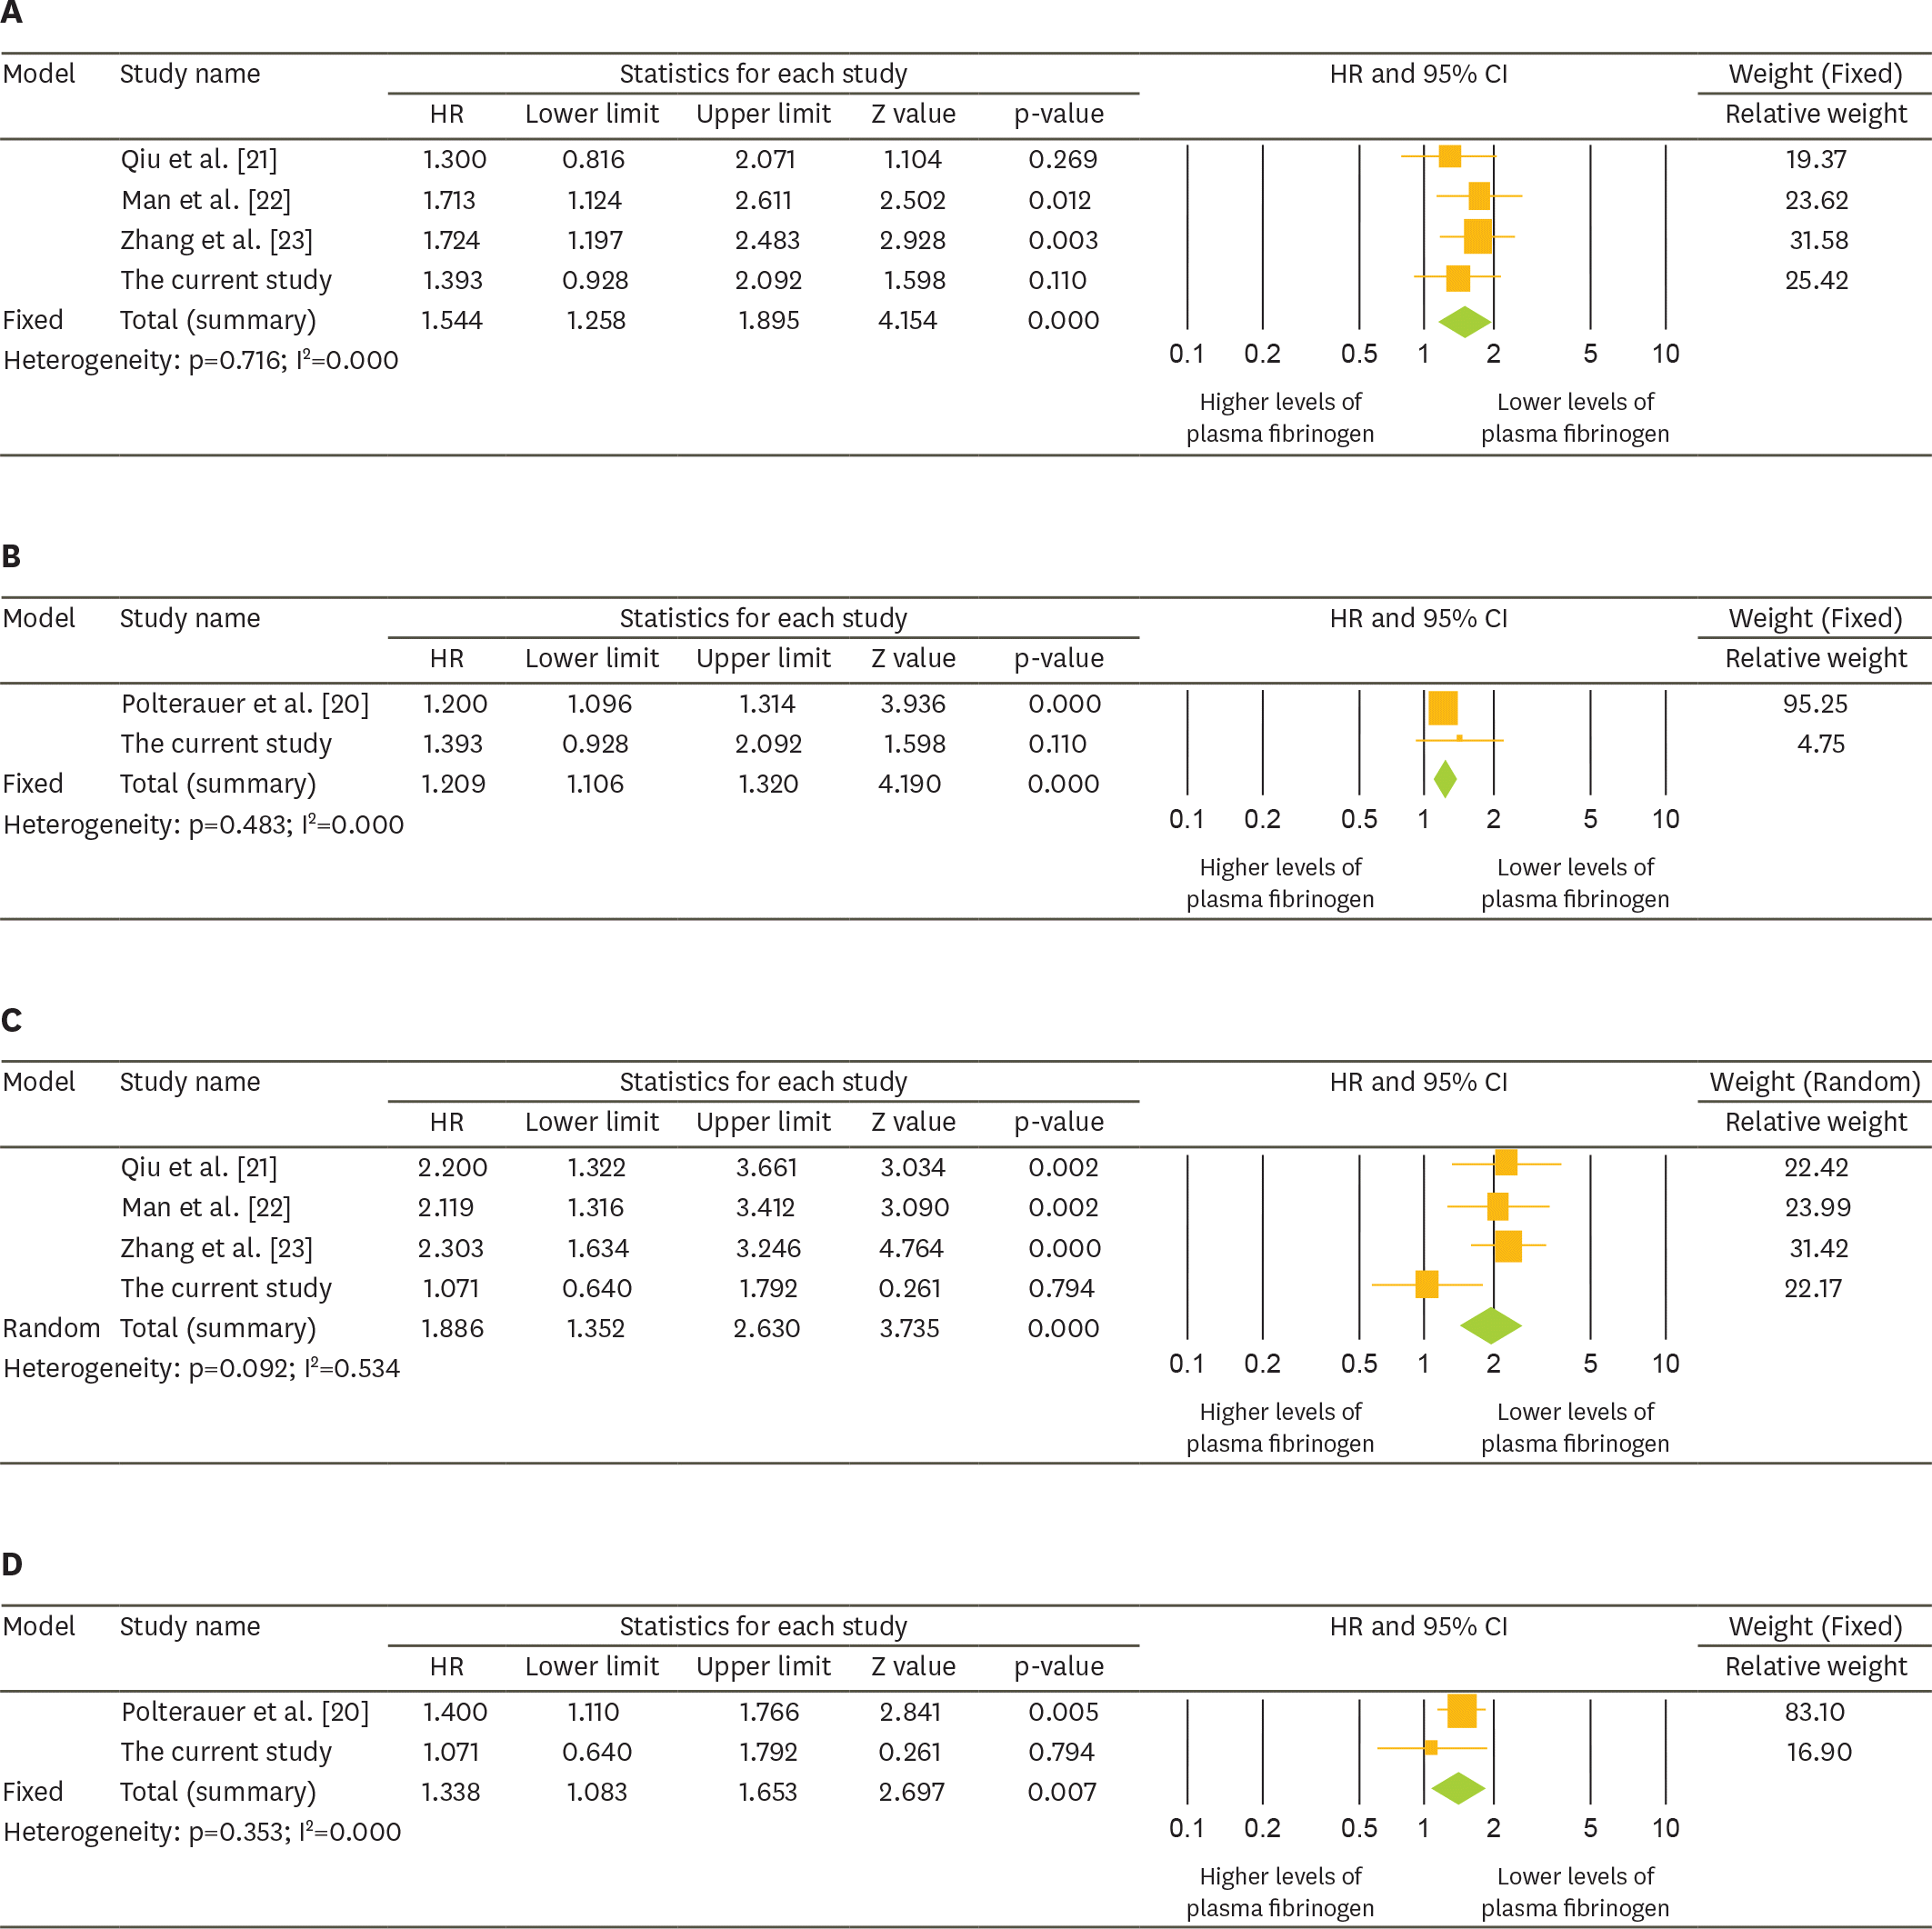
Among the four biomarkers, only plasma fibrinogen levels >485.2 mg/dL were correlated with impaired progression-free survival (PFS) and overall survival (OS) (median, 13.9 vs. 20.3 months and 42.2 vs. 55.4 months; p<0.010). Elevated plasma fibrinogen levels were an independent factor for poor PFS with marginal significance and OS (adjusted hazard ratios [HRs]=1.389 and 1.581; 95% confidence intervals [CIs]=0.979–1.972 and 1.032–2.423, respectively). Furthermore, crude and subgroup meta-analyses demonstrated that elevated plasma fibrinogen levels were associated with impaired PFS and OS in patients with all stage EOC.
Go to : 
References
1. Suh DH, Lee KH, Kim K, Kang S, Kim JW. Major clinical research advances in gynecologic cancer in 2014. J Gynecol Oncol. 2015; 26:156–67.

2. Park JY, Ngan HY, Park W, Cao Z, Wu X, Ju W, et al. Asian Society of Gynecologic Oncology International Workshop 2014. J Gynecol Oncol. 2015; 26:68–74.

3. Hermsen BB, von Mensdorff-Pouilly S, Berkhof J, van Diest PJ, Gille JJ, Menko FH, et al. Serum CA-125 in relation to adnexal dysplasia and cancer in women at hereditary high risk of ovarian cancer. J Clin Oncol. 2007; 25:1383–9.

4. Han LY, Karavasilis V, Hagen T, Nicum S, Thomas K, Harrison M, et al. Doubling time of serum CA125 is an independent prognostic factor for survival in patients with ovarian cancer relapsing after first-line chemotherapy. Eur J Cancer. 2010; 46:1359–64.

5. Barlow TS, Przybylski M, Schilder JM, Moore DH, Look KY. The utility of presurgical CA125 to predict optimal tumor cytoreduction of epithelial ovarian cancer. Int J Gynecol Cancer. 2006; 16:496–500.

6. Mury D, Woelber L, Jung S, Eulenburg C, Choschzick M, Witzel I, et al. Prognostic and predictive relevance of CA-125 at primary surgery of ovarian cancer. J Cancer Res Clin Oncol. 2011; 137:1131–7.

7. Kim HS, Choi HY, Lee M, Suh DH, Kim K, No JH, et al. Systemic inflammatory response markers and CA-125 levels in ovarian clear cell carcinoma: a two center cohort study. Cancer Res Treat. 2016; 48:250–8.

8. Lee JY, Kim HS, Suh DH, Kim MK, Chung HH, Song YS. Ovarian cancer biomarker discovery based on genomic approaches. J Cancer Prev. 2013; 18:298–312.

9. Wang X, Wang E, Kavanagh JJ, Freedman RS. Ovarian cancer, the coagulation pathway, and inflammation. J Transl Med. 2005; 3:25.

10. Shan W, Yang G, Liu J. The inflammatory network: bridging senescent stroma and epithelial tumorigenesis. Front Biosci (Landmark Ed). 2009; 14:4044–57.

11. den Ouden M, Ubachs JM, Stoot JE, van Wersch JW. Whole blood cell counts and leucocyte differentials in patients with benign or malignant ovarian tumours. Eur J Obstet Gynecol Reprod Biol. 1997; 72:73–7.

12. Cho H, Hur HW, Kim SW, Kim SH, Kim JH, Kim YT, et al. Pre-treatment neutrophil to lymphocyte ratio is elevated in epithelial ovarian cancer and predicts survival after treatment. Cancer Immunol Immunother. 2009; 58:15–23.

13. Wang Y, Liu P, Xu Y, Zhang W, Tong L, Guo Z, et al. Preoperative neutrophil-to-lymphocyte ratio predicts response to first-line platinum-based chemotherapy and prognosis in serous ovarian cancer. Cancer Chemother Pharmacol. 2015; 75:255–62.

15. Lawrence SO, Simpson-Haidaris PJ. Regulated de novo biosynthesis of fibrinogen in extrahepatic epithelial cells in response to inflammation. Thromb Haemost. 2004; 92:234–43.
16. von Tempelhoff GF, Nieman F, Heilmann L, Hommel G. Association between blood rheology, thrombosis and cancer survival in patients with gynecologic malignancy. Clin Hemorheol Microcirc. 2000; 22:107–30.

17. Takeuchi H, Ikeuchi S, Kitagawa Y, Shimada A, Oishi T, Isobe Y, et al. Pretreatment plasma fibrinogen level correlates with tumor progression and metastasis in patients with squamous cell carcinoma of the esophagus. J Gastroenterol Hepatol. 2007; 22:2222–7.

18. Yamashita H, Kitayama J, Kanno N, Yatomi Y, Nagawa H. Hyperfibrinogenemia is associated with lymphatic as well as hematogenous metastasis and worse clinical outcome in T2 gastric cancer. BMC Cancer. 2006; 6:147.

19. Liberati A, Altman DG, Tetzlaff J, Mulrow C, Gøtzsche PC, Ioannidis JP, et al. The PRISMA statement for reporting systematic reviews and meta-analyses of studies that evaluate health care interventions: explanation and elaboration. J Clin Epidemiol. 2009; 62:e1–34.

21. Qiu J, Yu Y, Fu Y, Ye F, Xie X, Lu W. Preoperative plasma fibrinogen, platelet count and prognosis in epithelial ovarian cancer. J Obstet Gynaecol Res. 2012; 38:651–7.

22. Man YN, Wang YN, Hao J, Liu X, Liu C, Zhu C, et al. Pretreatment plasma D-dimer, fibrinogen, and platelet levels significantly impact prognosis in patients with epithelial ovarian cancer independently of venous thromboembolism. Int J Gynecol Cancer. 2015; 25:24–32.

23. Zhang WW, Liu KJ, Hu GL, Liang WJ. Preoperative platelet/lymphocyte ratio is a superior prognostic factor compared to other systemic inflammatory response markers in ovarian cancer patients. Tumour Biol. 2015; 36:8831–7.

24. Wells GA, Shea B, O'Connell D, Peterson J, Welch V, Losos M, et al. The Newcastle-Ottawa Scale (NOS) for assessing the quality of nonrandomised studies in meta-analyses [Internet]. Ottawa: Ottawa Hospital Research Institute;2011. [cited 2016 Jun 16]. Available from:. http://www.ohri.ca/programs/clinical_epidemiology/oxford.asp.
25. Tierney JF, Stewart LA, Ghersi D, Burdett S, Sydes MR. Practical methods for incorporating summary time-to-event data into meta-analysis. Trials. 2007; 8:16.

26. Higgins JP, Thompson SG, Deeks JJ, Altman DG. Measuring inconsistency in meta-analyses. BMJ. 2003; 327:557–60.

27. Powless CA, Aletti GD, Bakkum-Gamez JN, Cliby WA. Risk factors for lymph node metastasis in apparent early-stage epithelial ovarian cancer: implications for surgical staging. Gynecol Oncol 2011;122:536–40.

28. Kim HS, Kim JW, Cho JY, Chung HH, Park NH, Song YS, et al. The role of serum CA-125 levels in early-stage epithelial ovarian cancer on preoperative CT and MRI. Eur J Surg Oncol. 2009; 35:870–6.

29. Kokcu A, Kurtoglu E, Celik H, Tosun M, Malatyalıoglu E, Ozdemir AZ. May the platelet to lymphocyte ratio be a prognostic factor for epithelial ovarian cancer? Asian Pac J Cancer Prev. 2014; 15:9781–4.

30. Tas F, Kilic L, Bilgin E, Keskin S, Sen F, Ciftci R, et al. Clinical and prognostic significance of coagulation assays in advanced epithelial ovarian cancer. Int J Gynecol Cancer. 2013; 23:276–81.

31. Kim SI, Kim HS, Kim TH, Suh DH, Kim K, No JH, et al. Impact of underweight after treatment on prognosis of advanced-stage ovarian cancer. J Immunol Res. 2014; 2014:349546.

32. Kim HS, Park NH, Chung HH, Kim JW, Song YS, Kang SB. Serum CA-125 level after 6 cycles of primary adjuvant chemotherapy is a useful prognostic factor for complete responders'survival in patients with advanced epithelial ovarian cancer. Onkologie. 2008; 31:315–20.
33. Asher V, Lee J, Innamaa A, Bali A. Preoperative platelet lymphocyte ratio as an independent prognostic marker in ovarian cancer. Clin Transl Oncol. 2011; 13:499–503.

34. Palumbo JS, Kombrinck KW, Drew AF, Grimes TS, Kiser JH, Degen JL, et al. Fibrinogen is an important determinant of the metastatic potential of circulating tumor cells. Blood. 2000; 96:3302–9.

35. Lee JH, Ryu KW, Kim S, Bae JM. Preoperative plasma fibrinogen levels in gastric cancer patients correlate with extent of tumor. Hepatogastroenterology. 2004; 51:1860–3.
36. Yamashita H, Kitayama J, Nagawa H. Hyperfibrinogenemia is a useful predictor for lymphatic metastasis in human gastric cancer. Jpn J Clin Oncol. 2005; 35:595–600.

Go to : 
 | Fig. 1.Kaplan-Meier curves for (A) PFS and (B) OS broken down by the mean value (485.2 mg/dL) of plasma fibrinogen levels. OS, overall survival; PFS, progression-free survival. |
 | Fig. 2.Forest plots for HRs with 95% CIs for the effect of elevated plasma fibrinogen levels on the prognosis of EOC. (A) Effect of plasma fibrinogen levels of >400 mg/dL; (B) increase in plasma fibrinogen levels per 100 units on PFS; (C) effect of plasma fibrinogen levels of >400 mg/dL; and (D) increase in plasma fibrinogen levels per 100 units on OS. CI, confidence interval; EOC, epithelial ovarian cancer; HR, hazard ratio; OS, overall survival; PFS, progression-free survival. |
Table 1.
Plasma fibrinogen and serum CA-125 levels, neutrophil to lymphocyte and PLRs according to clinico-pathologic characteristics in 217 patients with advanced-stage EOC
Table 2.
Unfavorable factors affecting PFS and OS in 217 patients with advanced-stage EOC
Table 3.
Characteristics of 5 included studies for evaluating the impact of elevated plasma fibrinogen levels on prognosis of EOC
| Study | Country | Duration of study | FIGO stage | Cut-off values of plasma fibrinogen levels | No. of patients | Outcomes | Adjustment of potential confounding factors | |
|---|---|---|---|---|---|---|---|---|
| Higher levels of plasma fibrinogen | Lower levels of plasma fibrinogen | |||||||
| Polterauer et al. [20] | Austria | Not mentioned | I–IV | Per 100 units | 422 | PFS, OS | Age, CA-125, CRP, FIGO stage, grade, histology, residual tumor size | |
| Qiu et al. [21] | China | 2002–2005 | I–IV | 400 mg/dL | 49 | 87 | PFS, OS | Adjuvant chemotherapy, age, CA-125, FIGO stage, grade, histology, residual tumor size, thrombocytosis |
| Man et al. [22] | China | 2000–2010 | I–IV | 400 mg/dL | 80 | 110 | PFS, OS | Adjuvant chemotherapy, age, FIGO stage, grade, neoadjuvant chemotherapy, residual tumor size, VTE |
| Zhang et al. [23] | China | 2000–2012 | I–IV | 400 mg/dL | 89 | 100 | PFS, OS* | Age, albumin, ascites, CA-125, CRP, FIGO stage, grade, histology, NLR, PLR, residual tumor size |
| The current study | Korea | 2000–2012 | III–IV | Per 100 units 400 mg/dL | 142 | 217 75 | PFS, OS | Adjuvant chemotherapy, age, CA-125, FIGO stage, grade, histology, neoadjuvant chemotherapy, NLR, PLR, residual tumor size |
Table 4.
Subgroup analyses for the impact of elevated plasma fibrinogen levels on prognosis of EOC


 PDF
PDF ePub
ePub Citation
 Print
Print


 XML Download