INTRODUCTION
METHODS
Animal study
Indirect calorimetry
Histological analysis, electron microscopy, and lipid contents of the liver
OXPHOS enzyme activity, CrAT assay, acetyl-CoA and CoA measurements, and PDH activity
Gene silencing
Cell culture
mRNA, DNA, and protein analyses
Visualization of mitochondria
Statistical analyses
RESULTS
Godex prevented diet-induced obesity
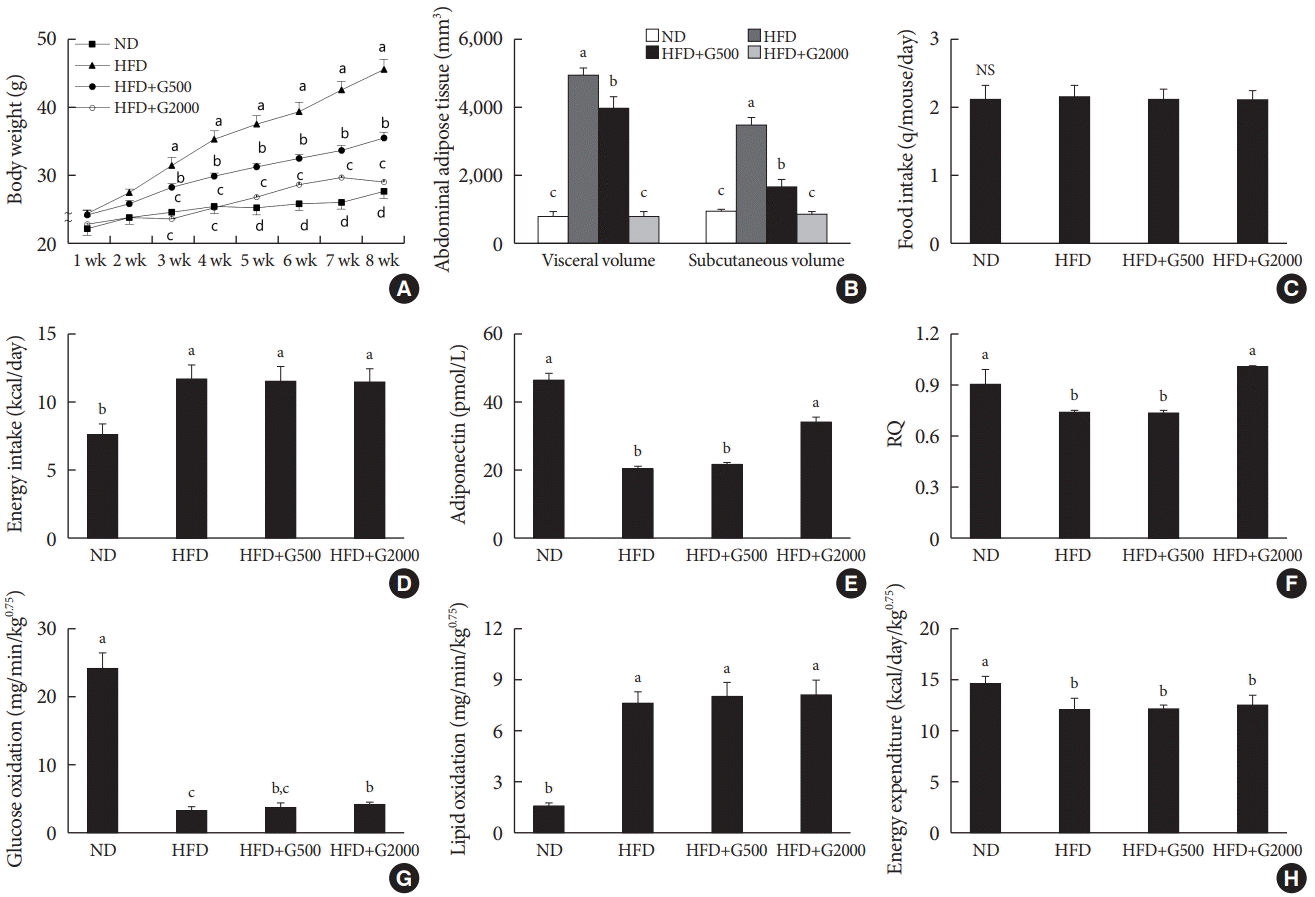 | Fig. 1.Carnitine orotate complex (Godex) prevented diet-induced obesity (A) body weight, (B) visceral and subcutaneous fat volume, (C) food intake, (D) energy intake, (E) plasma adiponectin levels, (F) respiratory quotient (RQ), (G) glucose oxidation and lipid oxidation, (H) energy expenditure in C57BL/6J mice during 8 weeks of normal-fat diet (ND) or high-fat diet (HFD) feeding. HFD mice were subdivided into vehicle-treated (HFD), Godex 500 mg/kg/body weight (B.W.) (HFD+G500), and Godex 2000 mg/kg/B.W. (HFD+G2000) groups. RQ was calculated as the ratio of carbon dioxide output (VCO2) to oxygen consumption (VO2). Energy expenditure (in kcal/day/kg0.75=1.44×VO2×[3.815+1.232×respiratory exchange ratio, RER]), glucose oxidation (in mg/min/kg0.75=[(4.545×VCO2)–(3.205×VO2)]/1,000), and lipid oxidation (in mg/min/kg0.75=[1.672×(VO2–VCO2)/1,000]) were calculated [14]. Values are presented as mean±standard deviation (n=10). NS, not significant. a,b,cValues within groups indicate significant difference at P<0.05. |
Godex alleviated hepatic steatosis
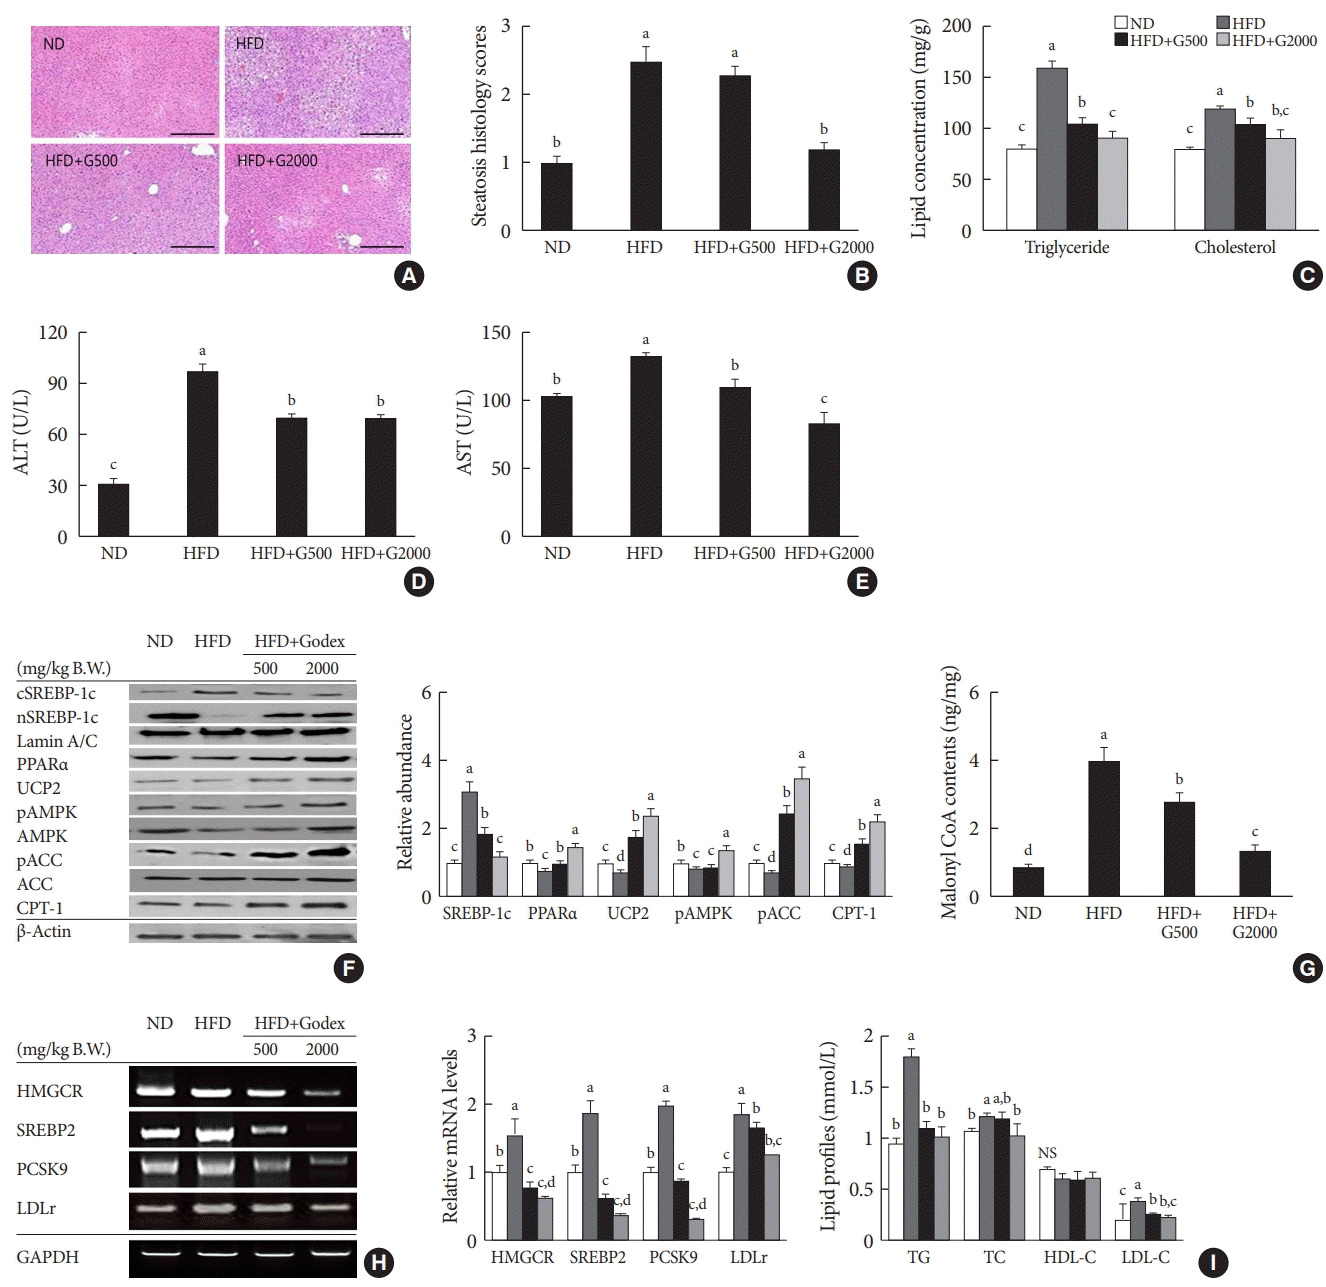 | Fig. 2.Carnitine orotate complex (Godex) alleviated hepatic steatosis. (A) H&E staining of the liver (×400), (B) steatosis histology scores, (C) hepatic lipid concentration, (D) alanine transaminase (ALT) levels, (E) aspartate aminotransferase (AST) levels, (F) β-oxidation-related protein expression in the liver, (G) hepatic malonyl coenzyme A (CoA) content, (H) hydroxymethylglutarylCoA reductase (HMGCR), sterol regulatory element-binding protein-2 (SREBP2), proprotein convertase subtilisin/kexin type 9 (PCSK9), and low-density lipoprotein receptor (LDLr) mRNA expression in the liver, (I) serum lipid profiles in C57BL/6J mice during 8 weeks of normal-fat diet (ND) or high-fat diet (HFD) feeding. HFD mice were subdivided into vehicle-treated (HFD), Godex 500 mg/kg/body weight (B.W.) (HFD+G500), and Godex 2,000 mg/kg/B.W. (HFD+G2000) groups. Data are presented as mean±standard deviation (n=10). PPARα, peroxisome proliferator-activated receptor alpha; UCP2, uncoupling protein 2; pAMPK, phosphorylated 5’AMP-activated protein kinase; pACC, phosphorylated acetyl-CoA carboxylase; CPT-1, carnitine palmitoyltransferase-1; GAPDH, glyceraldehyde 3 phosphate dehydrogenase; NS, not significant; TG, triglyceride; TC, total cholesterol; HDL-C, high-density lipoprotein cholesterol; LDL-C, low-density lipoprotein cholesterol. a,b,c,dValues within groups indicate significant difference at P<0.05. |
Godex improved mitochondrial function and biogenesis
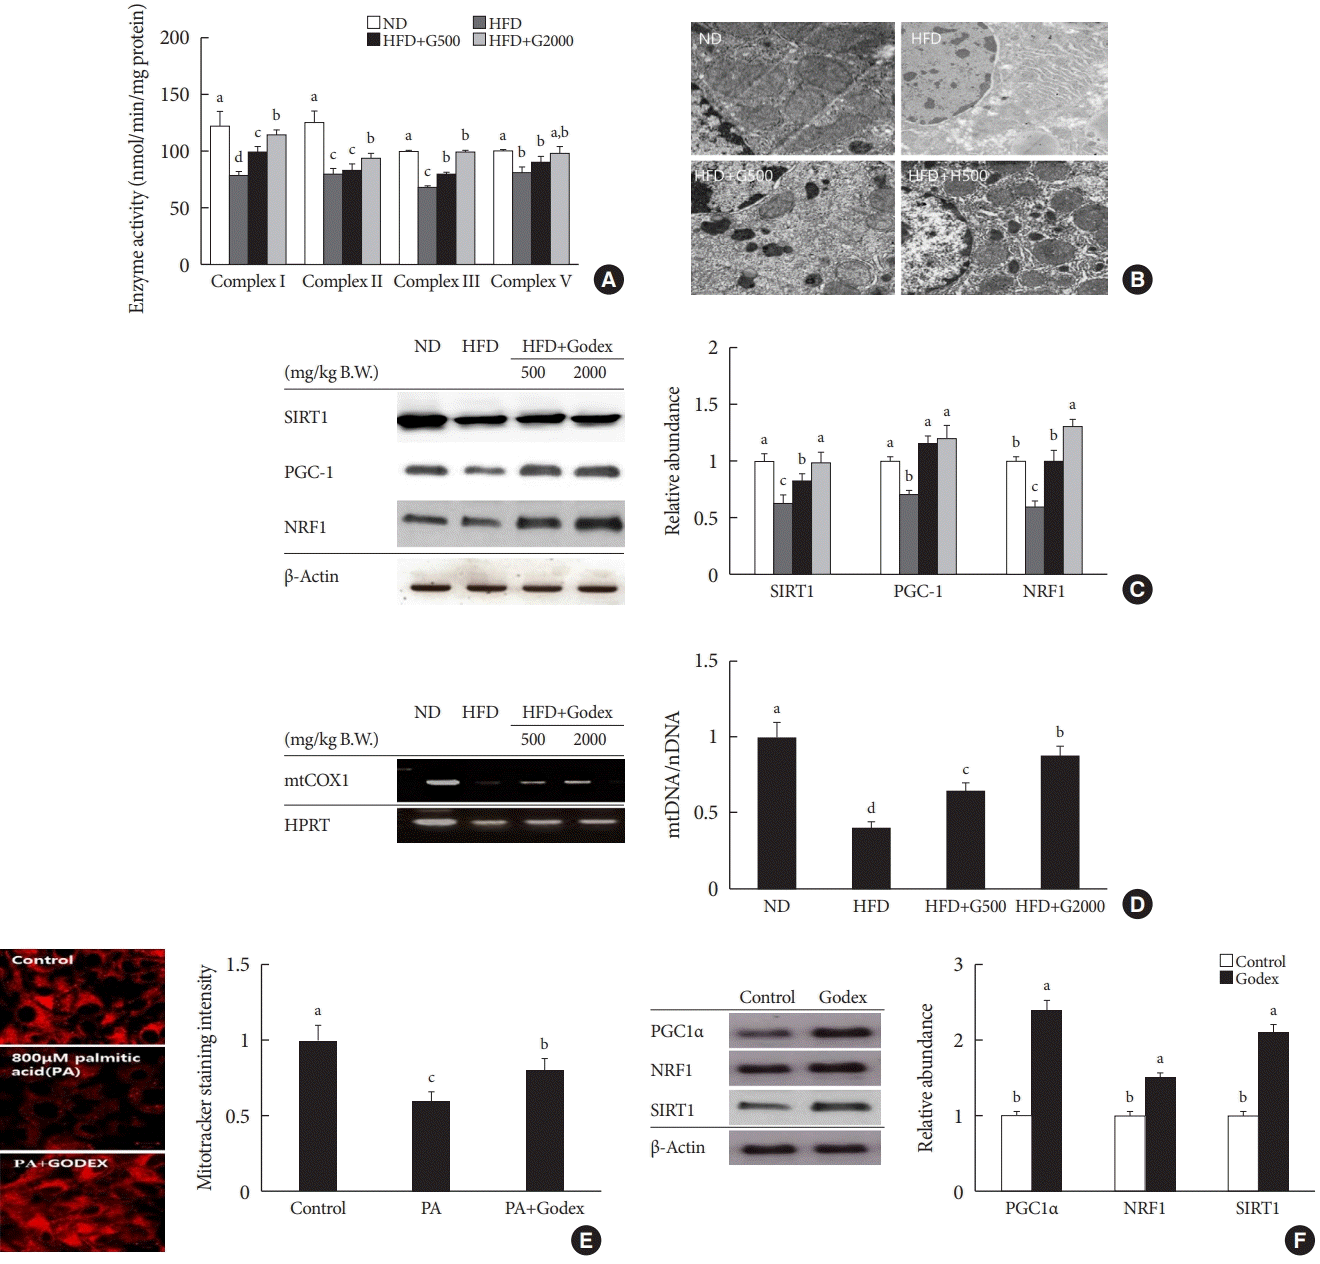 | Fig. 3.Carnitine orotate complex (Godex) improved mitochondrial function. (A) Hepatic oxidative phosphorylation (OXPHOS) enzyme activity, (B) transmission electron microscope images of liver mitochondria (×15,000) (C) proteins expression in mitochondrial metabolism in the liver (D) mitochondrial contents in C57BL/6J mice during 8 weeks of normal-fat diet (ND) or high-fat diet (HFD) feeding. HFD mice were subdivided into vehicle-treated (HFD), Godex 500 mg/kg/body weight (B.W.) (HFD+G500), and Godex 2,000 mg/kg/B.W. (HFD+G2000) groups. Scale bar: 40 μm. To correct for mitochondrial volume, all OXPHOS enzyme activities were normalized by the activity of citrate synthase. Data are presented as mean±standard deviation (n=10). (E) mitoTracker® staining intensity in HepG2 cells after treatment with 800 μM palmitic acid (PA) with 150 μg/mL Godex for 24 hours (×400). (F) proteins expression in mitochondrial metabolism in HepG2 cells after treatment with 150 μg/mL Godex for 24 hours. β-Actin was used as the loading control for normalization. Data are presented as mean±standard deviation (n=10). SIRT1, sirtuin 1; PGC1, peroxisome proliferator-activated receptor-gamma coactivator 1; NRF1, nuclear respiratory factor 1; mtCOX1, mitochondrial cytochrome c oxidase subunit 1; HPRT, hypoxanthine phosphoribosyltransferase. a,b,c,dValues within groups indicate significant difference at P<0.05. |
Godex improved glucose tolerance and insulin sensitivity
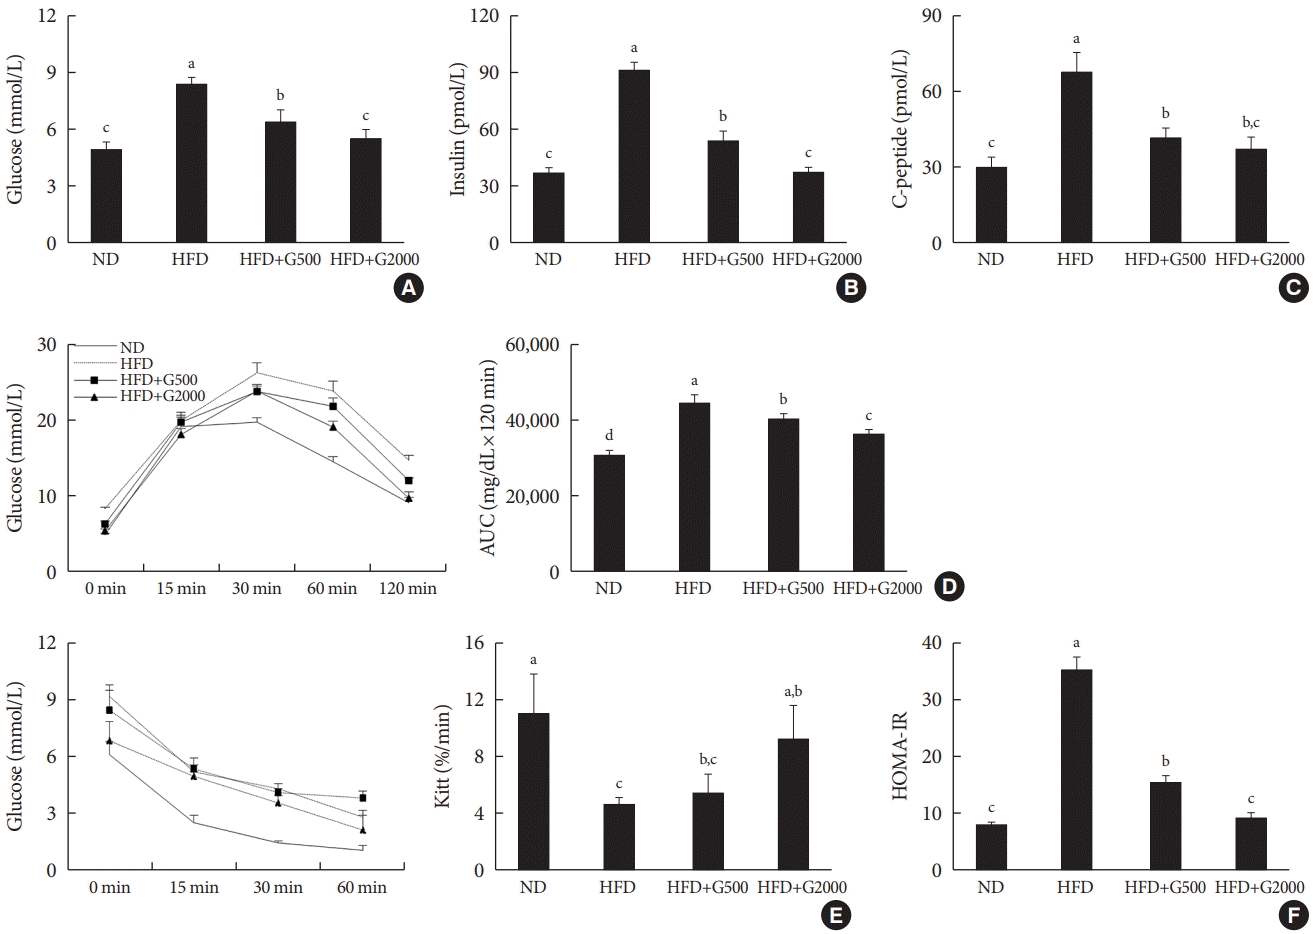 | Fig. 4.Carnitine orotate complex (Godex) improved glucose tolerance and insulin sensitivity. (A) Glucose levels, (B) insulin levels, (C) C-peptide levels, (D) oral glucose tolerance test and area under the curve (AUC), (E) insulin tolerance test (ITT) and Kitt, (F) homeostatic model assessment for insulin resistance (HOMA-IR) in C57BL/6J mice during 8 weeks of normal-fat diet (ND) or high-fat diet (HFD) feeding. HFD mice were subdivided into vehicle-treated (HFD), Godex 500 mg/kg/body weight (B.W.) (HFD+G500), and Godex 2,000 mg/kg/B.W. (HFD+G2000) groups. Data are presented as mean±standard deviation (n=10). a,b,c,dValues within groups indicate significant difference at P<0.05. |
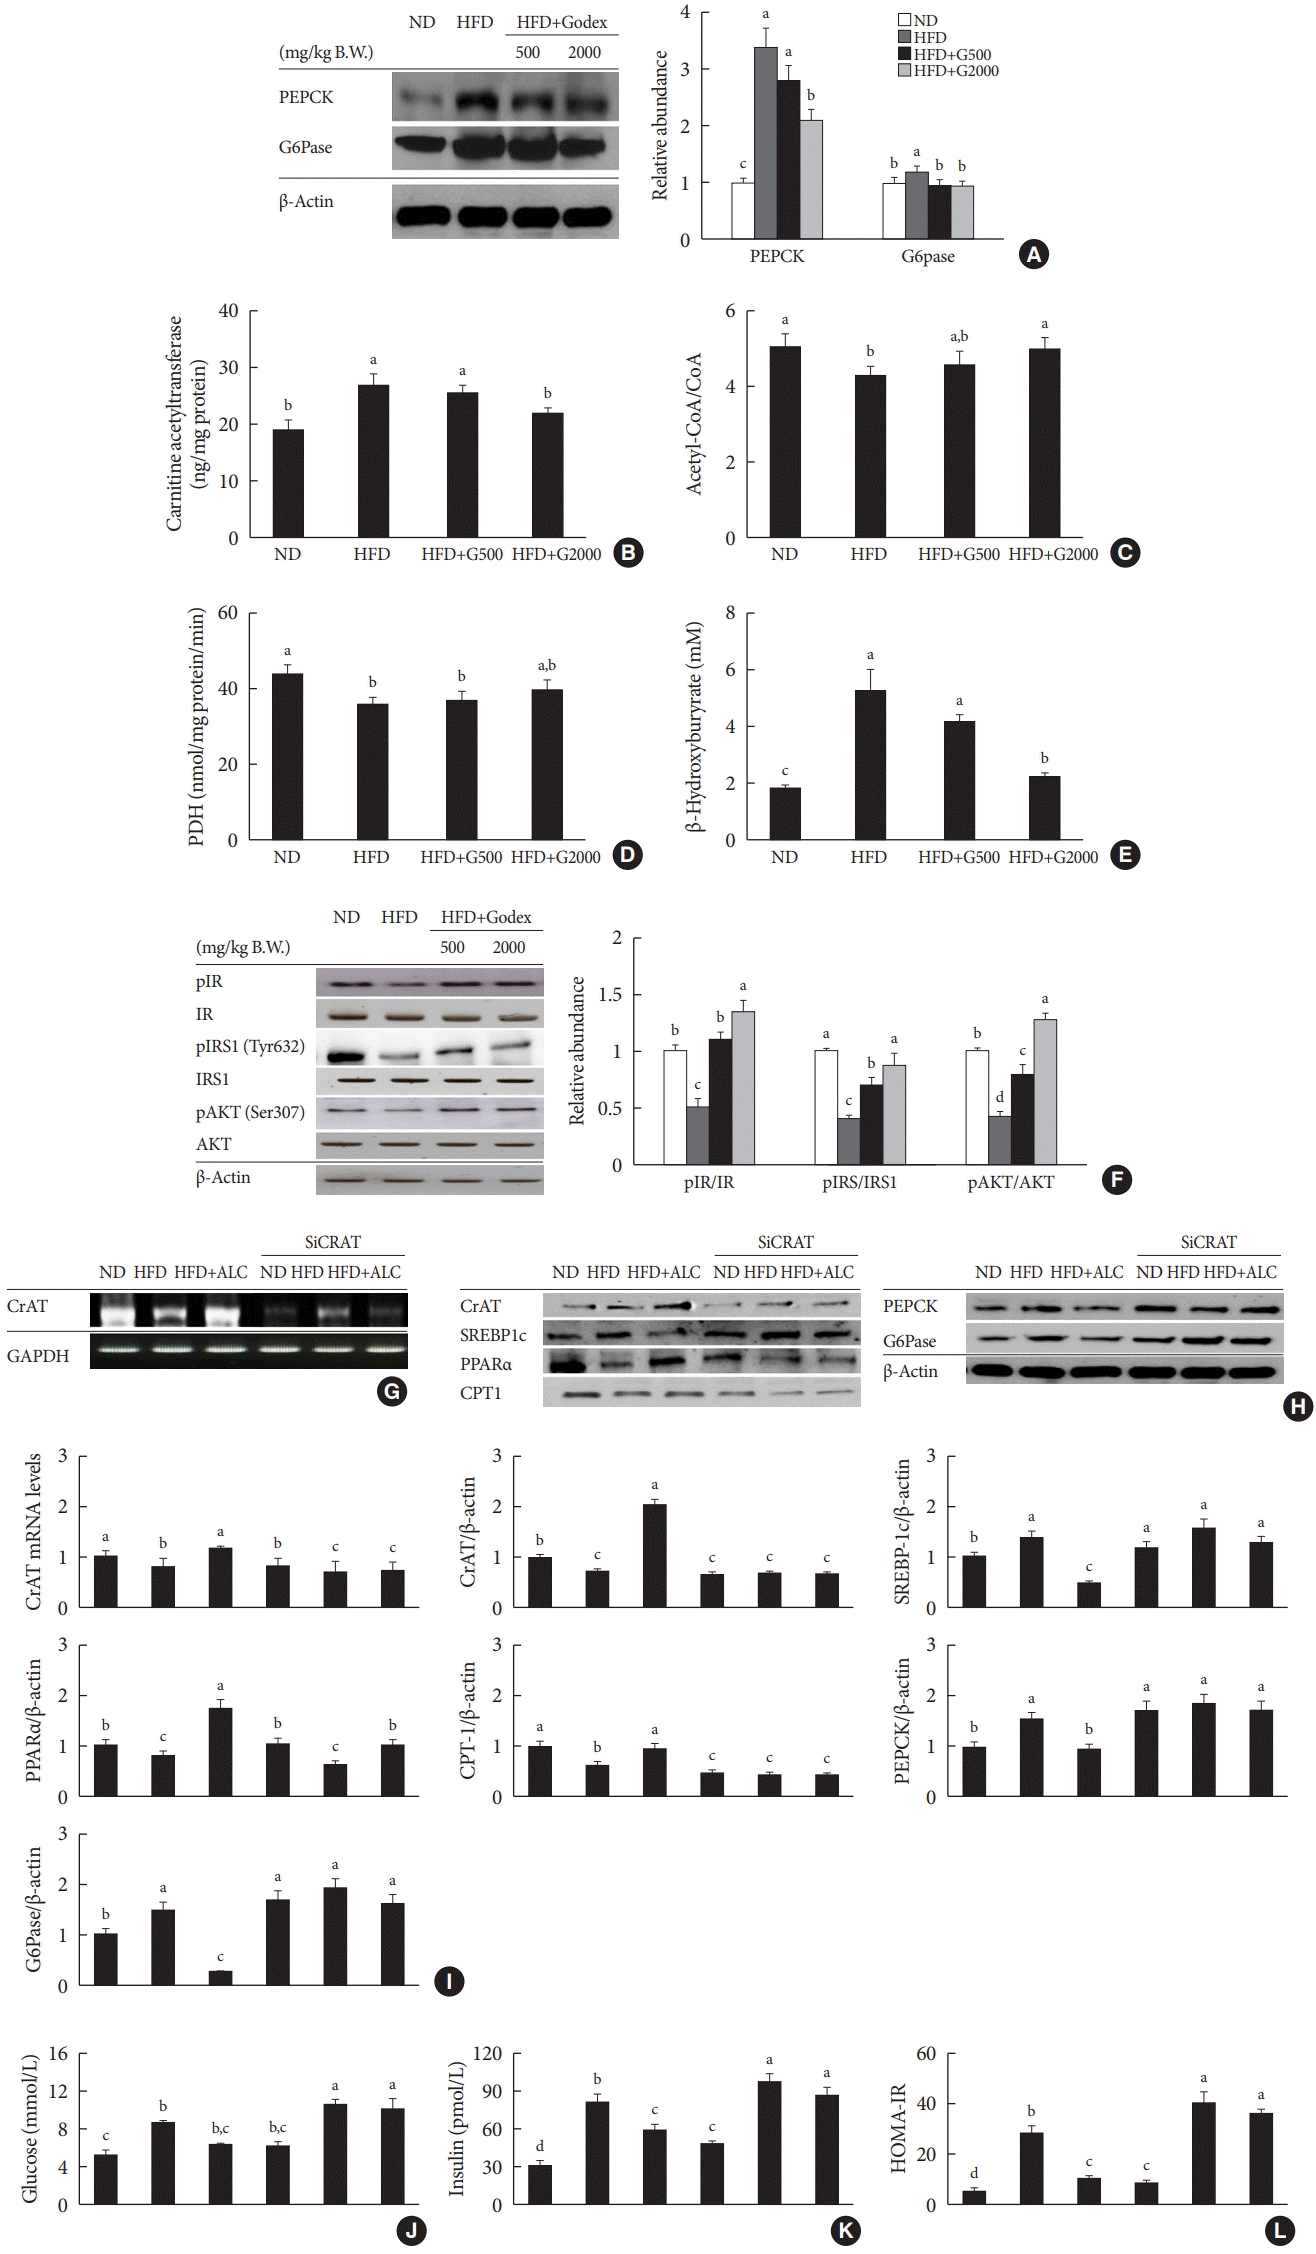 | Fig. 5.Carnitine ameliorated gluconeogenesis, a carnitine acetyltransferase (CrAT)-mediated pathway and insulin signaling in liver. (A) Protein levels of gluconeogenic genes, (B) hepatic mitochondrial CrAT content, (C) hepatic mitochondrial acetyl-coenzyme A(CoA)/CoA ratio, (D) hepatic mitochondrial pyruvate dehydrogenase (PDH) activity, (E) hepatic β-hydroxybutyrate, (F) hepatic insulin signaling in C57BL/6J mice during 8 weeks of normal-fat diet (ND) or high-fat diet (HFD) feeding. HFD mice were subdivided into vehicle-treated (HFD), carnitine orotate complex (Godex) 500 mg/kg/body weight (B.W.) (HFD+G500), and Godex 2,000 mg/kg/B.W. (HFD+G2000) groups. The effectiveness of CrAT siRNA knockdown was determined by (G) reverse transcription polymerase chain reaction (RT-PCR), (H) Western blotting. (I) CrAT mRNA level, and levels of CrAT, sterol regulatory element-binding protein-1 (SREBP-1), peroxisome proliferator-activated receptor alpha (PPARα), carnitine palmitoyltransferase-1 (CPT-1), phosphoenolpyruvate carboxykinase (PEPCK), and glucose 6-phosphatase (G6Pase) were assessed by Western blotting or (J) glucose levels, (K) insulin levels, and (L) homeostatic model assessment for insulin resistance (HOMA-IR). Four-week-old male C57BL/6J mice were fed a ND or HFD with or without carnitine, the main component of the Godex (10 g/kg B.W., intraperitoneal injection) for 8 weeks. Carnitine was used as acetyl-L-carnitine (ALC). Injected into the tail vein with 50 μg siCrAT in 1 mL saline over 2 days and then sacrified. Data are presented as mean±standard deviation (n=10). pIR, phosphorylated insulin receptor; pIRS1, phosphorylated insulin receptor substrate 1; pAKT, phosphorylated AKT; GAPDH, glyceraldehyde 3 phosphate dehydrogenase. a,b,c,dValues within groups indicate significant difference at P<0.05. |
Godex ameliorated β-oxidation and gluconeogenesis through a CrAT-mediated pathway in Hepa-1c1c cells
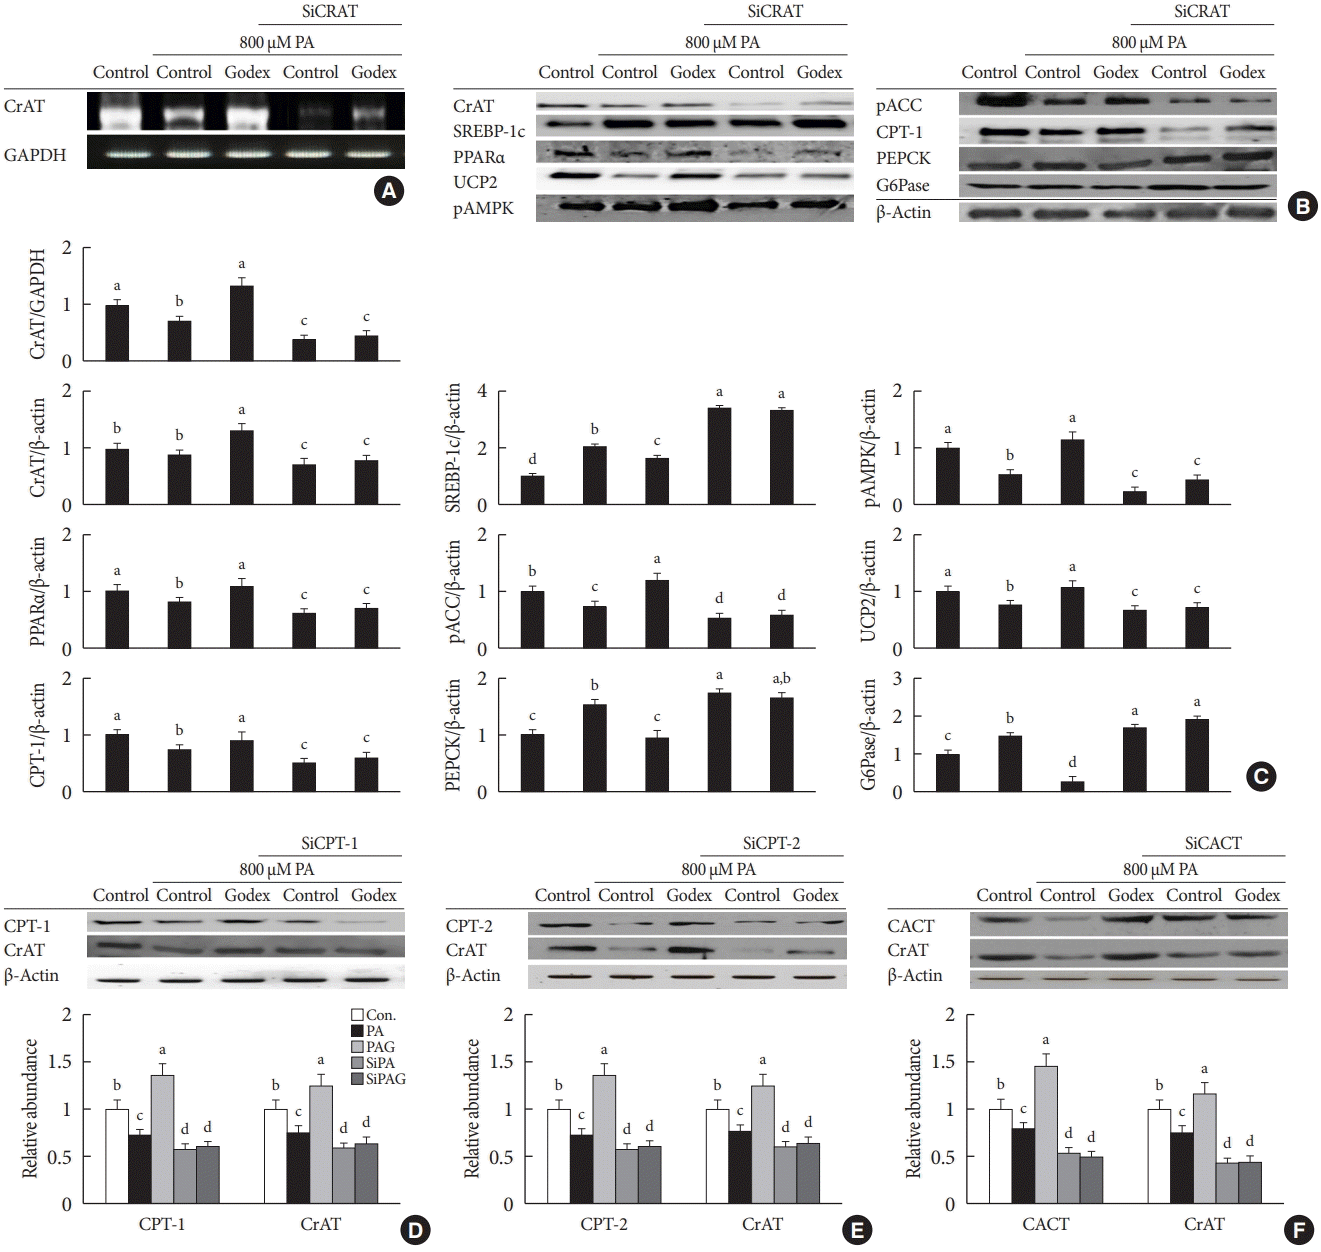 | Fig. 6.Carnitine orotate complex (Godex) ameliorated β-oxidation and gluconeogenesis through a carnitine acetyltransferase (CrAT)-mediated pathway in Hepa-1c1c7 cells. Hepa-1c1c7 cells were transfected with CrAT siRNA and then challenged with 800 μM palmitic acid (PA) with 150 μg/mL Godex. The effectiveness of siRNA knockdown was determined by measuring the expression of CrAT using (A) reverse transcription polymerase chain reaction (RT-PCR), (B) Western blotting, (C) CrAT mRNA level, mitochondrial CrAT protein level, sterol regulatory element-binding protein-1 (SREBP-1), phosphorylated 5’AMP-activated protein kinase (pAMPK), peroxisome proliferator-activated receptor alpha (PPARα), phosphorylated acetyl-CoA carboxylase (pACC), uncoupling protein 2 (UCP2), carnitine palmitoyltransferase-1 (CPT-1), phosphoenolpyruvate carboxykinase (PEPCK), and glucose 6-phosphatase (G6Pase) were assessed by Western blotting. Godex ameliorated CrAT through a carnitine metabolismmediated pathway in Hepa-1c1c cells. Hepa-1c1c7 cells were transfected with CPT1/2 and carnitine acylcarnitine translocase (CACT) siRNA and then challenged with 800 μM PA with 150 μg/mL Godex. The effectiveness of siRNA knockdown was determined by measuring the expression of (D) CPT-1 and CrAT, (E) CPT-2 and CrAT, (F) CACT and CrAT using Western blotting. Data are presented as mean±standard deviation (n=10). GAPDH, glyceraldehyde 3 phosphate dehydrogenase. a,b,c,dValues within groups indicate significant difference at P<0.05. |


 PDF
PDF Citation
 Print
Print


 XML Download