

 PDF
PDF Citation
 Print
Print


INTRODUCTION
The worldwide prevalence of obesity nearly tripled between 1975 and 2016.1 In particular, the prevalence of severe obesity was higher in females than in males.2 According to national data from Korean Statistics, the obesity rate among females aged between 19 and 39 years increased from 12.7% in 2007 to 19.7% in 2018.3
It is well recognized that obesity is associated with metabolic diseases, such as type 2 diabetes, hypertension, dyslipidemia, and cardiovascular disease.4 From an obstetrical perspective, pregnancies in women with obesity have an increased risk of abortion, stillbirth, fetal anomaly, preeclampsia, gestational diabetes mellitus (GDM), preterm delivery, shoulder dystocia, and cesarean section.5 Moreover, significant correlations between maternal obesity and adverse neonatal outcomes, including increased rates of macrosomia and neonatal intensive care unit (NICU) admission, have been identified.
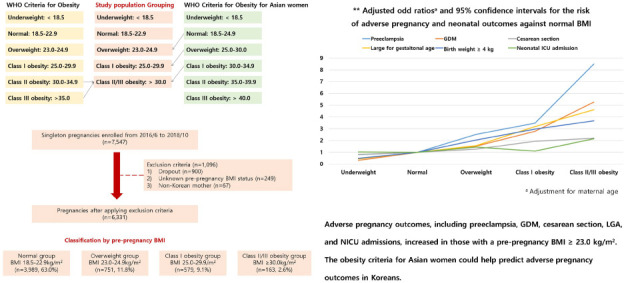
According to the World Health Organization (WHO), obesity was defined and classified as follows6: underweight (< 18.5 kg/m2), normal (18.5–24.9 kg/m2), overweight (25.0–29.9 kg/m2), class I obesity (30–34.9 kg/m2), class II obesity (35–39.9 kg/m2), and class III obesity (≥ 40 kg/m2). However, previous studies have shown that Asians have a higher incidence of obesity-related diseases than non-Asians within the same body mass index (BMI) groups.7 Moreover, it was also found that Asians tend to have a higher body fat mass than non-Asians within the same BMI groups.8 Therefore, the WHO proposed stricter criteria of the classification of obesity for Asians,9 which was adopted by the Korean Obesity Association and Korean Diabetes Association in 20181011: underweight (< 18.5 kg/m2), normal (18.5–22.9 kg/m2), overweight (23.0–24.9 kg/m2), class I obesity (25–29.9 kg/m2), class II obesity (30–34.9 kg/m2), and class III obesity (≥ 35 kg/m2). The WHO also stated that the definition of obesity in Asians could vary depending on the outcomes of interest.12
Some Korean studies on the association between maternal obesity and adverse pregnancy outcomes applied these stricter obesity criteria.1314 However, most studies have been conducted in a single center with a relatively small population or limited evaluation of the comprehensive analysis of adverse pregnancy outcomes. Therefore, a systematic analysis of the adverse pregnancy outcomes according to the modified obesity criteria stated above using a large Korean population of pregnant women is needed before applying them in routine obstetric practice or being endorsed by the Korean Society of Maternal-Fetal Medicine (KSMFM). Here, we aimed to check the pregnancy and neonatal outcomes according to the modified obesity criteria (overweight defined as BMI ≥ 23 kg/m2 and class I obesity as ≥ 25 kg/m2) using the Korean Perinatal Diagnosis Study (KPDS) cohort database, which was a multicenter study supported by the KSMFM.
Go to : 
METHODS
Study population and variables
We analyzed the data of 7,547 women with singleton pregnancies enrolled before 24 weeks of gestation from June 2016 to October 2018 at 12 different healthcare institutions.15 Patients with no pre-pregnancy BMI (n = 249), lost to follow-up for delivery outcomes (n = 900), and non-Koreans (n = 67) were excluded. Subjects were allocated into five groups based on their pre-pregnancy BMI: underweight (< 18.5 kg/m2), normal (18.5–22.9 kg/m2), overweight (23.0–24.9 kg/m2), class I obesity (25.0–29.9 kg/m2), and class II/III obesity (≥ 30.0 kg/m2). Their maternal baseline characteristics and pregnancy and neonatal outcomes were compared as detailed below.
Maternal characteristics included the pre-pregnancy weight, height, age, parity, type of conception (spontaneous or artificial reproductive technology), obstetric history (abortion, recurrent abortion, stillbirth, and preterm delivery), and underlying medical conditions (diabetes and hypertension). Recurrent abortion was defined as three or more spontaneous abortions. The pregnancy outcomes included the incidence of preeclampsia, GDM, preterm labor, preterm premature rupture of membrane (PPROM), placental abruption, abortion, stillbirth, live birth, gestational age at delivery, and cesarean section. Preterm labor defined as regular contraction with cervical change before 37 weeks, and PPROM defined as leakage of amniotic fluid confirmed by speculum vaginal examination or nitrazine test before 37 weeks. The causes of preterm delivery were divided into spontaneous and indicated; spontaneous preterm delivery caused by preterm labor or PPROM, and the incidence of preterm delivery caused by maternal-fetal indications such as preeclampsia or fetal growth restriction. We also analyzed the indications for cesarean section by classifying as followings: cesarean section due to previous cesarean section, abnormal fetal presentation, progression failure, and maternal-fetal indications. The neonatal outcomes included birth weight, small for gestational age (SGA), large for gestational age (LGA), birth weight ≥ 4 kg, sex, major congenital anomaly, Apgar scores, NICU admission, and neonatal death. SGA and LGA were defined as newborns whose birth weight was lower than the 10th percentile and higher than the 90th percentile for gestational age using the Fenton growth chart reference of a singleton pregnancy, respectively, as previously indicated.16
Statistical analysis
We analyzed the data using SPSS (version 25.0; SPSS Inc., Chicago, IL, USA). The Jonckheere-Terpstra test for continuous variables and linear-by-linear association for categorical variables were used for the trend analysis. We performed a trend analysis including all BMI groups and repeated the analysis after excluding the underweight group since the underweight group may have distinct features in terms of the pregnancy and neonatal outcomes. A multiple logistic regression analysis was used to adjust for the effect of maternal age on pregnancy and neonatal outcomes. The results were considered statistically significant when the P value was < 0.05.
Ethics statement
The Institutional Review Board (IRB) of each participating institution approved the original study of the KPDS, as previously stated.15 We followed the ethical standards for human experimentation established in the Declaration of Helsinki. For this secondary analysis, we also obtained approval from the IRB of our institution (IRB file No. 2020-02-167), and the need to obtain informed consent was waived because the subject had agreed to provide pertinent information for additional analysis.
Go to :
RESULTS
This study finally included 6,331 women, with a mean pre-pregnancy BMI of 21.4 kg/m2 (standard deviation, 3.2 kg/m2) overall. Among the 6,331 women, 849 (13.4%), 3,989 (63.0%), 751 (11.8%), 579 (9.1%), and 163 (2.6%) women were classified as being underweight, normal weight, and overweight and having class I obesity and class II/III obesity, respectively.
Table 1 summarizes the maternal baseline characteristics according to the BMI groups. Maternal age, the proportion of multipara, and pregnancy by artificial reproductive technology increased in those with a higher BMI (P < 0.001, linear-by-linear association). Past obstetric history, including abortion, stillbirth, and preterm delivery, was more common in those with a higher BMI (P ≤ 0.001, linear-by-linear association). Recurrent abortion history was also more common in those with a higher BMI (P = 0.009). The proportion of pre-existing diabetes mellitus and hypertension also increased in those with a higher BMI (P < 0.001, linear-by-linear association).
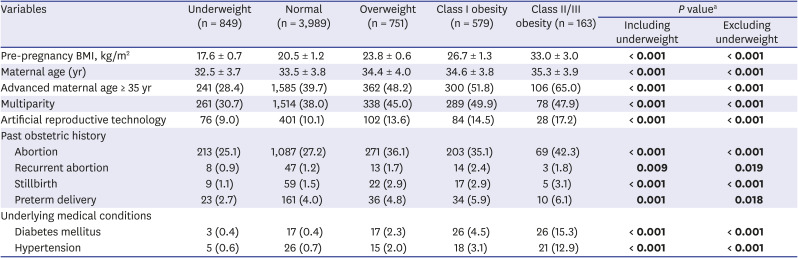
Table 1
Maternal baseline characteristics according to the body mass index groups
Data are presented as the mean ± standard deviation or number (%). Significant P values are marked in bold.
aTrend analysis according to the degree of maternal obesity. Significance was set at a P value of < 0.05.
![]()
Table 2 summarizes the pregnancy and neonatal outcomes according to the BMI groups. The incidence of preeclampsia, GDM, preterm delivery before 37 weeks of gestation, preterm delivery caused by maternal-fetal indications, and rate of cesarean section were significantly increased in those with a higher BMI (P ≤ 0.001, linear-by-linear association). Among the indications for cesarean section, a higher rate of previous cesarean sections and failure to progress was associated with the higher BMI groups. The incidence of LGA, birth weight ≥ 4 kg, and NICU admission were also significantly increased in those with a higher BMI (P ≤ 0.001, linear-by-linear association). Earlier gestational age at delivery but heavier neonatal birth weight was associated with a higher BMI (P < 0.001, linear-by-linear association). Most outcomes showed similar statistical significance, including and excluding the underweight group. However, the incidence of SGA decreased only in the analysis that included, not excluded, the underweight group (P < 0.001 vs. P = 0.074). Although rare, neonatal death was also increased in the higher BMI groups, with 0.0%, 0.1%, 0.0%, 0.5%, and 0.6% in the underweight, normal, overweight, class I obesity, and class II/III obesity groups, respectively (P = 0.011, linear-by-linear association).
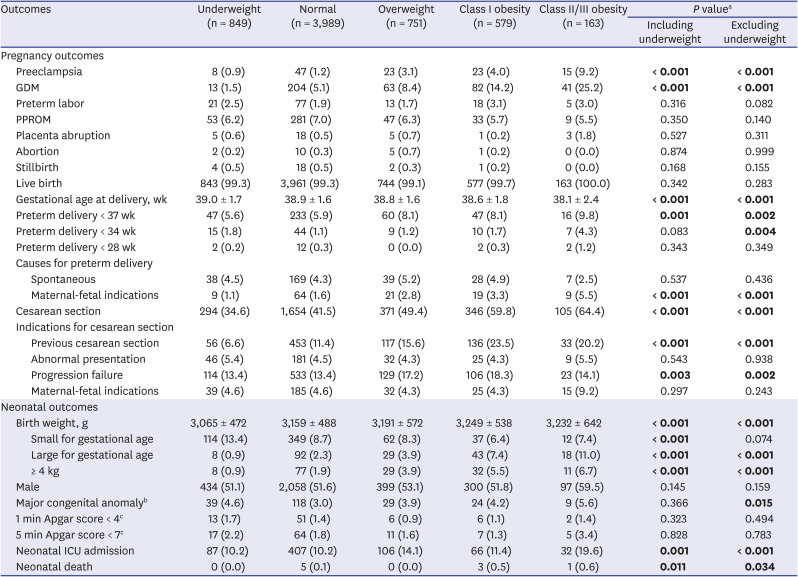
Table 2
Pregnancy and neonatal outcomes according to the body mass index groups
Data are presented as the mean ± standard deviation or number (%). Significant P values are marked in bold.
GDM = gestational diabetes mellitus, PPROM = preterm premature rupture of membrane, ICU = intensive care unit.
aTrend analysis according to the degree of maternal obesity. Significance is set at a P value of < 0.05; bBecause the information of 67 cases was not collected, the number of cases with results is 6,299 (underweight, n = 845; normal, n = 3,971; overweight, n = 748; class I obesity, n = 574; class II/III obesity, n = 161 as denominators, respectively); cBecause the information of 576 cases was not collected, the number of cases with results is 5,755 (underweight, n = 787; normal, n = 3,621; overweight, n = 674; class I obesity, n = 525; class II/III obesity, n = 148 as denominators, respectively).
![]()
Since maternal age is an important factor affecting pregnancy and neonatal outcomes, we performed a multiple logistic regression analysis with adjustment for maternal age. We used the normal-weight group as a reference. As shown in Table 3, a higher BMI was significantly associated with a higher rate of preeclampsia, GDM, cesarean section, LGA, birth weight ≥ 4 kg, and NICU admission. In detail, women in the overweight group (BMI, 23.0–24.9 kg/m2) had a significantly higher rate of preeclampsia, GDM, preterm delivery < 37 weeks (especially by maternal-fetal indications), cesarean section, LGA, birth weight ≥ 4 kg, and NICU admission compared to the normal BMI group (adjusted odds ratio [aOR] and 95% confidence interval [CI], 2.523 [1.518–4.195] for preeclampsia; 1.523 [1.131–2.052] for GDM; 1.355 [1.007–1.823] for preterm delivery < 37 weeks; 1.688 [1.023–2.786] for preterm delivery caused by maternal-fetal indications; 1.276 [1.088–1.496] for cesarean section; 1.571 [1.024–2.410] for LGA; 2.041 [1.322–3.151] for birth weight ≥ 4 kg; 1.446 [1.150–1.820] for NICU admission). Of note, pregnancies in the underweight group had significantly lower rates of GDM (aOR and 95% CI, 0.323 [0.183–0.569]), cesarean section (aOR and 95% CI, 0.820 [0.700–0.960]), and LGA (aOR and 95% CI, 0.441 [0.213–0.914]), but a higher rate of SGA (aOR and 95% CI, 1.618 [1.291–2.027]).
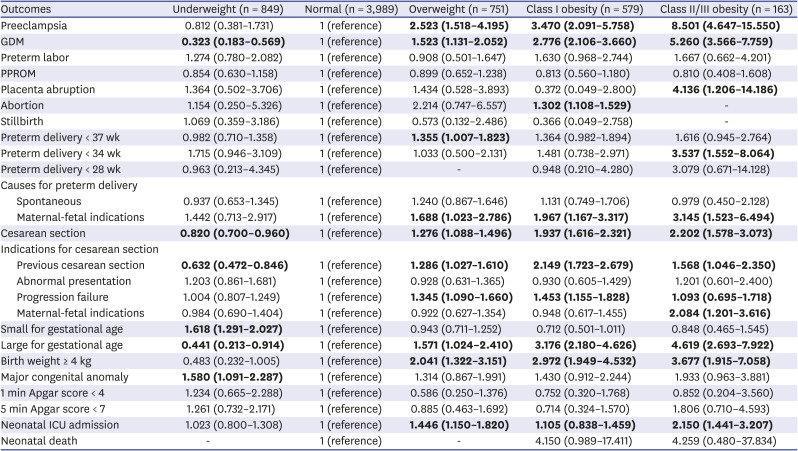
Table 3
aORsa and 95% CIs for the risk of adverse pregnancy and neonatal outcomes against normal body mass index
Data are presented as aORs (95% CI). Significant aORs are indicated in bold.
aOR = adjusted odds ratio, CI = confidence interval, GDM = gestational diabetes mellitus, PPROM = preterm premature rupture of membrane, ICU = intensive care unit.
aAdjustment for maternal age.
![]()
Fig. 1 shows the aOR for adverse pregnancy and neonatal outcomes according to an increase in maternal obesity, showing a stepwise increase in the higher BMI groups starting from the overweight group compared to the normal BMI group.
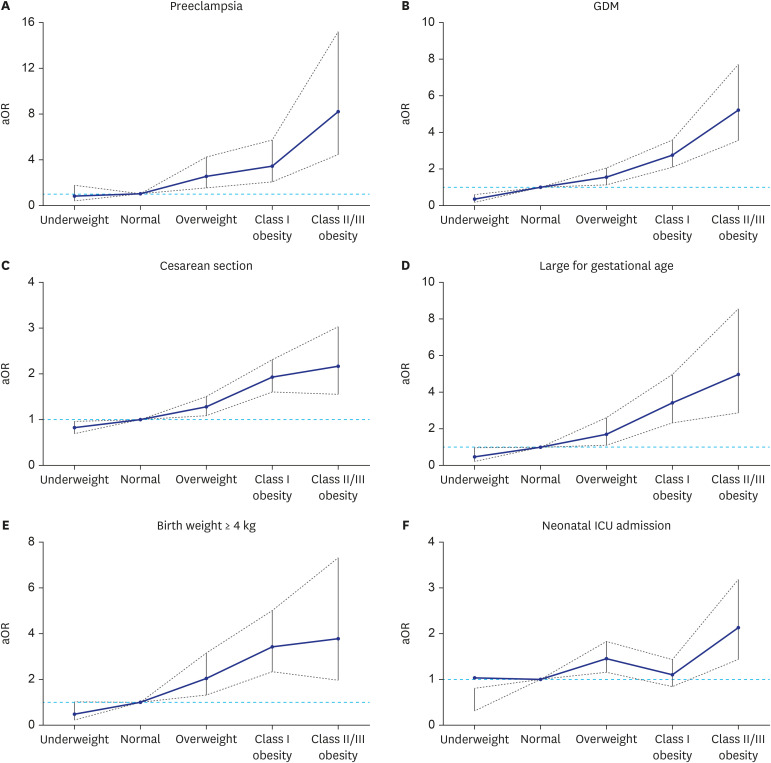 | Fig. 1Adjusted odds ratios and 95% confidence intervals for each of the adverse pregnancy and neonatal outcomes according to the increase of maternal obesity: (A) Preeclampsia, (B) GDM, (C) Cesarean section, (D) large for gestational age, (E) birth weight of 4 kg or more, and (F) neonatal ICU admission.aOR = adjusted odds ratio, GDM = gestational diabetes mellitus, ICU = intensive care unit.
|
Go to :
DISCUSSION
In this study using Korean multicenter data, we demonstrated that the prevalence of adverse pregnancy outcomes started to increase even in women with a pre-pregnancy BMI between 23.0 and 24.9 kg/m2. For example, the risk of preeclampsia and GDM in this group was 2.5 and 1.5 times higher, respectively, than in the normal BMI group. Moreover, the rate of preterm delivery caused by maternal-fetal indications, cesarean section, incidence of LGA, birth weight ≥ 4 kg, and NICU admission rate were 1.7, 1.3, 1.6, 2.0, and 1.4 times higher, respectively. Thus, our data collectively show that the Asian obesity criteria proposed by the WHO are clinically useful for determining the risk of adverse pregnancy outcomes in Korean pregnant women.
Previous studies have shown that obesity-associated morbidities occur more frequently in Asian populations with lower BMIs than in non-Asian populations.12 Several mechanisms have been proposed to explain the increased susceptibility to metabolic diseases related to obesity in the Asian population.17 One proposed mechanism is the difference in the distribution of body fat according to ethnicity. It was noted that the Asian population had a larger body fat mass and smaller skeletal muscle mass than the non-Asian population with the same BMI.17 According to a meta-analysis, for the same level of body fat, sex, and age, the Chinese, Indonesians, and Thais had 1.9 kg/m2, 3.2 kg/m2, and 2.9 kg/m2 lower BMIs than Caucasians, respectively.8 Indeed, central obesity was more frequently observed in Asian populations than in non-Asian populations, and this central obesity is known to be a clinically important index which is significantly associated with the obesity-related diseases.18 The other proposed mechanism is an ethnic difference in ectopic fat mass, which usually accumulates in the liver and pancreas.17 This fat accumulation is more frequently observed in Asian populations than in non-Asian populations, and ectopic adipose cells cause changes in glucose metabolism, resulting in insulin resistance.18 Asians are genetically more prone to insulin resistance because of various genetic mutations associated with the insulin pathway.17
For the reasons mentioned above, even at a lower BMI, a higher risk for obesity-related morbidities was reported in the Asian population than in the non-Asian population, suggesting that the BMI cut-off value should be lower in Asian populations.9 The American Diabetes Association in 2014 decided to lower the BMI threshold for the screening of diabetes among Asians from 25 kg/m2 to 23 kg/m2.19 Accordingly, the optimal BMI cut-off value for the screening of obesity-related cardiovascular disease was suggested as 22.1 kg/m2 for Taiwanese women20 and 22.5 kg/m2 for Japanese women, respectively.21 In relation to pregnancy outcomes, a recent study using the Japanese Society of Obstetrics and Gynecology database showed the clinical benefit of defining a BMI above 23.0 kg/m2 as overweight in the assessment of gestational weight gain.22 However, this lower BMI threshold is not being applied consistently for the risk assessment of pregnancy outcomes in all Asian women.23 Our study has shown that this lower BMI cut-off value for Asians is useful in assessing pregnancy complications in Korean women using a large study population.
Our results show a similar risk ratio for adverse pregnancy outcomes in previous studies assessing Korean pregnant women. For example, according to a hospital-based retrospective study including 3,554 Korean pregnant women, the risk for preeclampsia and GDM was increased in overweight (defined as BMI > 23.0 kg/m2) women after adjustment for confounders (aOR and 95% CI, 2.4 [1.1–5.7] for preeclampsia; 2.0 [1.3-3.0] for GDM).13 Of note, a recent study in 201914 using data from the Korean National Health Insurance Service (783,406 deliveries) based on insurance claim codes, further divided maternal BMI into seven groups (BMI < 17.5 kg/m2, 17.5–19.9 kg/m2, 20.0–22.4 kg/m2, 22.5–24.9 kg/m2, 25.0–27.4 kg/m2, 27.5–29.9 kg/m2, 30.0–32.4 kg/m2, ≥ 32.5 kg/m2) and confirmed a linear association between the degree of obesity and obstetric complications including preeclampsia and cesarean section. Our study used the KPDS cohort database, a multicenter study that included 12 different healthcare institutions in Korea. Therefore, all clinical variables were prospectively gathered with a subsequent review of medical records, providing accurate and detailed comprehensive information about the pregnancy and neonatal outcomes.
It is noteworthy that the underweight group (BMI < 18.5 kg/m2) in our study accounted for 13.3%, a higher proportion compared to studies on non-Asian populations. Indeed, the proportion of the underweight group was similar to the sum of the obese group, 9.1% plus 2.6% for class I obesity (25.0–29.9 kg/m2), and class II/III obesity (≥ 30.0 kg/m2), respectively. We found that women in the underweight group had a significantly reduced risk for GDM, cesarean section, and LGA, while an increased risk for SGA (1.6 times), which is similar to the results of previous studies. A recent systemic review including 60 studies also showed that underweight women had a higher risk of delivering SGA infants (OR and 95% CI, 1.67 [1.49–1.87]).24 Meanwhile, it is well recognized that SGA infants are at higher risk for long-term health problems, including poor postnatal growth, metabolic syndrome, cardiovascular disease, and neurodevelopmental impairment.25 Therefore, considering the relatively high proportion of the underweight group in the Asian population and the impact of SGA on the future health of offspring, a careful antenatal strategy for the prevention of SGA in this underweight group should not be overlooked.
In a conclusion, the obesity criteria for the Asian population, which are stricter than those for non-Asian populations, were found to be suitable for predicting adverse pregnancy outcomes in Korean women. We confirmed that women with a pre-pregnancy BMI of ≥ 23.0 kg/m2 had significantly increased adverse pregnancy and neonatal outcomes, including preeclampsia, GDM, preterm delivery caused by maternal-fetal indications, cesarean section, LGA, and NICU admission. We believe that our findings are also useful to discuss with women during pre-conception counseling.
Go to :
 XML Download