Journal List > Korean Circ J > v.51(11) > 1147986

Cho, Lee, and Kim: Sex- and Age-Specific Trends in Cardiovascular Health in Korea, 2007–2018

Author's summary

To achieve demographic-specific cardiovascular disease prevention, we illustrated sex- and age-specific 12-year trends in lifestyle and clinical risk factors among Korean adults. Briefly, never smoking increased largely in young men. Ideal physical activity halved. Ideal body mass index decreased more apparently in young and elderly men. Ideal cholesterol decreased concerningly in young adults and more profoundly in men. Ideal blood pressure declined more evidently in men. Ideal glucose decreased comparatively greater and earlier in men. As trajectories of risk factors are largely dependent on genetic and socioenvironmental factors, our results support the need for tailored management across various demographics.

Abstract

Background and Objectives

We illustrated sex- and age-specific temporal trends in cardiovascular health among Korean adults.

Methods

From the Korean National Health and Nutrition Examination Survey 2007–2018, we included 61,408 participants aged 20 years or older. The ideal levels of 6 components of cardiovascular health metrics were defined as never-smoking, ≥75 min/week of vigorous or ≥150 min/week of moderate-to-vigorous physical activity, body mass index (BMI) <23 kg/m2, total cholesterol <200 mg/dL, blood pressure (BP) <120/80 mmHg, and fasting glucose <100 mg/dL. Temporal trends in the number of ideal cardiovascular health components and distribution of each component were assessed by sex and age.

Results

The average number of ideal cardiovascular health components decreased from 3.37 in 2007–2009 to 2.86 in 2016–2018. Never smoking increased from 56.0% to 59.2%, largely contributed by young men. Ideal physical activity halved (41.4–21.3%); such decline was more pronounced in women and with older age. Ideal BMI decreased from 44.3% to 42.2%, more apparently in young and elderly men. In contrast, ideal BMI increased in middle-aged and elderly women. Ideal cholesterol decreased from 65.5% to 50.3%, profoundly in young adults and relatively greater in men. Ideal BP declined from 55.1% to 46.9%, more evidently in men. However, ideal BP discernibly increased in middle-aged women. Ideal glucose decreased from 74.6% to 66.0%, comparatively greater and earlier in men.

Conclusions

The proportion of Korean adults with ideal cardiovascular health decreased between 2007 and 2018, but the course of responsible factors differed across sex and age groups.

INTRODUCTION

Despite recent downward trend in high-income countries, cardiovascular disease (CVD) remains the leading cause of morbidity and mortality worldwide.1) The same holds true in Korea, where age-standardized mortality of circulatory system diseases has markedly decreased,2) owing to population-wide initiatives encouraging favorable lifestyle3)4)5) and advances in diagnostics, pharmacotherapy, and research.6) However, recent nationwide trends on obesity, hypertension, diabetes mellitus, and dyslipidemia have indicated otherwise.7)8)9)10) With population ageing, early and sustained prevention efforts are essential to avert initial development and to deter progression of CVD risk factors. To address the necessity of primordial prevention, the American Heart Association has devised a cardiovascular health (CVH) metrics called the Life's Simple 7, which consists of tobacco use, physical activity, diet, body mass index (BMI), blood pressure (BP), cholesterol, and glucose.11) Depending on the risk factor levels and medication treatment status, these metrics are evaluated as ideal, intermediate, or poor.11)
Previous reports have shown positively graded risks for total and cardiovascular mortality by the number of adverse lifestyle factors, including cigarette smoking, alcohol use, physical activity, and sleep duration.12) The scientific societies have been periodically publishing the overview of burden, awareness, treatment, control, and healthcare utilization rates for cardiometabolic diseases.7)8)9)10) Nonetheless, sex- and age-specific trends in comprehensive CVD risk factors have not yet been reported in Korean population. As lifetime trajectories of each CVH components are largely dependent on demographic, genetic, and modifiable factors,13) tailored prevention efforts may better identify vulnerable subgroups in need of more stringent management.
In this context, using a nationwide health surveillance data, we illustrated sex- and age-specific trends in the number of ideal CVH components and distribution of each component between 2007 and 2018 among Korean adults.

METHODS

Ethical statement

Korea National Health and Nutrition Examination Survey (KNHANES) IV–VII are administered by the Korea Center for Disease Control and Prevention (KCDC) and approved by the KCDC Institutional Review Board (2007-02-CON-04-P, 2008-04EXP-01-C, 2009-01CON-03-2C, 2010-02CON-21-C, 2011-02CON-06-C, 2012-01EXP-01-2C, 2013-07CON-03-4C, 2013-12EXP-03-5C, 2015-01-02-6C, 2018-01-03-P-A). Each participant provided a signed written consent before participating in the study.

Data source and study population

The current study was based on the KNHANES conducted between 2007 and 2018. The KNHANES is an ongoing surveillance system on noninstitutionalized Korean population. To produce unbiased cross-sectional estimates, it uses complex, multi-stage probability sample design.14) The exact details of the KNHANES are elaborated elsewhere.14) We identified 74,581 adults aged 20 years or older. After excluding participants with incomplete measurements on CVH metrics (n=13,173), a final analytical sample of 61,408 participants resulted.

Assessment of cardiovascular health components

Demographics, disease history, health behaviors, and healthcare utilization were collected via face-to-face interview using standardized questionnaires. In details, the average number, frequency, and duration of lifetime cigarette use were recorded. Then, participants reported types/intensity, frequency, and duration of weekly physical activity. For a subset of participants under age 65 years, dietary intake was assessed using the Korean version of the Food Frequency Questionnaire between 2012 and 2016.14)
Anthropometric, blood, and urinal measurements were obtained from on-site health examination using calibrated equipment and with strict adherence to protocols. Body weight and height were measured to the nearest 0.1 kg and 0.1 cm; then, BMI was calculated as the ratio of weight in kilograms to height in squared meters. BP was measured using a standard mercury sphygmomanometer (Baumanometer Wall Unit 33(0850); Baum Co., Inc., Copiague, NY, USA) after seated rest. BP was measured on three consecutive occasions at 1-minute intervals; the mean of the second and the third measurements was adopted for the data analysis. Eight-hour fasting serum total cholesterol and glucose levels were enzymatically assessed via Hitachi Automatic Analyzer 7600 (Hitachi, Tokyo, Japan) in 2007 and COBAS 8000 C702 (Roche Diagnostics System, Rotkreuz, Switzerland) onwards.
Table 1 illustrates detailed definition and assessment of the CVH components. Briefly, the ideal level of each CVH component included 1) never-smoking; 2) ≥75 minutes of vigorous activity or ≥150 minutes of moderate-to-vigorous activity per week; 3) BMI <23 kg/m2; 4) untreated systolic BP <120 mmHg and diastolic BP <80 mmHg; 5) untreated total cholesterol <200 mg/dL; and 6) untreated fasting glucose <100 mg/dL. Naturally, the number of ideal CVH components ranged from 0 to 6. Since only a limited number of participants underwent dietary assessment in select years, the present CVH metrics did not include nutrition. Instead, we separately assessed dietary trends based on the Korean Healthy Eating Index.15)
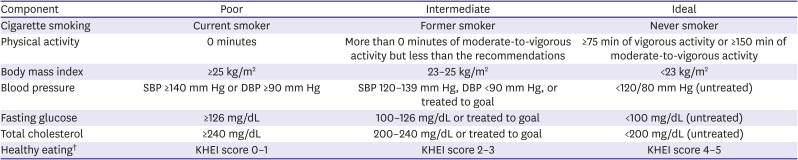
Table 1

Definition and categorization of CVH components

kcj-51-922-i001
Component Poor Intermediate Ideal
Cigarette smoking Current smoker Former smoker Never smoker
Physical activity 0 minutes More than 0 minutes of moderate-to-vigorous activity but less than the recommendations ≥75 min of vigorous activity or ≥150 min of moderate-to-vigorous activity
Body mass index ≥25 kg/m2 23–25 kg/m2 <23 kg/m2
Blood pressure SBP ≥140 mm Hg or DBP ≥90 mm Hg SBP 120–139 mm Hg, DBP <90 mm Hg, or treated to goal <120/80 mm Hg (untreated)
Fasting glucose ≥126 mg/dL 100–126 mg/dL or treated to goal <100 mg/dL (untreated)
Total cholesterol ≥240 mg/dL 200–240 mg/dL or treated to goal <200 mg/dL (untreated)
Healthy eating KHEI score 0–1 KHEI score 2–3 KHEI score 4–5
CVH = cardiovascular health; DBP = diastolic blood pressure; KHEI = Korean Healthy Eating Index; SBP = systolic blood pressure.
*Scoring of the KHEI: Fruits and vegetables ≥450 g/day; fish ≥198 g/week; fiber-rich whole grains ≥85 g/day; sodium <1,500 mg/day; sugar-sweetened beverages ≤1 liter/week; The CVH metrics did not include dietary components due to limited data collection.

Statistical analyses

General characteristics of participants were reported as weighted frequency and 95% confidence interval or weighted mean and standard deviation. We compared baseline characteristics across the number of ideal CVH components. Then, we assessed the 1) number of ideal CVH components by each KNHANES phase and 2) distribution of ideal, intermediate, or poor level for each CVH component of the metrics. Temporal trends were assessed among all adults and separately for each sex by age (20–39; 40–49; 50–59; 60–69; and 70 years or older) group. Linear trends across calendar periods were evaluated using linear regression analyses. Analyses were performed using SAS version 9.4 (SAS Institute Inc., Cary, NC, USA).

RESULTS

Baseline characteristics

Of the 61,408 participants, 1,892 (3.1%) had 0 ideal CVH components, followed by 7,734 (12.6%) with 1, 12,989 (21.2%) with 2, 14,298 with 3 (23.3%), 12,761 (20.8%) with 4, 9,476 (15.4%) with 5, and 2,258 (3.7%) with 6 ideal components, respectively (Table 2). Participants with greater number of ideal CVH components were substantially younger and of female sex. Additionally, they were more likely to undergo higher education and less likely to consume alcohol.
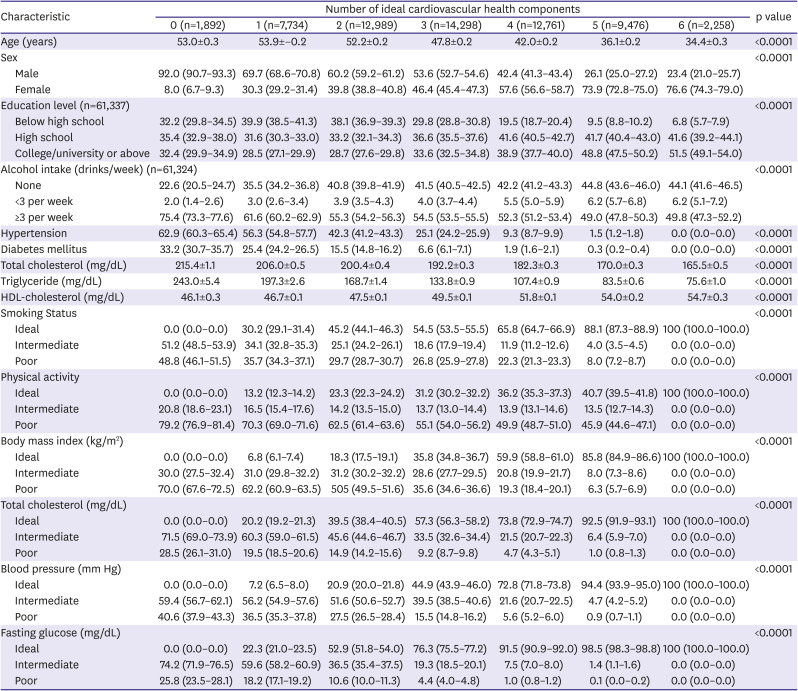
Table 2

Baseline characteristics according to the number of ideal cardiovascular health components

kcj-51-922-i002
Characteristic Number of ideal cardiovascular health components p value
0 (n=1,892) 1 (n=7,734) 2 (n=12,989) 3 (n=14,298) 4 (n=12,761) 5 (n=9,476) 6 (n=2,258)
Age (years) 53.0±0.3 53.9±−0.2 52.2±0.2 47.8±0.2 42.0±0.2 36.1±0.2 34.4±0.3 <0.0001
Sex <0.0001
Male 92.0 (90.7–93.3) 69.7 (68.6–70.8) 60.2 (59.2–61.2) 53.6 (52.7–54.6) 42.4 (41.3–43.4) 26.1 (25.0–27.2) 23.4 (21.0–25.7)
Female 8.0 (6.7–9.3) 30.3 (29.2–31.4) 39.8 (38.8–40.8) 46.4 (45.4–47.3) 57.6 (56.6–58.7) 73.9 (72.8–75.0) 76.6 (74.3–79.0)
Education level (n=61,337) <0.0001
Below high school 32.2 (29.8–34.5) 39.9 (38.5–41.3) 38.1 (36.9–39.3) 29.8 (28.8–30.8) 19.5 (18.7–20.4) 9.5 (8.8–10.2) 6.8 (5.7–7.9)
High school 35.4 (32.9–38.0) 31.6 (30.3–33.0) 33.2 (32.1–34.3) 36.6 (35.5–37.6) 41.6 (40.5–42.7) 41.7 (40.4–43.0) 41.6 (39.2–44.1)
College/university or above 32.4 (29.9–34.9) 28.5 (27.1–29.9) 28.7 (27.6–29.8) 33.6 (32.5–34.8) 38.9 (37.7–40.0) 48.8 (47.5–50.2) 51.5 (49.1–54.0)
Alcohol intake (drinks/week) (n=61,324) <0.0001
None 22.6 (20.5–24.7) 35.5 (34.2–36.8) 40.8 (39.8–41.9) 41.5 (40.5–42.5) 42.2 (41.2–43.3) 44.8 (43.6–46.0) 44.1 (41.6–46.5)
<3 per week 2.0 (1.4–2.6) 3.0 (2.6–3.4) 3.9 (3.5–4.3) 4.0 (3.7–4.4) 5.5 (5.0–5.9) 6.2 (5.7–6.8) 6.2 (5.1–7.2)
≥3 per week 75.4 (73.3–77.6) 61.6 (60.2–62.9) 55.3 (54.2–56.3) 54.5 (53.5–55.5) 52.3 (51.2–53.4) 49.0 (47.8–50.3) 49.8 (47.3–52.2)
Hypertension 62.9 (60.3–65.4) 56.3 (54.8–57.7) 42.3 (41.2–43.3) 25.1 (24.2–25.9) 9.3 (8.7–9.9) 1.5 (1.2–1.8) 0.0 (0.0–0.0) <0.0001
Diabetes mellitus 33.2 (30.7–35.7) 25.4 (24.2–26.5) 15.5 (14.8–16.2) 6.6 (6.1–7.1) 1.9 (1.6–2.1) 0.3 (0.2–0.4) 0.0 (0.0–0.0) <0.0001
Total cholesterol (mg/dL) 215.4±1.1 206.0±0.5 200.4±0.4 192.2±0.3 182.3±0.3 170.0±0.3 165.5±0.5 <0.0001
Triglyceride (mg/dL) 243.0±5.4 197.3±2.6 168.7±1.4 133.8±0.9 107.4±0.9 83.5±0.6 75.6±1.0 <0.0001
HDL-cholesterol (mg/dL) 46.1±0.3 46.7±0.1 47.5±0.1 49.5±0.1 51.8±0.1 54.0±0.2 54.7±0.3 <0.0001
Smoking Status <0.0001
Ideal 0.0 (0.0–0.0) 30.2 (29.1–31.4) 45.2 (44.1–46.3) 54.5 (53.5–55.5) 65.8 (64.7–66.9) 88.1 (87.3–88.9) 100 (100.0–100.0)
Intermediate 51.2 (48.5–53.9) 34.1 (32.8–35.3) 25.1 (24.2–26.1) 18.6 (17.9–19.4) 11.9 (11.2–12.6) 4.0 (3.5–4.5) 0.0 (0.0–0.0)
Poor 48.8 (46.1–51.5) 35.7 (34.3–37.1) 29.7 (28.7–30.7) 26.8 (25.9–27.8) 22.3 (21.3–23.3) 8.0 (7.2–8.7) 0.0 (0.0–0.0)
Physical activity <0.0001
Ideal 0.0 (0.0–0.0) 13.2 (12.3–14.2) 23.3 (22.3–24.2) 31.2 (30.2–32.2) 36.2 (35.3–37.3) 40.7 (39.5–41.8) 100 (100.0–100.0)
Intermediate 20.8 (18.6–23.1) 16.5 (15.4–17.6) 14.2 (13.5–15.0) 13.7 (13.0–14.4) 13.9 (13.1–14.6) 13.5 (12.7–14.3) 0.0 (0.0–0.0)
Poor 79.2 (76.9–81.4) 70.3 (69.0–71.6) 62.5 (61.4–63.6) 55.1 (54.0–56.2) 49.9 (48.7–51.0) 45.9 (44.6–47.1) 0.0 (0.0–0.0)
Body mass index (kg/m2) <0.0001
Ideal 0.0 (0.0–0.0) 6.8 (6.1–7.4) 18.3 (17.5–19.1) 35.8 (34.8–36.7) 59.9 (58.8–61.0) 85.8 (84.9–86.6) 100 (100.0–100.0)
Intermediate 30.0 (27.5–32.4) 31.0 (29.8–32.2) 31.2 (30.2–32.2) 28.6 (27.7–29.5) 20.8 (19.9–21.7) 8.0 (7.3–8.6) 0.0 (0.0–0.0)
Poor 70.0 (67.6–72.5) 62.2 (60.9–63.5) 505 (49.5–51.6) 35.6 (34.6–36.6) 19.3 (18.4–20.1) 6.3 (5.7–6.9) 0.0 (0.0–0.0)
Total cholesterol (mg/dL) <0.0001
Ideal 0.0 (0.0–0.0) 20.2 (19.2–21.3) 39.5 (38.4–40.5) 57.3 (56.3–58.2) 73.8 (72.9–74.7) 92.5 (91.9–93.1) 100 (100.0–100.0)
Intermediate 71.5 (69.0–73.9) 60.3 (59.0–61.5) 45.6 (44.6–46.7) 33.5 (32.6–34.4) 21.5 (20.7–22.3) 6.4 (5.9–7.0) 0.0 (0.0–0.0)
Poor 28.5 (26.1–31.0) 19.5 (18.5–20.6) 14.9 (14.2–15.6) 9.2 (8.7–9.8) 4.7 (4.3–5.1) 1.0 (0.8–1.3) 0.0 (0.0–0.0)
Blood pressure (mm Hg) <0.0001
Ideal 0.0 (0.0–0.0) 7.2 (6.5–8.0) 20.9 (20.0–21.8) 44.9 (43.9–46.0) 72.8 (71.8–73.8) 94.4 (93.9–95.0) 100 (100.0–100.0)
Intermediate 59.4 (56.7–62.1) 56.2 (54.9–57.6) 51.6 (50.6–52.7) 39.5 (38.5–40.6) 21.6 (20.7–22.5) 4.7 (4.2–5.2) 0.0 (0.0–0.0)
Poor 40.6 (37.9–43.3) 36.5 (35.3–37.8) 27.5 (26.5–28.4) 15.5 (14.8–16.2) 5.6 (5.2–6.0) 0.9 (0.7–1.1) 0.0 (0.0–0.0)
Fasting glucose (mg/dL) <0.0001
Ideal 0.0 (0.0–0.0) 22.3 (21.0–23.5) 52.9 (51.8–54.0) 76.3 (75.5–77.2) 91.5 (90.9–92.0) 98.5 (98.3–98.8) 100 (100.0–100.0)
Intermediate 74.2 (71.9–76.5) 59.6 (58.2–60.9) 36.5 (35.4–37.5) 19.3 (18.5–20.1) 7.5 (7.0–8.0) 1.4 (1.1–1.6) 0.0 (0.0–0.0)
Poor 25.8 (23.5–28.1) 18.2 (17.1–19.2) 10.6 (10.0–11.3) 4.4 (4.0–4.8) 1.0 (0.8–1.2) 0.1 (0.0–0.2) 0.0 (0.0–0.0)
Values are presented as weighted prevalence (95% confidence interval) or weighted mean±standard deviation.
DBP = diastolic blood pressure; HDL = high-density lipoprotein; SBP = systolic blood pressure.

Sex- and age-specific trends in cardiovascular health

Among Korean adults aged 20 years or older, the average number ideal CVH components significantly decreased from 3.37 in 2007–2009 to 2.86 in 2016–2018 (p for trend, <0.0001; Table 3). Indeed, whereas the number of participants with zero ideal CVH components more than doubled (1.9–4.9%), those with optimal CVH had markedly decreased (5.5–2.5%). Such decline was observed regardless of sex and age (Table 3, Figure 1, Supplementary Tables 1 and 2). As expected, the number ideal CVH components was lower with older age. Within each age group, men had worse CVH than women, with the largest discrepancy observed in age group 40–49 years (men, 2.11 versus women, 3.60). Whereas the proportion of women with zero ideal CVH components was minimal across all phases in all age groups, considerable proportion of men, though young, had suboptimal CVH. By 2018, Korean men aged 50–59 years had alarmingly low (1.84) number of ideal CVH components.
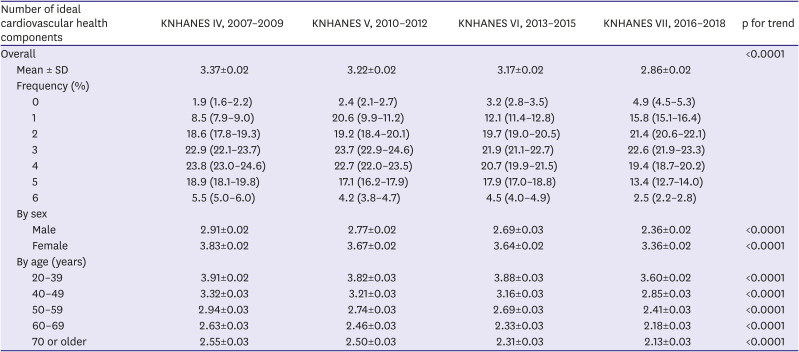
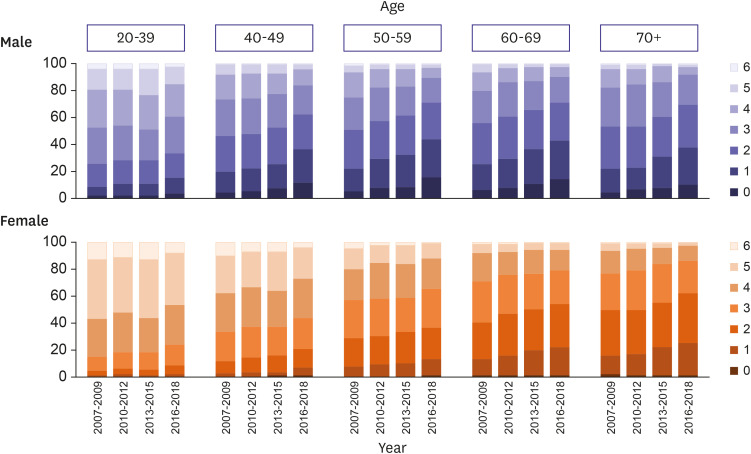
Table 3

Distributions of the number of ideal cardiovascular health components among Korean adults aged 20 years or older

kcj-51-922-i003
Number of ideal cardiovascular health components KNHANES IV, 2007–2009 KNHANES V, 2010–2012 KNHANES VI, 2013–2015 KNHANES VII, 2016–2018 p for trend
Overall <0.0001
Mean ± SD 3.37±0.02 3.22±0.02 3.17±0.02 2.86±0.02
Frequency (%)
0 1.9 (1.6–2.2) 2.4 (2.1–2.7) 3.2 (2.8–3.5) 4.9 (4.5–5.3)
1 8.5 (7.9–9.0) 20.6 (9.9–11.2) 12.1 (11.4–12.8) 15.8 (15.1–16.4)
2 18.6 (17.8–19.3) 19.2 (18.4–20.1) 19.7 (19.0–20.5) 21.4 (20.6–22.1)
3 22.9 (22.1–23.7) 23.7 (22.9–24.6) 21.9 (21.1–22.7) 22.6 (21.9–23.3)
4 23.8 (23.0–24.6) 22.7 (22.0–23.5) 20.7 (19.9–21.5) 19.4 (18.7–20.2)
5 18.9 (18.1–19.8) 17.1 (16.2–17.9) 17.9 (17.0–18.8) 13.4 (12.7–14.0)
6 5.5 (5.0–6.0) 4.2 (3.8–4.7) 4.5 (4.0–4.9) 2.5 (2.2–2.8)
By sex
Male 2.91±0.02 2.77±0.02 2.69±0.03 2.36±0.02 <0.0001
Female 3.83±0.02 3.67±0.02 3.64±0.02 3.36±0.02 <0.0001
By age (years)
20–39 3.91±0.02 3.82±0.03 3.88±0.03 3.60±0.02 <0.0001
40–49 3.32±0.03 3.21±0.03 3.16±0.03 2.85±0.03 <0.0001
50–59 2.94±0.03 2.74±0.03 2.69±0.03 2.41±0.03 <0.0001
60–69 2.63±0.03 2.46±0.03 2.33±0.03 2.18±0.03 <0.0001
70 or older 2.55±0.03 2.50±0.03 2.31±0.03 2.13±0.03 <0.0001
Values are presented as weighted prevalence (95% confidence interval) or weighted mean±SD.
KNHANES = Korea National Health and Nutrition Examination Survey; SD = standard deviation.
Figure 1

Temporal trends in the number of ideal cardiovascular health components by sex and age.

kcj-51-922-g001
For each sex-age group, the distribution of individual CVH component followed different temporal trends between 2007–2018 (Table 4, Figures 2 and 3, Supplementary Tables 3, 4, 5, 6, 7, 8, 9, 10, 11, 12).
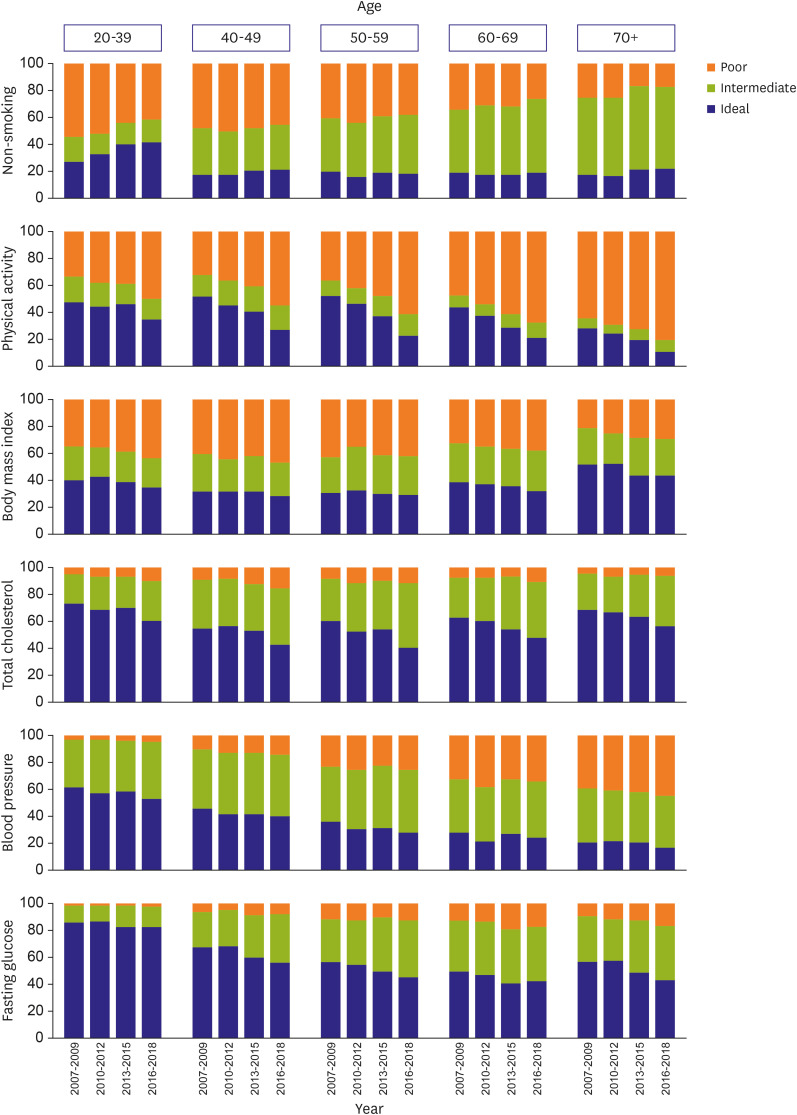
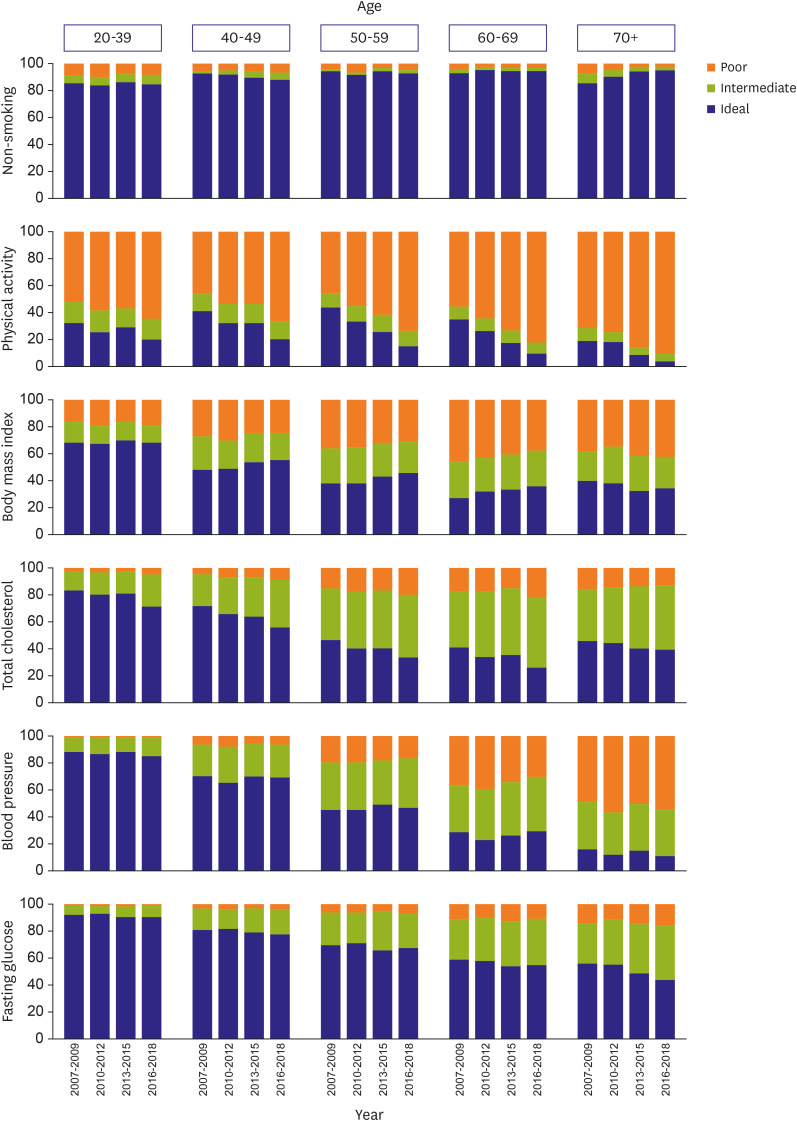
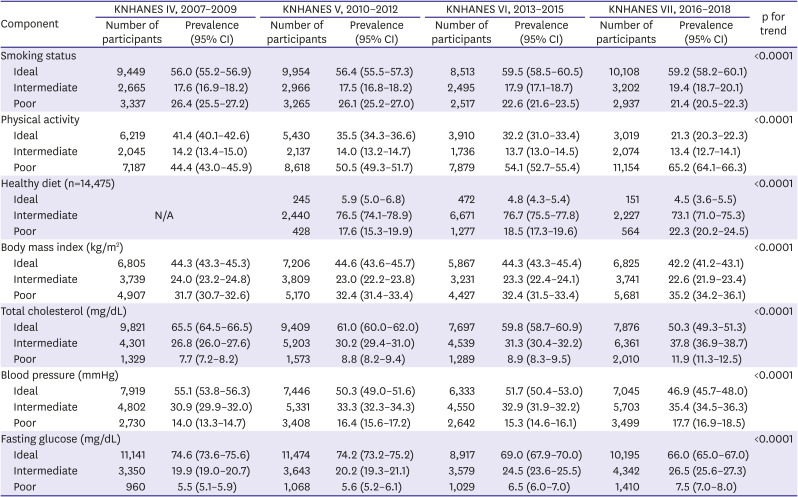
Table 4

Distributions of ideal, intermediate, or poor level of cardiovascular health components among Korean adults aged 20 years or older

kcj-51-922-i004
Component KNHANES IV, 2007–2009 KNHANES V, 2010–2012 KNHANES VI, 2013–2015 KNHANES VII, 2016–2018 p for trend
Number of participants Prevalence (95% CI) Number of participants Prevalence (95% CI) Number of participants Prevalence (95% CI) Number of participants Prevalence (95% CI)
Smoking status <0.0001
Ideal 9,449 56.0 (55.2–56.9) 9,954 56.4 (55.5–57.3) 8,513 59.5 (58.5–60.5) 10,108 59.2 (58.2–60.1)
Intermediate 2,665 17.6 (16.9–18.2) 2,966 17.5 (16.8–18.2) 2,495 17.9 (17.1–18.7) 3,202 19.4 (18.7–20.1)
Poor 3,337 26.4 (25.5–27.2) 3,265 26.1 (25.2–27.0) 2,517 22.6 (21.6–23.5) 2,937 21.4 (20.5–22.3)
Physical activity <0.0001
Ideal 6,219 41.4 (40.1–42.6) 5,430 35.5 (34.3–36.6) 3,910 32.2 (31.0–33.4) 3,019 21.3 (20.3–22.3)
Intermediate 2,045 14.2 (13.4–15.0) 2,137 14.0 (13.2–14.7) 1,736 13.7 (13.0–14.5) 2,074 13.4 (12.7–14.1)
Poor 7,187 44.4 (43.0–45.9) 8,618 50.5 (49.3–51.7) 7,879 54.1 (52.7–55.4) 11,154 65.2 (64.1–66.3)
Healthy diet (n=14,475) <0.0001
Ideal N/A 245 5.9 (5.0–6.8) 472 4.8 (4.3–5.4) 151 4.5 (3.6–5.5)
Intermediate 2,440 76.5 (74.1–78.9) 6,671 76.7 (75.5–77.8) 2,227 73.1 (71.0–75.3)
Poor 428 17.6 (15.3–19.9) 1,277 18.5 (17.3–19.6) 564 22.3 (20.2–24.5)
Body mass index (kg/m2) <0.0001
Ideal 6,805 44.3 (43.3–45.3) 7,206 44.6 (43.6–45.7) 5,867 44.3 (43.3–45.4) 6,825 42.2 (41.2–43.1)
Intermediate 3,739 24.0 (23.2–24.8) 3,809 23.0 (22.2–23.8) 3,231 23.3 (22.4–24.1) 3,741 22.6 (21.9–23.4)
Poor 4,907 31.7 (30.7–32.6) 5,170 32.4 (31.4–33.4) 4,427 32.4 (31.5–33.4) 5,681 35.2 (34.2–36.1)
Total cholesterol (mg/dL) <0.0001
Ideal 9,821 65.5 (64.5–66.5) 9,409 61.0 (60.0–62.0) 7,697 59.8 (58.7–60.9) 7,876 50.3 (49.3–51.3)
Intermediate 4,301 26.8 (26.0–27.6) 5,203 30.2 (29.4–31.0) 4,539 31.3 (30.4–32.2) 6,361 37.8 (36.9–38.7)
Poor 1,329 7.7 (7.2–8.2) 1,573 8.8 (8.2–9.4) 1,289 8.9 (8.3–9.5) 2,010 11.9 (11.3–12.5)
Blood pressure (mmHg) <0.0001
Ideal 7,919 55.1 (53.8–56.3) 7,446 50.3 (49.0–51.6) 6,333 51.7 (50.4–53.0) 7,045 46.9 (45.7–48.0)
Intermediate 4,802 30.9 (29.9–32.0) 5,331 33.3 (32.3–34.3) 4,550 32.9 (31.9–32.2) 5,703 35.4 (34.5–36.3)
Poor 2,730 14.0 (13.3–14.7) 3,408 16.4 (15.6–17.2) 2,642 15.3 (14.6–16.1) 3,499 17.7 (16.9–18.5)
Fasting glucose (mg/dL) <0.0001
Ideal 11,141 74.6 (73.6–75.6) 11,474 74.2 (73.2–75.2) 8,917 69.0 (67.9–70.0) 10,195 66.0 (65.0–67.0)
Intermediate 3,350 19.9 (19.0–20.7) 3,643 20.2 (19.3–21.1) 3,579 24.5 (23.6–25.5) 4,342 26.5 (25.6–27.3)
Poor 960 5.5 (5.1–5.9) 1,068 5.6 (5.2–6.1) 1,029 6.5 (6.0–7.0) 1,410 7.5 (7.0–8.0)
CI = confidence interval; KNHANES = Korea National Health and Nutrition Examination Survey.
Figure 2

Temporal trends in the distribution of ideal, intermediate, or poor level for each cardiovascular health component among Korean men.

kcj-51-922-g002
Figure 3

Temporal trends in the distribution of ideal, intermediate, or poor level for each cardiovascular health component among Korean women.

kcj-51-922-g003

Trends in individual cardiovascular health component

The proportion of never smokers increased from 56.0% in 2007–2009 to 59.2% in 2016–2018. This increase was largely contributed by young (20–39 years) men, whose prevalence of current smoking decreased by 12.9% (from 54.1–41.2%) (Supplementary Table 3). Furthermore, sizable decline in tobacco use was also observed among men aged 60 years or older and women aged 70 years or older (Supplementary Tables 9, 10, 11, 12). On the other hand, the prevalence of current smoking, albeit low, slightly increased in middle-aged women (Supplementary Tables 6 and 8).
Compared to 2007–2009, the proportion of Korean adults who fulfilled the guideline-recommended physical activity level halved in 2016–2018 (41.4–21.3%). More worrisome finding was that 65.2% were totally sedentary. This marked decrease in physical activity was observed in all sex-age strata. In general, physical inactivity was more pronounced in women and escalated with older age. In fact, nearly all elderly (age 70+ years) women did not engage in moderate-to-vigorous physical activity (Supplementary Table 12). Although young men were most likely to engage in ideal level of physical activity (34.9%), the other half remained sedentary (Supplementary Table 3).
Among a subset of participants under age 65 years, the prevalence of ideal diet decreased from 5.9% in 2012 to 4.5% in 2016. By 2016, the prevalence of poor diet was moderately high (22.3%). Notably, this deterioration was observed in young adults and substantially in middle-aged men (Supplementary Tables 3, 4, 5). Furthermore, the prevalence of ideal diet declined from 6.5% to 1.4% in men of fourth decade. In contrast, ideal diet became more common in women 50–64 years; nonetheless, majority of them remained in intermediate category (Supplementary Tables 8 and 10).
The prevalence of ideal BMI decreased from 44.3% to 42.2% between 2007 and 2018. This reduction was particularly evident in young (40.1–34.3%) and elderly (60–69 years, 38.6–32.3%; 70+ years, 51.6–43.1%) men (Supplementary Tables 8, 9, and 11). In contrast, women followed different courses. Specifically, the prevalence of ideal BMI significantly increased in middle-to-old-aged women (40–49 years, 48.6–55.4%; 50–59 years, 38.2–46.0%; 60–69 years, 27.3–36.3%) (Supplementary Tables 6, 8, and 10). However, such trend reversed by age 70 years, as the prevalence of obesity increased up to 42.3% (Supplementary Table 12).
Between 2007 and 2018, the prevalence of ideal cholesterol decreased by 15 percent from 65.5% to 50.3%; vast proportion of these individuals were shifted down to intermediate cholesterol group. Concerningly, the proportion of young adults with high cholesterol nearly doubled in both men (5.4–9.8%) and women (2.4–5.2%) (Supplementary Tables 3 and 4). Furthermore, total cholesterol sharply worsened in adults of fifth and sixth decade and more profoundly in men (Supplementary Tables 7, 8, 9, 10). Yet, whereas the prevalence of ideal cholesterol was lower in young-to-middle-aged men, it drastically plunged in women from fifth decade. Between 2016–2018, only 1 out of 4 women aged 60–69 years had ideal cholesterol. Onwards, it was restored in elderly population over age 70 years (Supplementary Tables 11 and 12).
Overall, the prevalence of ideal BP declined from 55.1% to 46.9% between 2007 and 2018. There was a clear negatively graded trend by age, as the prevalence of ideal BP reached its nadir in the oldest groups (Supplementary Tables 11 and 12). In terms of sex, BP worsened in men of all age groups, especially in the young (61.6–52.5%) (Supplementary Table 3). In contrast, the proportion of middle-aged women with ideal BP modestly increased with discernible reduction in poor BP group (Supplementary Tables 8 and 10).
The proportion of adults with ideal glucose decreased from 74.6% to 66.0% between 2007 and 2018. Such decline was observed in all sex-age strata but comparatively greater and earlier in men. Whereas the prevalence of ideal glucose incrementally decreased in young adults, it sharply dropped by 11.6% in men 40-49 years (Supplementary Table 5); by fifth decade, less than half remained in ideal glucose group (Supplementary Table 7). On the other hand, the prevalence of ideal glucose in women underwent relatively negligible change until age 70 years, when it decreased by 12.4% from 56.4% to 44.0% (Supplementary Tables 4, 6, 8, and 10).

DISCUSSION

Between 2007 and 2018, the overall CVH has worsened among Korean adults, as the number of ideal CVH components decreased from 3.37 to 2.86. Nonetheless, the underlying reason and magnitude of such deterioration was not uniform across sex and age groups. Whereas the number of ideal CVH components was lower with male sex and old age, the decline was more apparent in young-to-middle-aged adults. On an optimistic note, select CVH components, notably cigarette smoking, have modestly improved. As a sizable proportion of atherosclerotic CVD events are avoidable through primordial prevention and adequate control of traditional cardiovascular risk factors, tailored and immediate strategies are crucial.
CVD prevention effects of tobacco avoidance,16) sufficient physical activity,17) healthy diet18) and normal range BMI,19) cholesterol,20) BP,21) and glucose levels22) have been previously established in Korean population. Similar associations have been reported between comprehensive CVH metrics with subclinical CVD, including coronary artery calcium progression.23) Beyond single-occasion CVH measurement, previous literature has examined the associations of favorable lifetime CVH with lowered CVD risks.24) Promotion and preservation of ideal CVH, or even regaining lost CVH, early in life have been associated with reduced CVD risk later on.25)
Routine surveillance of CVD risk factors provides overview and changes in disease burden, serves as basis for up-to-date clinical practice guidelines, and enhances shared decision-making. The current study extends the previous findings by presenting sex- and age-specific temporal appraisal of both lifestyle and clinical risk factors. Our stratified approach is highly relevant as underlying pathophysiology, clinical manifestations, and healthcare seeking behavior are known to differ by sex.26) Whereas the strengths of cardiovascular risk factors are generally reduced with older age, low-density lipoprotein cholesterol, BMI, and fasting glucose remain significantly pertinent to incident CVD in laterlife.27) Thus, lifetime partnership between clinicians and patients may minimize atherosclerotic progression via accounting for individual health history, assessing feasibility of lifestyle modification, implementing measurable goals, and monitoring of progress.28)
Concerningly, recent nationwide data has shown suboptimal hypertension management rates in young adults,29) low diabetes control rate irrespective of age,10) and stagnant dyslipidemia control rate among treated individuals.9) These data align with non-benign proportion of young, middle-aged, and elderly population with poor CVH in our study. To underscore the modifiability of risk factors, the Korean government and scientific organizations have been implementing wide range of health promotion programs, including national smoking cessation support, sodium reduction, physical activity promotion, May Measurement Month for hypertension awareness raising, and more. However, as the risk factor distributions are not uniform across demographics and life course, CVD prevention strategies, naturally, should also depart from reductionist approach.
The current international guidelines on the primary CVD prevention focus on individualized assessment of risk scores as thresholds for preventive strategies.28) The risk scores provide opportunity for early CVD prevention on the basis of the likelihood of CVD events to come within the next 10 years. However, the risk scores are applicable only after middle age, by which ideal CVH is already rare. At younger age, risk scores are usually low and uninformative even in the presence of poor lifestyle and multiple risk factors.30) For now, the CVH metric can be used as an early surrogate for risk factor burden and lifetime CVD risk in young adults. In the future, a more individualized approach should take place in monitoring CVD risk burden throughout the life course. As the potential of precision medicine has surfaced, early preventive strategies based on tailored CVD risk assessment may stagnate or reverse the current worsening trends of CVH.
Based on nationally-representative datasets and demographic stratification, the current study illustrated 12-year trends in CVH and underlying components responsible for such changes. The current findings may serve as evidence for sex- and age-specific initiatives to preserve, to sustain, and to restore ideal CVH. Nonetheless, our study warrants several limitations. Foremost, our main analysis relied on non-dietary CVH metrics, as only a subset of young-to-middle-aged adults underwent dietary assessment over a 5-year period. Nonetheless, the available data suggests consistently mediocre proportion of ideal diet in all sex and age groups, likewise shown in a low-risk Korean cohort.24 Second, the exact collection methods differ across each KNHANES phase. Therefore, there are inherent variations that may have led to misclassification of CVH status. Third, our analysis did not account for social determinants of CVD. Future prospective cohort study with repeated CVH measures should track longitudinal changes across participants with various socioeconomic status, health literacy, and more.
In conclusion, the proportion of Korean adults with ideal CVH decreased between 2007 and 2018, but the course of responsible risk factors differed across sex and age groups. These findings suggest that public programs and healthcare should be flexible to address individual's readiness and capacity for adoption and intensification of preventive strategies.

ACKNOWLEDGMENTS

We appreciate all participants, physicians, medical technicians, interviewers, and the expert committees for contributing, organizing, and publishing of the Korea National Health and Nutrition Examination Survey (KNHANES) data.

Notes

Funding: This research was supported by a grant of the Korea Health Technology R&D Project through the Korea Health Industry Development Institute (KHIDI), funded by the Ministry of Health & Welfare, Republic of Korea (grant No.: HI19C123). The funder had no role in study design, data collection and analysis, decision to publish, or preparation of the manuscript.

Conflict of Interest: The authors have no financial conflicts of interest.

Data Sharing Statement: The data generated in this study is available from the corresponding author upon reasonable request.

Author Contributions:

  • Conceptualization: Cho SMJ, Lee H.

  • Data curation: Cho SMJ.

  • Formal analysis: Cho SMJ.

  • Funding acquisition: Cho SMJ.

  • Investigation: Cho SMJ, Kim HC.

  • Methodology: Cho SMJ, Lee H, Kim HC.

  • Project administration: Lee H, Kim HC.

  • Resources: Kim HC.

  • Software: Kim HC.

  • Supervision: Kim HC.

  • Validation: Cho SMJ, Lee H, Kim HC.

  • Visualization: Cho SMJ.

  • Writing - original draft: Cho SMJ.

  • Writing - review & editing: Cho SMJ, Lee H, Kim HC.

References

1. Roth GA, Mensah GA, Johnson CO, et al. Global burden of cardiovascular diseases and risk factors, 1990–2019 Update from the GBD 2019 Study. J Am Coll Cardiol. 2020; 76:2982–3021. PMID: 33309175.
2. Baek J, Lee H, Lee HH, Heo JE, Cho SMJ, Kim HC. Thirty-six year trends in mortality from diseases of circulatory system in Korea. Korean Circ J. 2021; 51:320–332. PMID: 33821581.
crossref
3. Park HK, Lee Y, Kang BW, et al. Progress on sodium reduction in South Korea. BMJ Glob Health. 2020; 5:e002028.
crossref
4. Park JW, Kwon SM, Kim NH. Analysis of studies on physical activity program for adults and elderly in Korea. Journal of Digital Convergence. 2013; 11:651–659.
crossref
5. Oh SW. The current status and challenges of national smoking cessation support program in Korea. Korean J Fam Med. 2019; 40:351–352. PMID: 31779062.
crossref
6. Lee J, Kim HS, Kim DJ. Recent technology-driven advancements in cardiovascular disease prevention. Cardiovasc Prev Pharmacother. 2019; 1:43–49.
7. Lee HH, Cho SMJ, Lee H, et al. Korea heart disease fact sheet 2020: analysis of nationwide data. Korean Circ J. 2021; 51:495–503. PMID: 34085422.
crossref
8. Kim HC, Cho SMJ, Lee H, et al. Korea hypertension fact sheet 2020: analysis of nationwide population-based data. Clin Hypertens. 2021; 27:8. PMID: 33715619.
crossref
9. Cho SMJ, Lee H, Lee HH, et al. Dyslipidemia fact sheets in Korea 2020: an analysis of nationwide population-based data. J Lipid Atheroscler. 2021; 10:202–209. PMID: 34095012.
crossref
10. Jung CH, Son JW, Kang S, et al. Diabetes fact sheets in Korea, 2020: an appraisal of current status. Diabetes Metab J. 2021; 45:1–10. PMID: 33434426.
crossref
11. Lloyd-Jones DM, Hong Y, Labarthe D, et al. Defining and setting national goals for cardiovascular health promotion and disease reduction: the American Heart Association's strategic Impact Goal through 2020 and beyond. Circulation. 2010; 121:586–613. PMID: 20089546.
12. Lee DH, Nam JY, Kwon S, et al. Lifestyle risk score and mortality in Korean adults: a population-based cohort study. Sci Rep. 2020; 10:10260. PMID: 32581249.
crossref
13. Jousilahti P, Vartiainen E, Tuomilehto J, Puska P. Sex, age, cardiovascular risk factors, and coronary heart disease: a prospective follow-up study of 14 786 middle-aged men and women in Finland. Circulation. 1999; 99:1165–1172. PMID: 10069784.
14. Kweon S, Kim Y, Jang MJ, et al. Data resource profile: the Korea National Health and Nutrition Examination Survey (KNHANES). Int J Epidemiol. 2014; 43:69–77. PMID: 24585853.
crossref
15. Yook SM, Park S, Moon HK, Kim K, Shim JE, Hwang JY. Development of Korean Healthy Eating Index for adults using the Korea National Health and Nutrition Examination Survey data. J Nutr Health. 2015; 48:419.
crossref
16. Jee Y, Jung KJ, Lee S, Back JH, Jee SH, Cho SI. Smoking and atherosclerotic cardiovascular disease risk in young men: the Korean Life Course Health Study. BMJ Open. 2019; 9:e024453.
crossref
17. Min C, Yoo DM, Wee JH, Lee HJ, Byun SH, Choi HG. Mortality and cause of death in physical activity and insufficient physical activity participants: a longitudinal follow-up study using a national health screening cohort. BMC Public Health. 2020; 20:1469. PMID: 32993602.
crossref
18. Cho Y, Cudhea F, Park JH, et al. Estimating change in cardiovascular disease and diabetes burdens due to dietary and metabolic factors in Korea 1998–2011: a comparative risk assessment analysis. BMJ Open. 2016; 6:e013283.
crossref
19. Jee SH, Pastor-Barriuso R, Appel LJ, Suh I, Miller ER 3rd, Guallar E. Body mass index and incident ischemic heart disease in South Korean men and women. Am J Epidemiol. 2005; 162:42–48. PMID: 15961585.
crossref
20. Kwon D, Yi JJ, Ohrr H, Yi SW. Total cholesterol and mortality from ischemic heart disease and overall cardiovascular disease in Korean adults. Medicine (Baltimore). 2019; 98:e17013. PMID: 31490384.
crossref
21. Lee H, Cho SMJ, Park JH, Park S, Kim HC. 2017 ACC/AHA blood pressure classification and cardiovascular disease in 15 million adults of age 20–94 years. J Clin Med. 2019; 8:1832.
crossref
22. Kim HK, Kim CH, Kim EH, et al. Impaired fasting glucose and risk of cardiovascular disease in Korean men and women: the Korean Heart Study. Diabetes Care. 2013; 36:328–335. PMID: 23002083.
23. Kim S, Chang Y, Cho J, et al. Life's simple 7 cardiovascular health metrics and progression of coronary artery calcium in a low-risk population. Arterioscler Thromb Vasc Biol. 2019; 39:826–833. PMID: 30700133.
crossref
24. Corlin L, Short MI, Vasan RS, Xanthakis V. Association of the duration of ideal cardiovascular health through adulthood with cardiometabolic outcomes and mortality in the Framingham Offspring Study. JAMA Cardiol. 2020; 5:549–556. PMID: 32159731.
crossref
25. Lee H, Yano Y, Cho SMJ, et al. Associations of ideal cardiovascular health and its change during young adulthood with premature cardiovascular events: a nationwide cohort study. Circulation. 2021; 144:90–92. PMID: 34120447.
crossref
26. Mosca L, Barrett-Connor E, Wenger NK. Sex/gender differences in cardiovascular disease prevention: what a difference a decade makes. Circulation. 2011; 124:2145–2154. PMID: 22064958.
27. Lind L, Sundström J, Ärnlöv J, Lampa E. Impact of aging on the strength of cardiovascular risk factors: a longitudinal study over 40 years. J Am Heart Assoc. 2018; 7:e007061. PMID: 29306895.
crossref
28. Arnett DK, Blumenthal RS, Albert MA, et al. 2019 ACC/AHA guideline on the primary prevention of cardiovascular disease: a report of the American College of Cardiology/American Heart Association Task Force on Clinical Practice Guidelines. Circulation. 2019; 140:e596–e646. PMID: 30879355.
crossref
29. Lee H, Yano Y, Cho SMJ, et al. Adherence to antihypertensive medication and incident cardiovascular events in young adults with hypertension. Hypertension. 2021; 77:1341–1349. PMID: 33641364.
crossref
30. Cho SMJ, Lee H, Kim HC. Comparison and implication of the contemporary blood pressure guidelines on Korean population. Korean Circ J. 2020; 50:485–498. PMID: 32212423.
crossref

SUPPLEMENTARY MATERIALS

Supplementary Table 1

Distributions of the number of ideal cardiovascular health components among Korean men by age
kcj-51-922-s001.xls

Supplementary Table 2

Distributions of the number of ideal cardiovascular health components among Korean women by age
kcj-51-922-s002.xls

Supplementary Table 3

Distributions of ideal, intermediate, or poor level of cardiovascular health components among Korean men aged 20–39 years
kcj-51-922-s003.xls

Supplementary Table 4

Distributions of ideal, intermediate, or poor level of cardiovascular health components among Korean women aged 20–39 years
kcj-51-922-s004.xls

Supplementary Table 5

Distributions of ideal, intermediate, or poor level of cardiovascular health components among Korean men aged 40–49 years
kcj-51-922-s005.xls

Supplementary Table 6

Distributions of ideal, intermediate, or poor level of cardiovascular health components among Korean women aged 40–49 years
kcj-51-922-s006.xls

Supplementary Table 7

Distributions of ideal, intermediate, or poor level of cardiovascular health components among Korean men aged 50–59 years
kcj-51-922-s007.xls

Supplementary Table 8

Distributions of ideal, intermediate, or poor level of cardiovascular health components among Korean women aged 50–59 years
kcj-51-922-s008.xls

Supplementary Table 9

Distributions of ideal, intermediate, or poor level of cardiovascular health components among Korean men aged 60–69 years
kcj-51-922-s009.xls

Supplementary Table 10

Distributions of ideal, intermediate, or poor level of cardiovascular health components among Korean women aged 60–69 years
kcj-51-922-s010.xls

Supplementary Table 11

Distributions of ideal, intermediate, or poor level of non-dietary cardiovascular health components among Korean men aged 70 years or older
kcj-51-922-s011.xls

Supplementary Table 12

Distributions of ideal, intermediate, or poor level of non-dietary cardiovascular health components among Korean women aged 70 years or older
kcj-51-922-s012.xls
TOOLS
Similar articles